| Param | Original file | Final file |
|---|---|---|
| Filename | modeM0/AS1A13_008T05_9000005996_44391cztM0_level2.fits | modeM0/AS1A13_008T05_9000005996_44391cztM0_level2_quad_clean.evt |
| Size (bytes) | 543,634,560 | 123,468,480 |
| Size | 518.5 MB | 117.7 MB |
| Events in quadrant A | 5,571,845 | 832,560 |
| Events in quadrant B | 4,494,916 | 843,484 |
| Events in quadrant C | 3,656,883 | 819,178 |
| Events in quadrant D | 5,802,571 | 707,223 |
| Mode SS | |||
|---|---|---|---|
| Quadrant | BADHDUFLAG | Total packets | Discarded packets |
| A | 0 | 156 | 0 |
| B | 0 | 156 | 0 |
| C | 0 | 156 | 0 |
| D | 0 | 156 | 0 |
| Mode M0 | |||
|---|---|---|---|
| Quadrant | BADHDUFLAG | Total packets | Discarded packets |
| A | 0 | 22916 | 1 |
| B | 0 | 18673 | 1 |
| C | 0 | 16473 | 1 |
| D | 0 | 22633 | 1 |
| Quadrant | Total seconds | Saturated seconds | Saturation percentage |
|---|---|---|---|
| A | 7697 | 118 | 1.533065% |
| B | 7698 | 193 | 2.507145% |
| C | 7698 | 43 | 0.558587% |
| D | 7698 | 606 | 7.872175% |
Noise dominated data is calculated using 1-second bins in cleaned event files. If a bin has >2000 counts, and if more than 50% of those come from <1% of pixels, then it is considered to be noise-dominated and hence unusable.
| Quadrant | # 1 sec bins | Bins with >0 counts | Bins with >2000 counts | High rate bins dominated by noise | Noise dominated (total time) | Noise dominated (detector-on time) | Marked lightcurve |
|---|---|---|---|---|---|---|---|
| A | 7727 | 7699 | 10 | 10 | 0.13% | 0.13% | 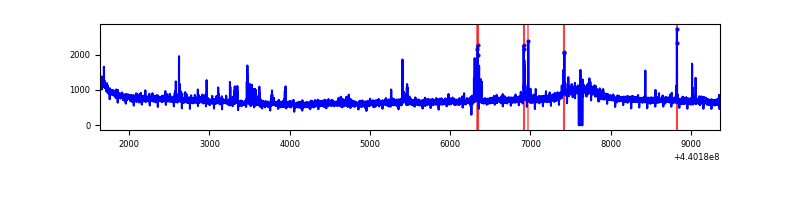 |
| B | 7728 | 7700 | 95 | 95 | 1.23% | 1.23% | 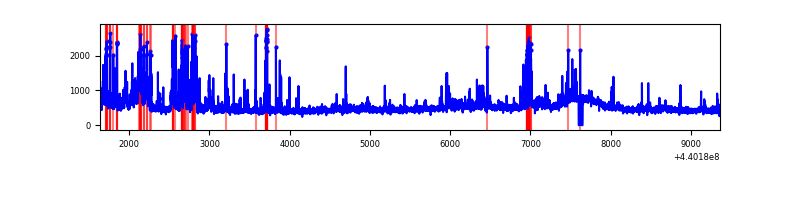 |
| C | 7728 | 7700 | 22 | 22 | 0.28% | 0.29% | 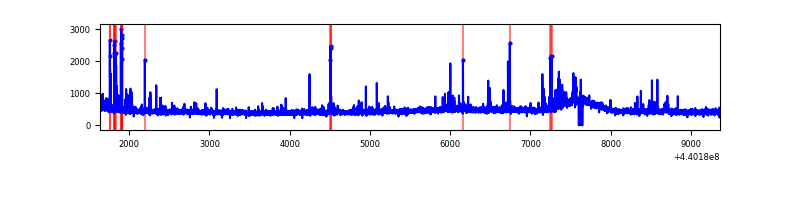 |
| D | 7728 | 7699 | 518 | 518 | 6.70% | 6.73% | 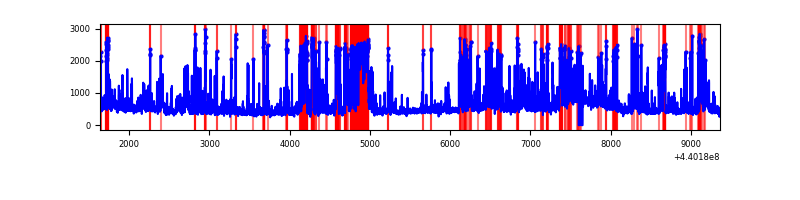 |
Top three noisy pixels from each quadrant. If the there are fewer than three noisy pixels in the level2.evt file, extra rows are filled as -1
| Pixel properties | Quadrant properties | ||||||
|---|---|---|---|---|---|---|---|
| Quadrant | DetID | PixID | Counts | Sigma | Mean | Median | Sigma |
| A | 10 | 83 | 1960571 | 10548.23 | 882 | 863 | 185.8 |
| A | 13 | 248 | 85945 | 457.96 | 882 | 863 | 185.8 |
| A | 14 | 254 | 44375 | 234.21 | 882 | 863 | 185.8 |
| B | 5 | 255 | 474103 | 2745.55 | 877 | 852 | 172.4 |
| B | 5 | 235 | 210367 | 1215.49 | 877 | 852 | 172.4 |
| B | 5 | 172 | 95996 | 551.97 | 877 | 852 | 172.4 |
| C | 14 | 254 | 152797 | 751.55 | 858 | 863 | 202.2 |
| C | 12 | 250 | 75134 | 367.38 | 858 | 863 | 202.2 |
| C | 14 | 96 | 24141 | 115.14 | 858 | 863 | 202.2 |
| D | 4 | 221 | 873824 | 4086.49 | 835 | 807 | 213.6 |
| D | 5 | 235 | 502259 | 2347.24 | 835 | 807 | 213.6 |
| D | 2 | 249 | 283667 | 1324.03 | 835 | 807 | 213.6 |
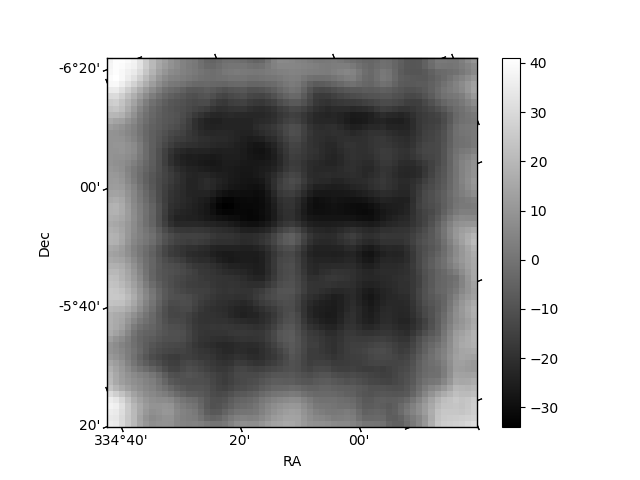
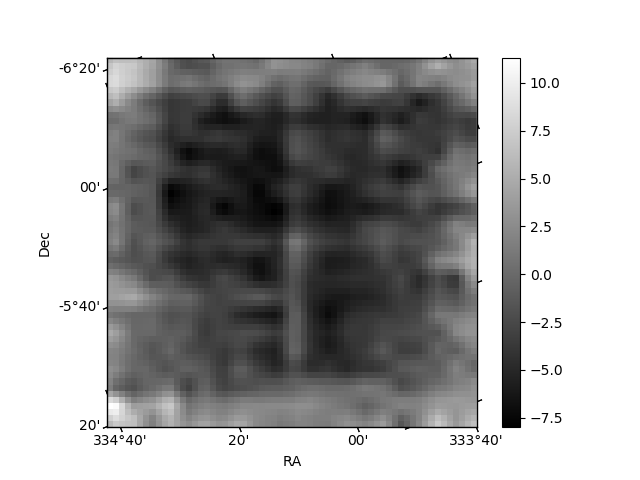
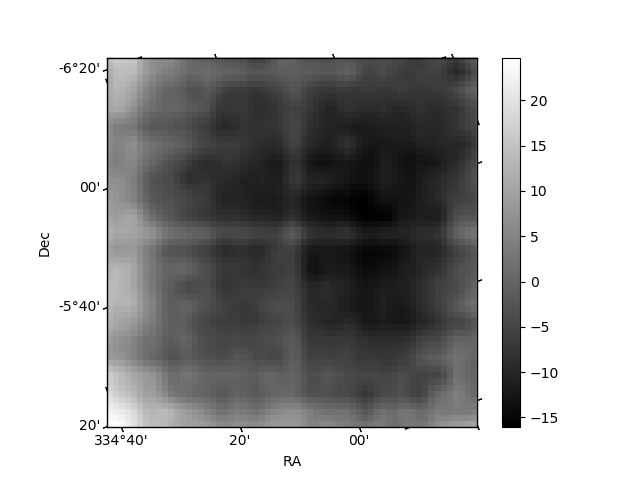
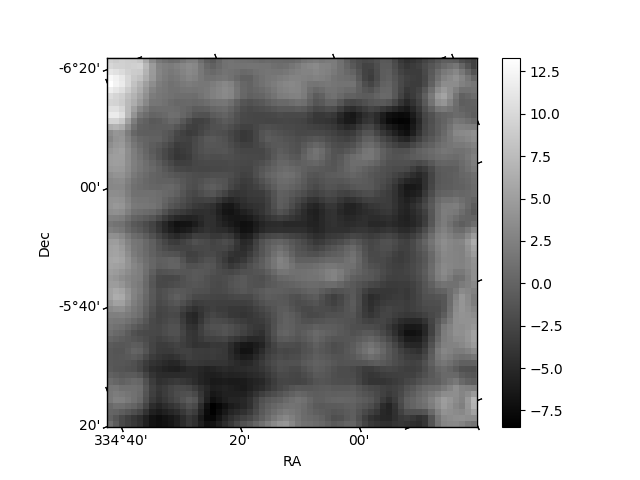
Histogram calculated using DETX and DETY for each event in the final _common_clean file
| Quadrant A | 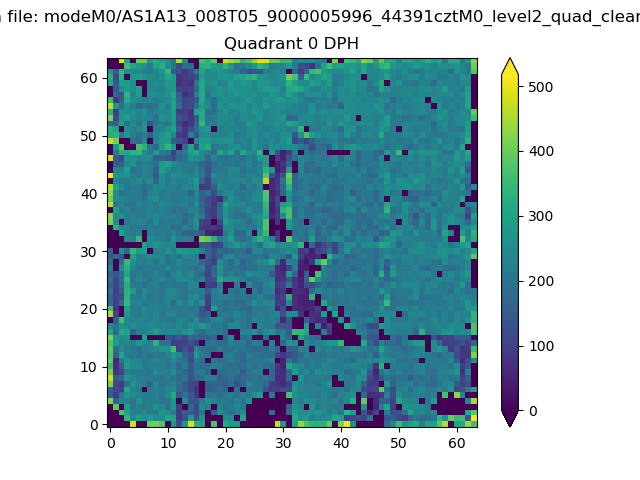 |
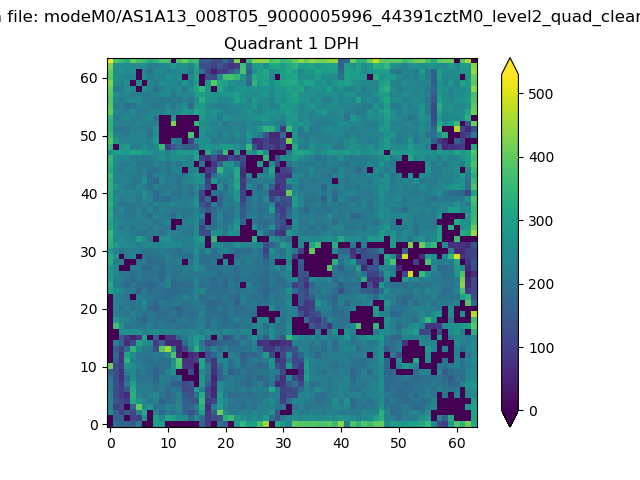 |
Quadrant B |
|---|---|---|---|
| Quadrant D | 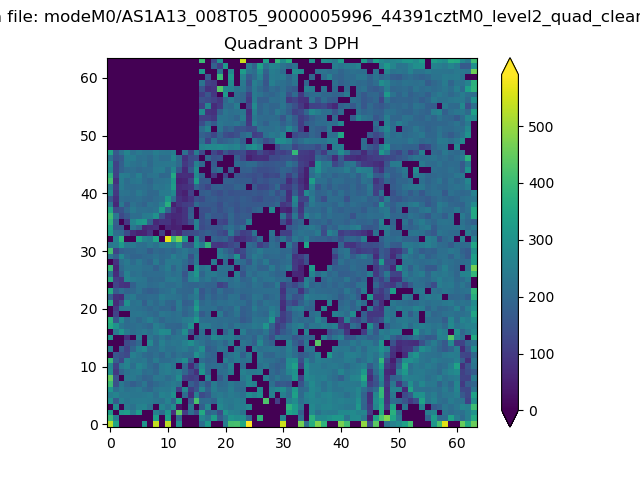 |
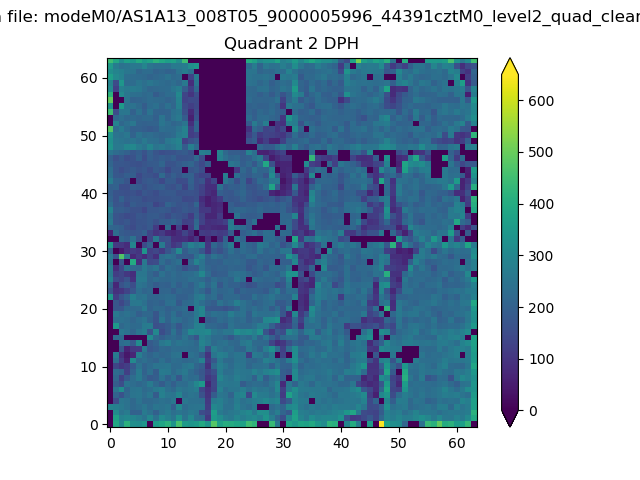 |
Quadrant C |
| Plot type | Count rate plots | Images |
|---|---|---|
| Comparison with Poisson distribution Blue bars denote a histogram of data divided into 1 sec bins. Red curve is a Poisson curve with rate = median count rate of data. |
 |
 |
| Quadrant-wise count rates Data is divided into 100 sec bins |
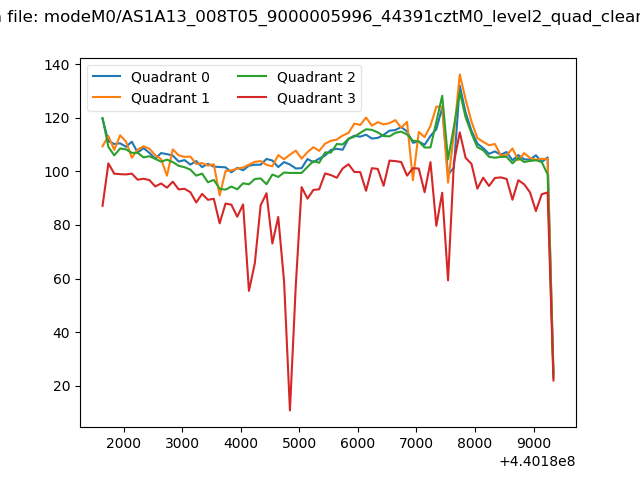 |
|
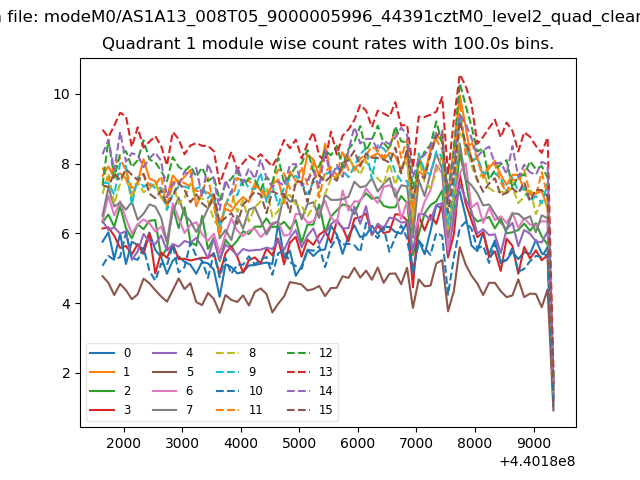
| Module-wise count rates for Quadrant A Data is divided into 100 sec bins |
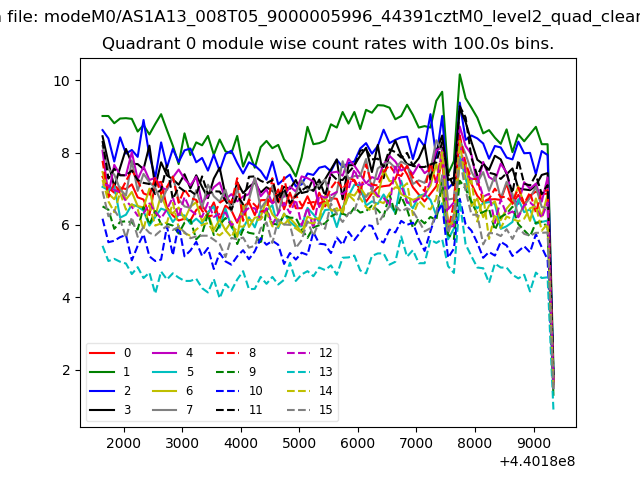 |
 |
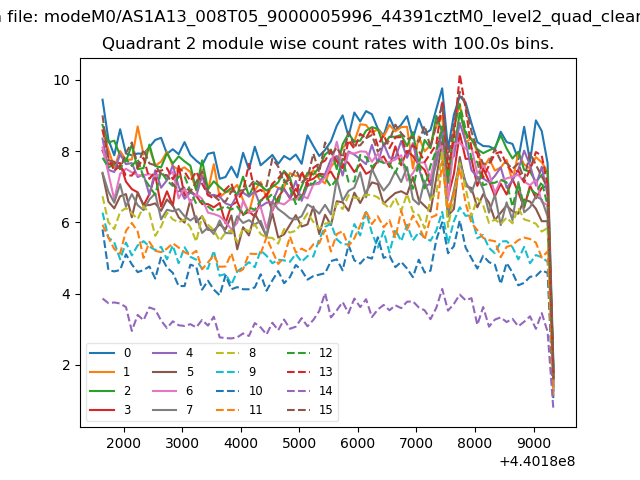
| Module-wise count rates for Quadrant B Data is divided into 100 sec bins |
 |
 |
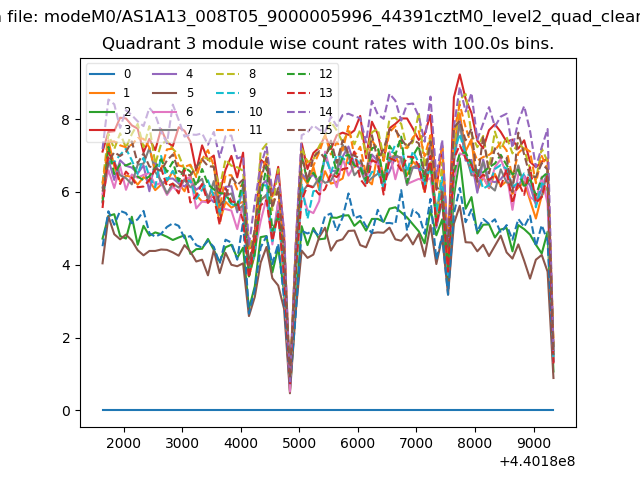
| Module-wise count rates for Quadrant C Data is divided into 100 sec bins |
 |
 |
| Module-wise count rates for Quadrant D Data is divided into 100 sec bins |
 |
 |
| Parameter | Plot |
|---|---|
| CZT HV Monitor | 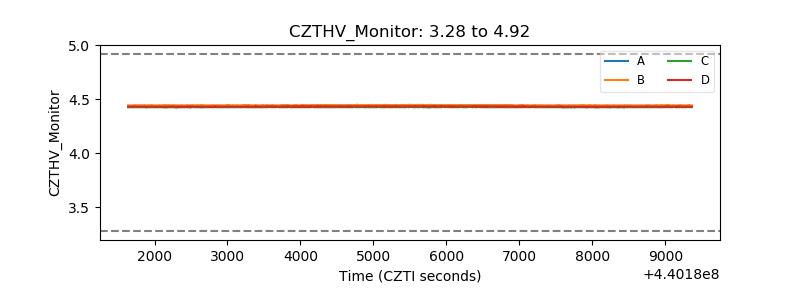 |
| D_VDD | 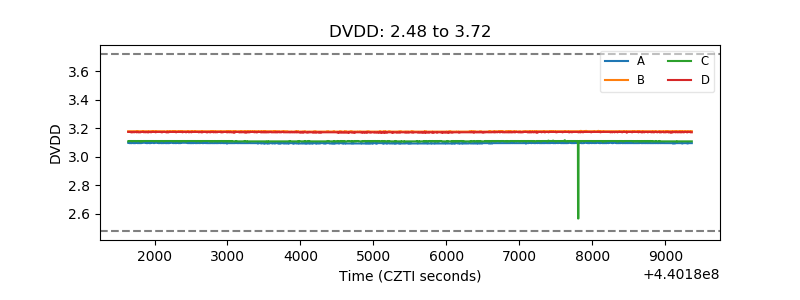 |
| Temperature 1 | 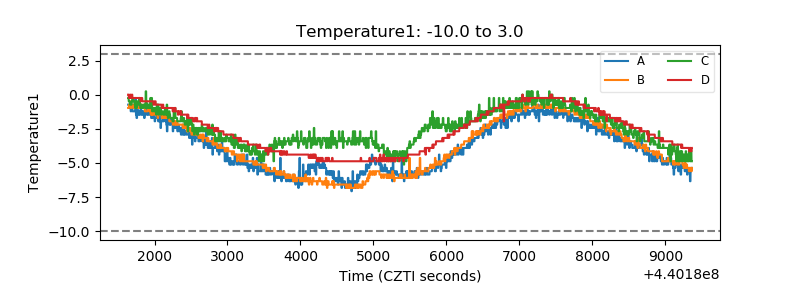 |
| Veto HV Monitor |  |
| Veto LLD | 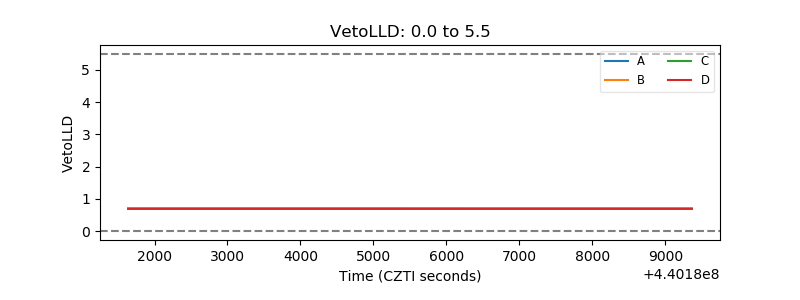 |
| Alpha Counter | 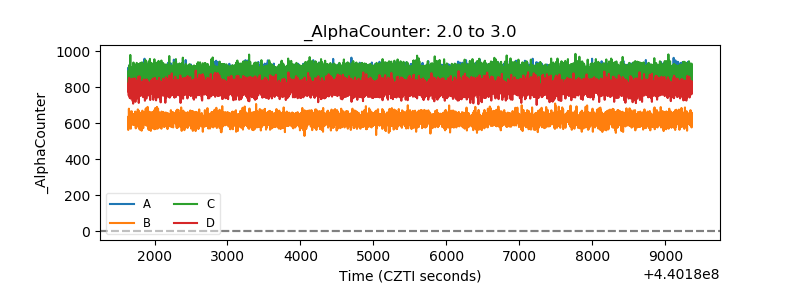 |
| _CPM_Rate | 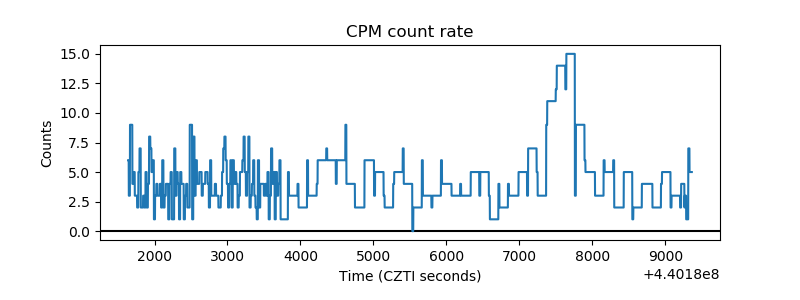 |
| CZT Counter | 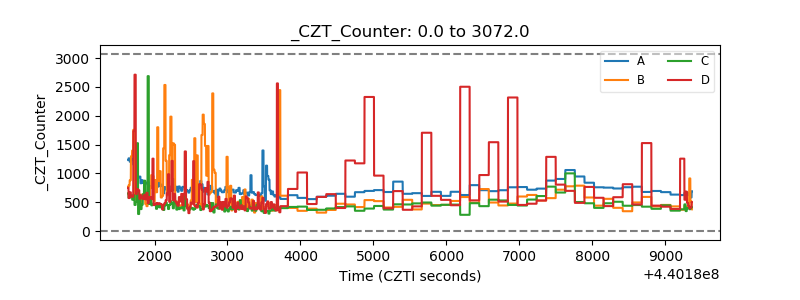 |
| +2.5 Volts monitor | 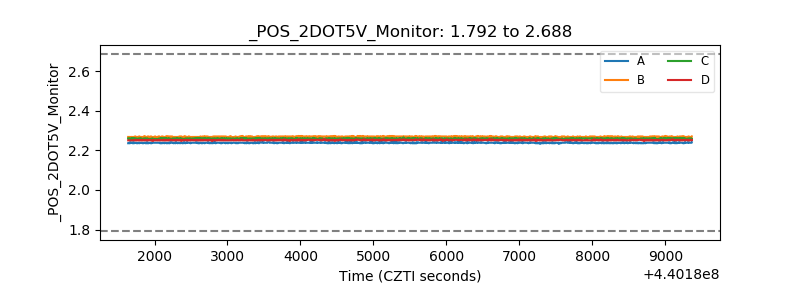 |
| +5 Volts monitor | 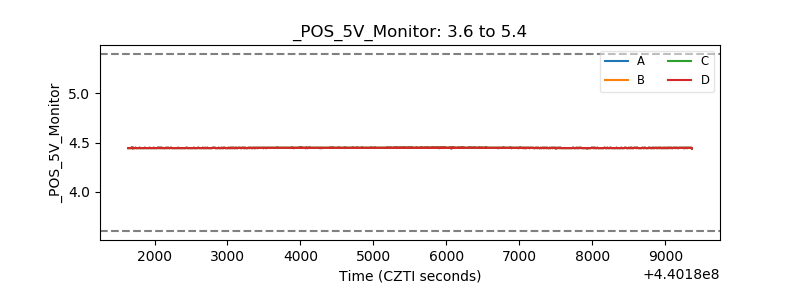 |
| _ROLL_ROT | 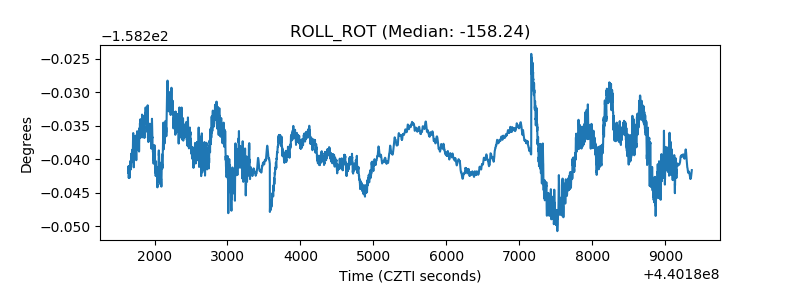 |
| _Roll_DEC | 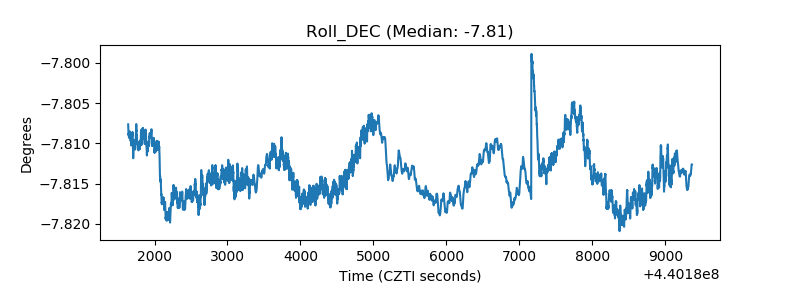 |
| _Roll_RA | 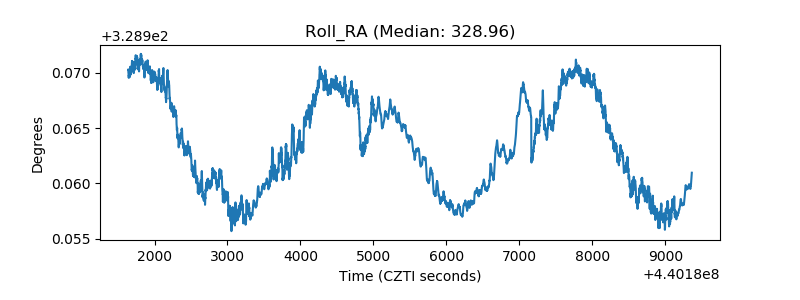 |
| Veto Counter |  |