| Param | Original file | Final file |
|---|---|---|
| Filename | modeM0/AS1A13_008T05_9000005996_44392cztM0_level2.fits | modeM0/AS1A13_008T05_9000005996_44392cztM0_level2_quad_clean.evt |
| Size (bytes) | 63,895,680 | 16,381,440 |
| Size | 60.9 MB | 15.6 MB |
| Events in quadrant A | 713,061 | 107,881 |
| Events in quadrant B | 453,122 | 108,357 |
| Events in quadrant C | 435,389 | 105,680 |
| Events in quadrant D | 681,008 | 95,611 |
| Mode SS | |||
|---|---|---|---|
| Quadrant | BADHDUFLAG | Total packets | Discarded packets |
| A | 0 | 22 | 0 |
| B | 0 | 22 | 0 |
| C | 0 | 22 | 0 |
| D | 0 | 22 | 0 |
| Mode M0 | |||
|---|---|---|---|
| Quadrant | BADHDUFLAG | Total packets | Discarded packets |
| A | 0 | 3055 | 0 |
| B | 0 | 2077 | 0 |
| C | 0 | 2064 | 0 |
| D | 0 | 2733 | 0 |
| Quadrant | Total seconds | Saturated seconds | Saturation percentage |
|---|---|---|---|
| A | 1020 | 2 | 0.196078% |
| B | 1021 | 0 | 0.000000% |
| C | 1021 | 0 | 0.000000% |
| D | 1021 | 31 | 3.036239% |
Noise dominated data is calculated using 1-second bins in cleaned event files. If a bin has >2000 counts, and if more than 50% of those come from <1% of pixels, then it is considered to be noise-dominated and hence unusable.
| Quadrant | # 1 sec bins | Bins with >0 counts | Bins with >2000 counts | High rate bins dominated by noise | Noise dominated (total time) | Noise dominated (detector-on time) | Marked lightcurve |
|---|---|---|---|---|---|---|---|
| A | 1020 | 1020 | 2 | 2 | 0.20% | 0.20% | 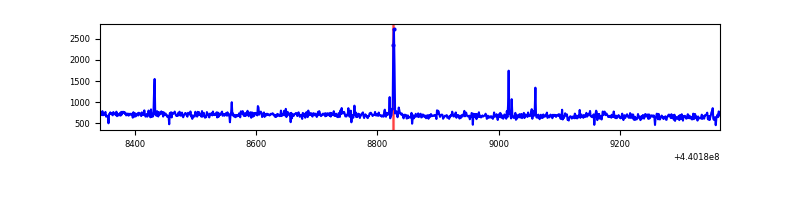 |
| B | 1021 | 1021 | 0 | 0 | 0.00% | 0.00% | 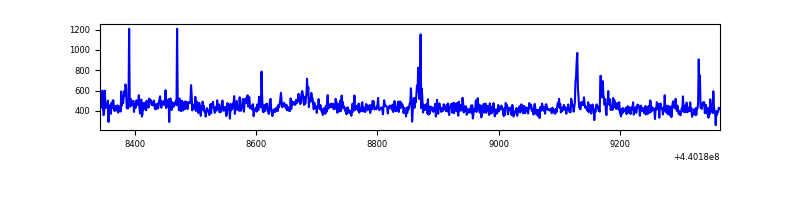 |
| C | 1021 | 1021 | 0 | 0 | 0.00% | 0.00% | 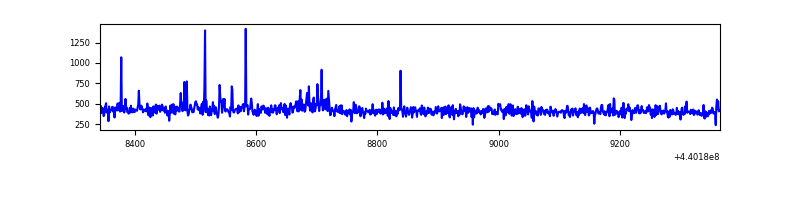 |
| D | 1021 | 1021 | 43 | 43 | 4.21% | 4.21% | 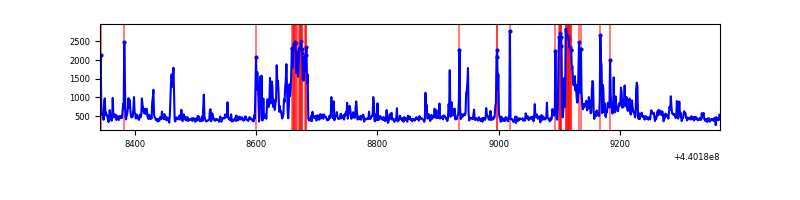 |
Top three noisy pixels from each quadrant. If the there are fewer than three noisy pixels in the level2.evt file, extra rows are filled as -1
| Pixel properties | Quadrant properties | ||||||
|---|---|---|---|---|---|---|---|
| Quadrant | DetID | PixID | Counts | Sigma | Mean | Median | Sigma |
| A | 10 | 83 | 276086 | 11384.17 | 106 | 104 | 24.2 |
| A | 0 | 243 | 11981 | 489.92 | 106 | 104 | 24.2 |
| A | 13 | 248 | 5713 | 231.37 | 106 | 104 | 24.2 |
| B | 5 | 235 | 7463 | 311.77 | 107 | 104 | 23.6 |
| B | 0 | 190 | 6065 | 252.54 | 107 | 104 | 23.6 |
| B | 0 | 219 | 4344 | 179.63 | 107 | 104 | 23.6 |
| C | 14 | 254 | 14649 | 541.36 | 105 | 106 | 26.9 |
| C | 12 | 250 | 2629 | 93.92 | 105 | 106 | 26.9 |
| C | 3 | 233 | 2374 | 84.43 | 105 | 106 | 26.9 |
| D | 4 | 234 | 71832 | 2574.01 | 103 | 99 | 27.9 |
| D | 12 | 233 | 68198 | 2443.61 | 103 | 99 | 27.9 |
| D | 2 | 249 | 44409 | 1589.99 | 103 | 99 | 27.9 |
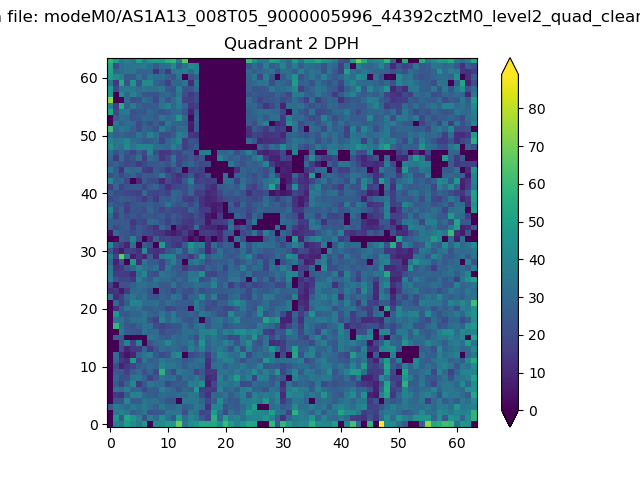
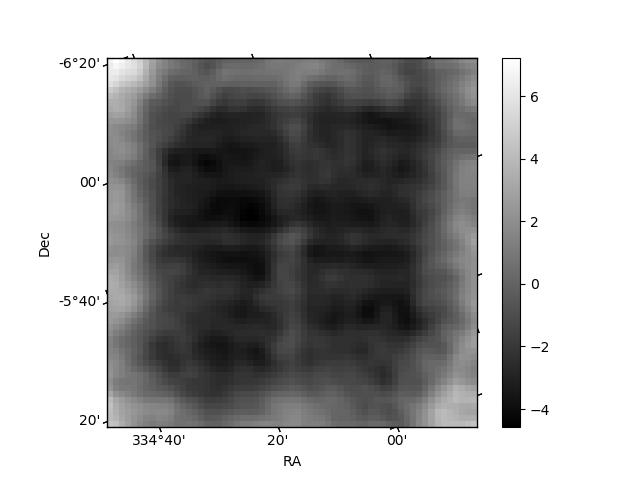
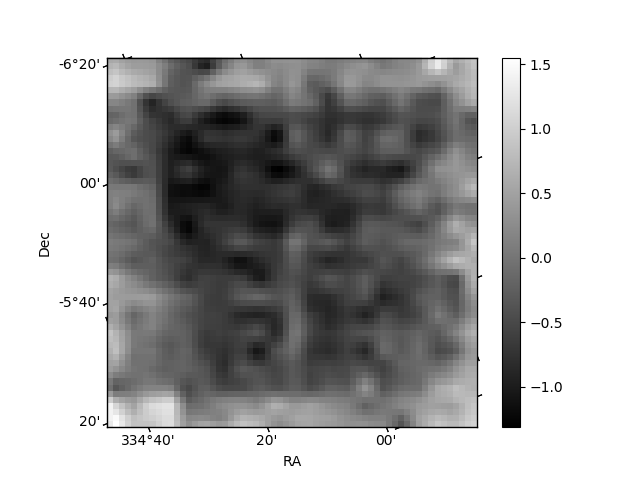
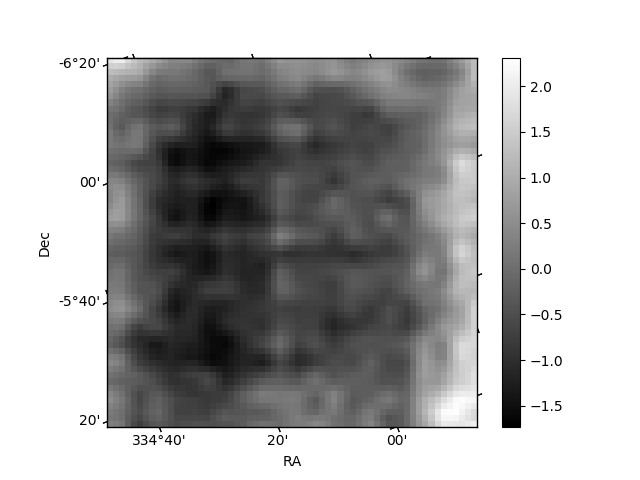
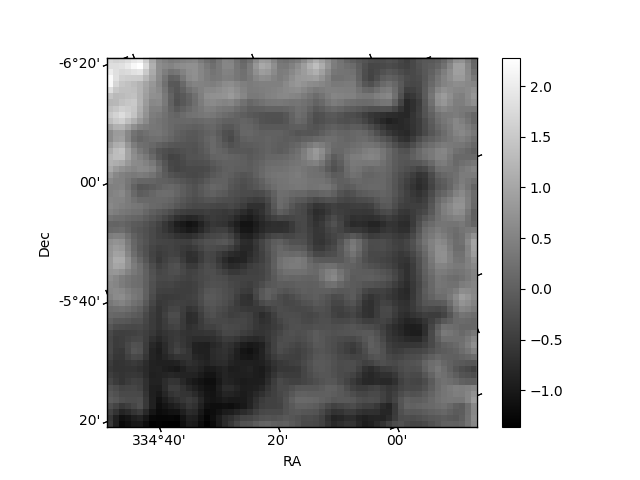
Histogram calculated using DETX and DETY for each event in the final _common_clean file
| Quadrant A | 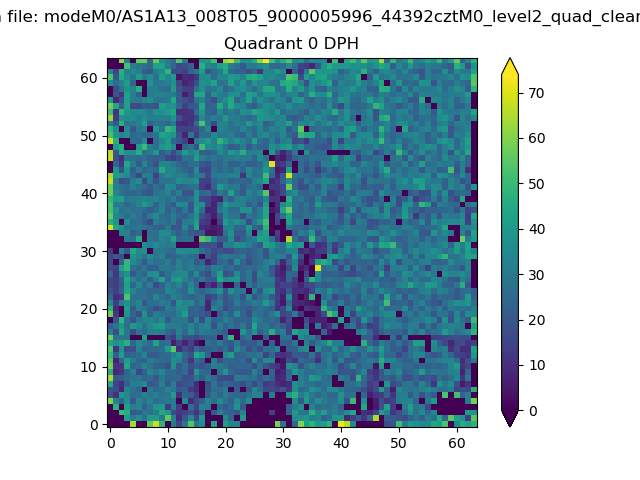 |
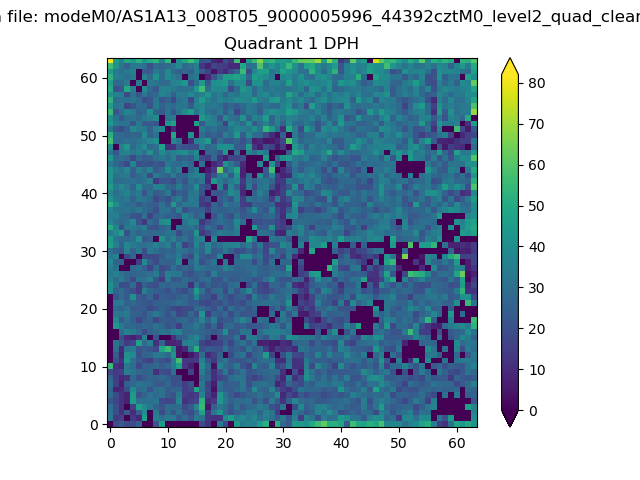 |
Quadrant B |
|---|---|---|---|
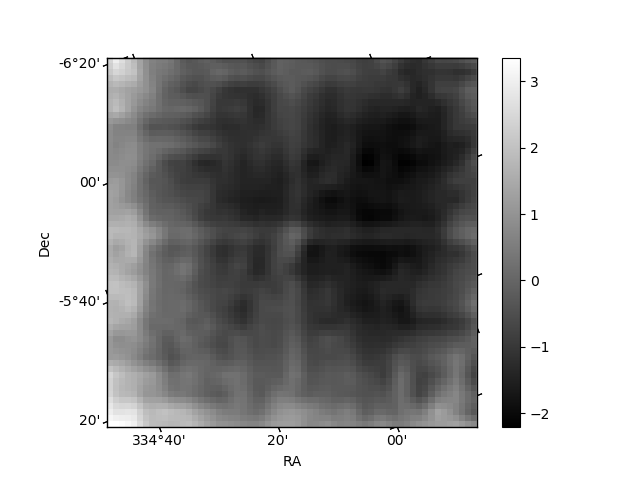
| Quadrant D | 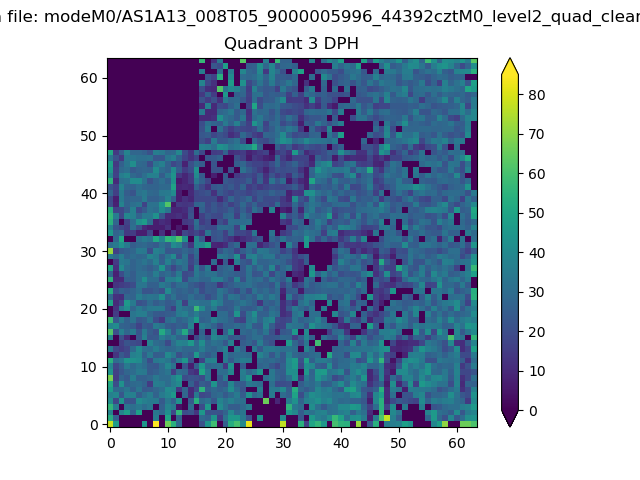 |
 |
Quadrant C |
| Plot type | Count rate plots | Images |
|---|---|---|
| Comparison with Poisson distribution Blue bars denote a histogram of data divided into 1 sec bins. Red curve is a Poisson curve with rate = median count rate of data. |
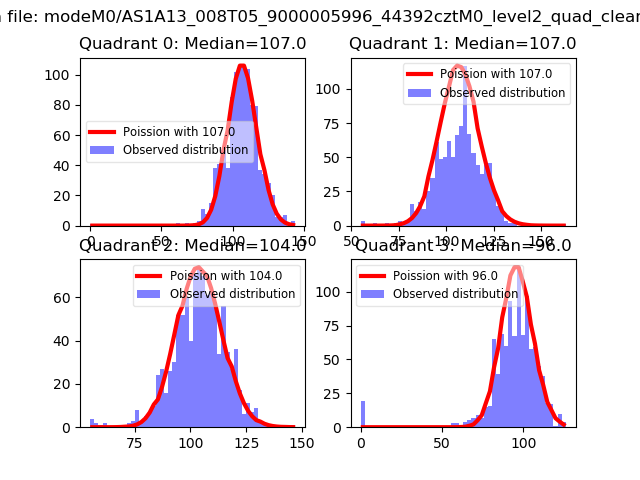 |
 |
| Quadrant-wise count rates Data is divided into 100 sec bins |
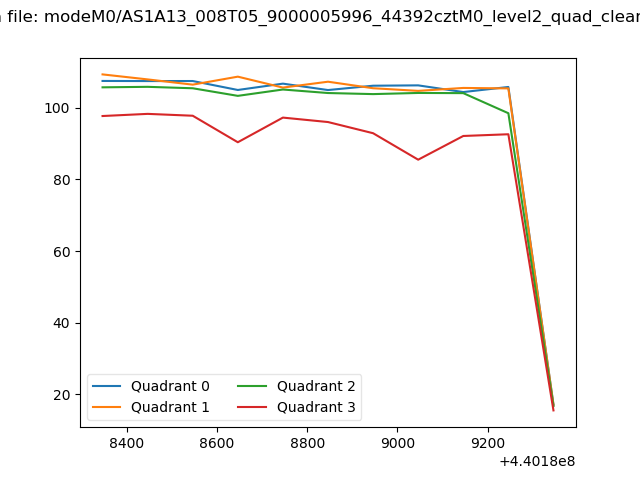 |
|
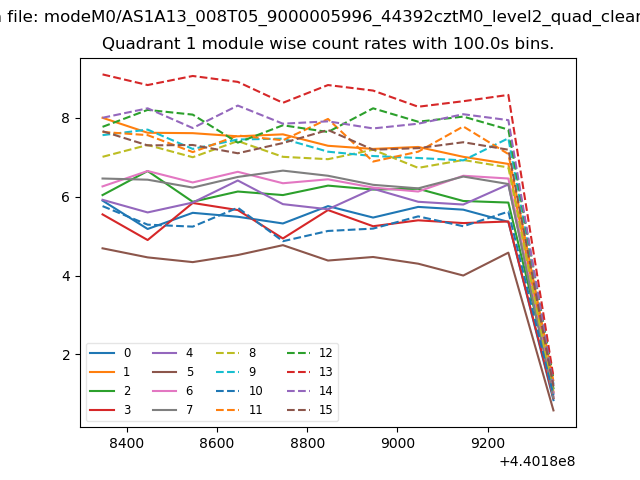
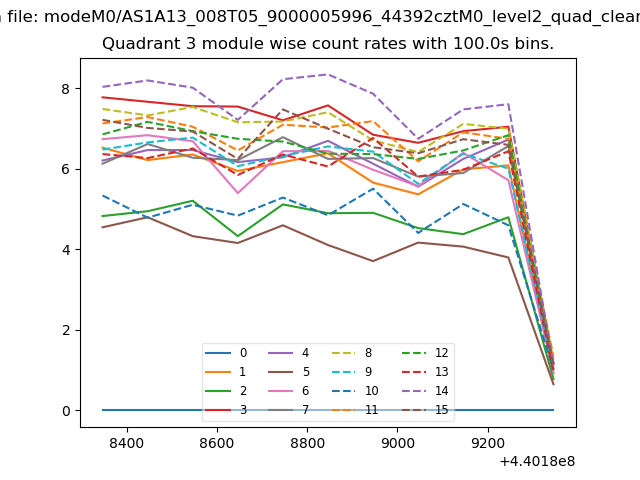
| Module-wise count rates for Quadrant A Data is divided into 100 sec bins |
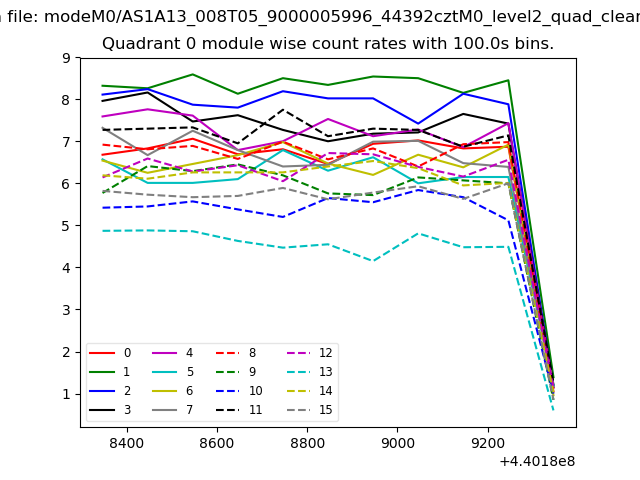 |
 |
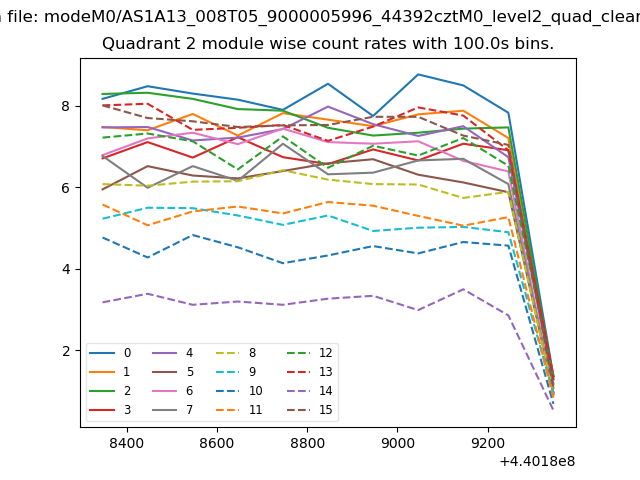
| Module-wise count rates for Quadrant B Data is divided into 100 sec bins |
 |
 |
| Module-wise count rates for Quadrant C Data is divided into 100 sec bins |
 |
 |
| Module-wise count rates for Quadrant D Data is divided into 100 sec bins |
 |
 |
| Parameter | Plot |
|---|---|
| CZT HV Monitor | 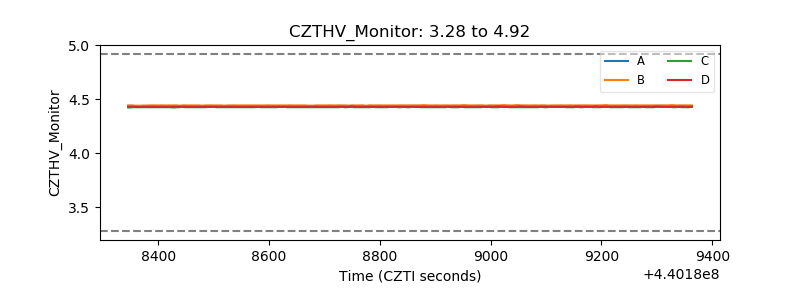 |
| D_VDD | 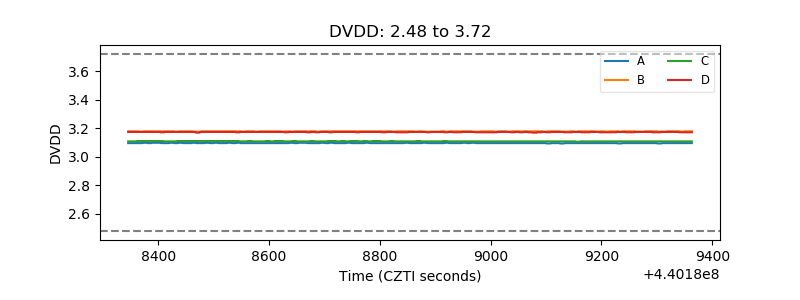 |
| Temperature 1 | 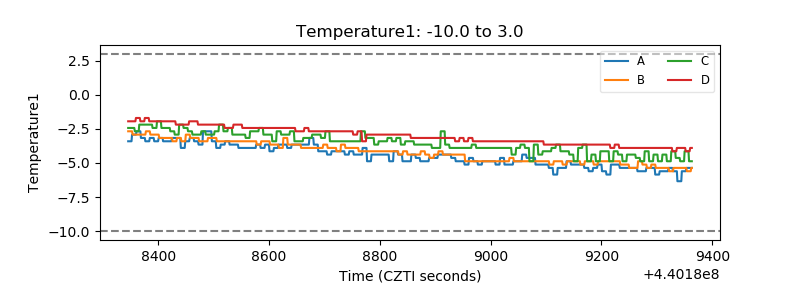 |
| Veto HV Monitor | 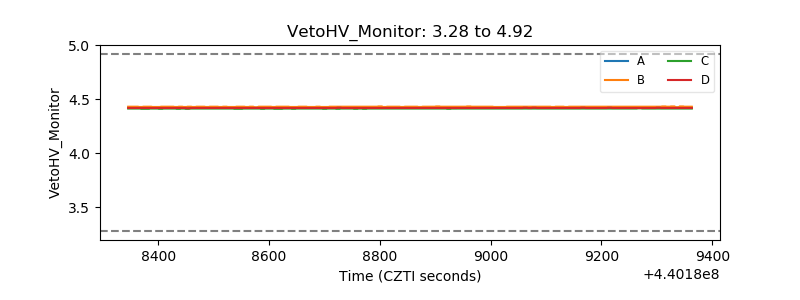 |
| Veto LLD | 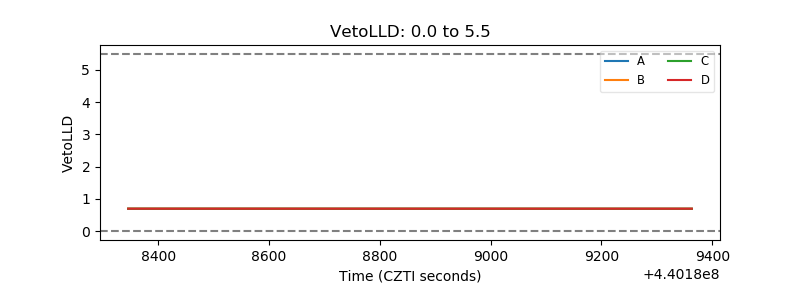 |
| Alpha Counter | 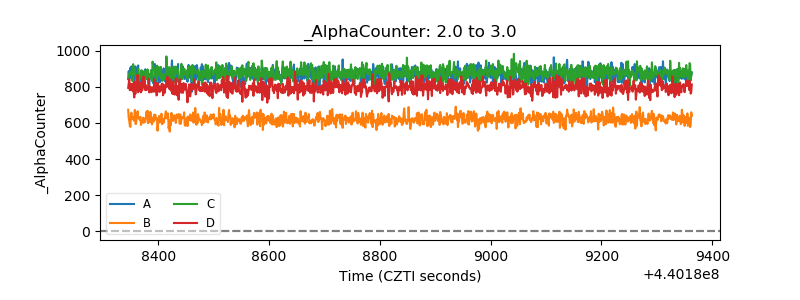 |
| _CPM_Rate | 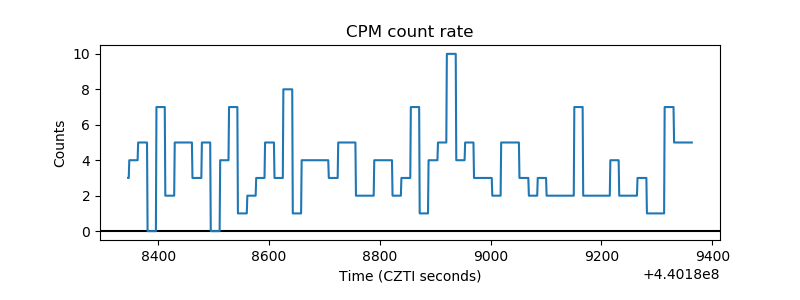 |
| CZT Counter | 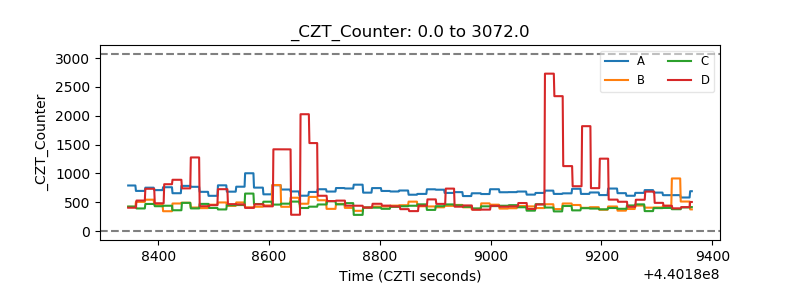 |
| +2.5 Volts monitor | 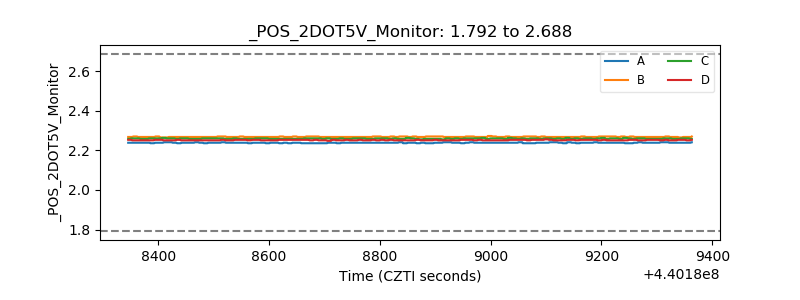 |
| +5 Volts monitor | 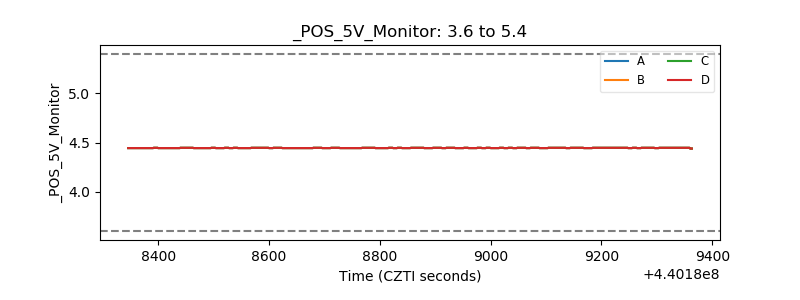 |
| _ROLL_ROT | 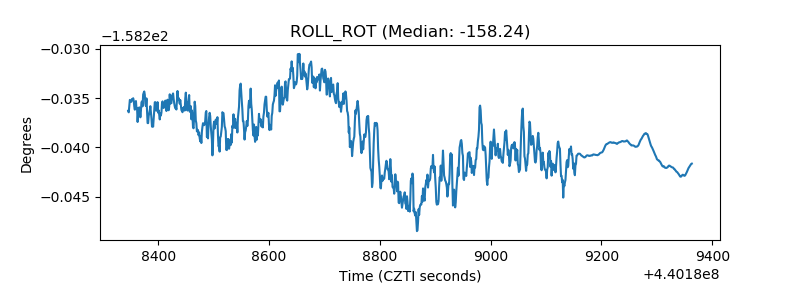 |
| _Roll_DEC | 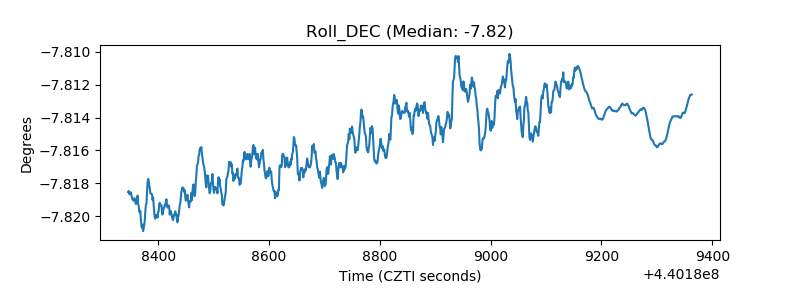 |
| _Roll_RA | 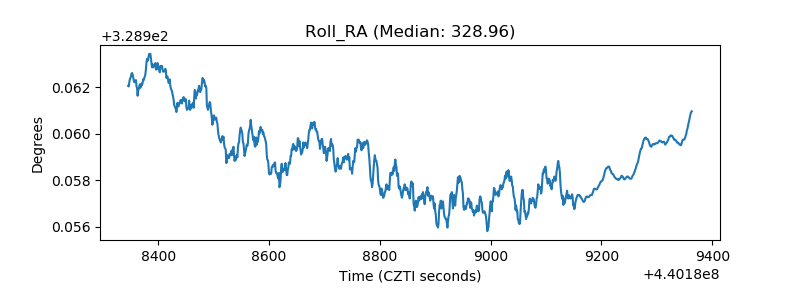 |
| Veto Counter | 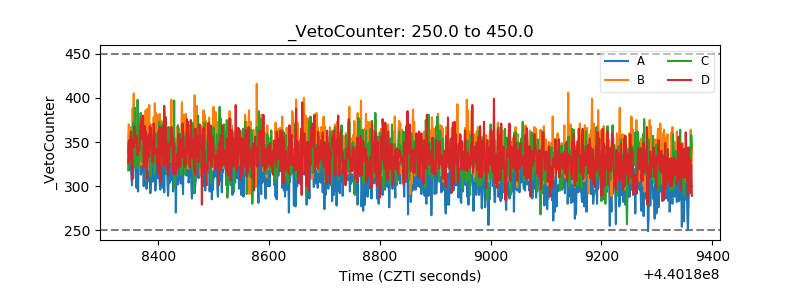 |