| Param | Original file | Final file |
|---|---|---|
| Filename | modeM0/AS1A13_008T08_9000005998_44395cztM0_level2.fits | modeM0/AS1A13_008T08_9000005998_44395cztM0_level2_quad_clean.evt |
| Size (bytes) | 902,571,840 | 203,647,680 |
| Size | 860.8 MB | 194.2 MB |
| Events in quadrant A | 9,237,264 | 1,371,907 |
| Events in quadrant B | 7,141,179 | 1,399,129 |
| Events in quadrant C | 6,378,679 | 1,348,044 |
| Events in quadrant D | 9,628,299 | 1,132,513 |
| Mode SS | |||
|---|---|---|---|
| Quadrant | BADHDUFLAG | Total packets | Discarded packets |
| A | 0 | 270 | 0 |
| B | 0 | 270 | 0 |
| C | 0 | 270 | 0 |
| D | 0 | 270 | 0 |
| Mode M0 | |||
|---|---|---|---|
| Quadrant | BADHDUFLAG | Total packets | Discarded packets |
| A | 0 | 38644 | 3 |
| B | 0 | 29975 | 3 |
| C | 0 | 28551 | 3 |
| D | 0 | 38066 | 3 |
| Mode M9 | |||
|---|---|---|---|
| Quadrant | BADHDUFLAG | Total packets | Discarded packets |
| A | 0 | 13 | 0 |
| B | 0 | 13 | 0 |
| C | 0 | 13 | 0 |
| D | 0 | 13 | 0 |
| Quadrant | Total seconds | Saturated seconds | Saturation percentage |
|---|---|---|---|
| A | 13229 | 336 | 2.539875% |
| B | 13229 | 390 | 2.948069% |
| C | 13230 | 270 | 2.040816% |
| D | 13230 | 1171 | 8.851096% |
Noise dominated data is calculated using 1-second bins in cleaned event files. If a bin has >2000 counts, and if more than 50% of those come from <1% of pixels, then it is considered to be noise-dominated and hence unusable.
| Quadrant | # 1 sec bins | Bins with >0 counts | Bins with >2000 counts | High rate bins dominated by noise | Noise dominated (total time) | Noise dominated (detector-on time) | Marked lightcurve |
|---|---|---|---|---|---|---|---|
| A | 14464 | 13229 | 28 | 28 | 0.19% | 0.21% | 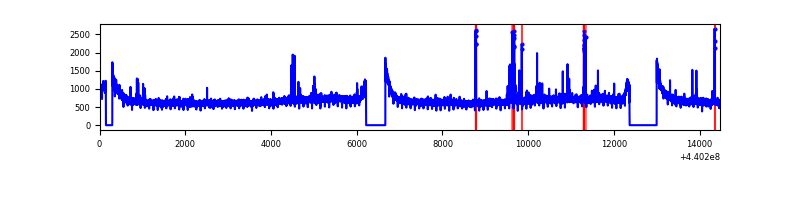 |
| B | 14464 | 13229 | 69 | 69 | 0.48% | 0.52% | 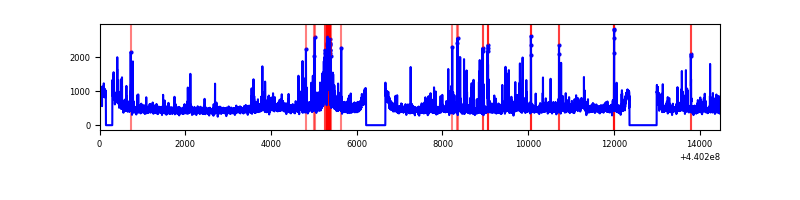 |
| C | 14465 | 13230 | 81 | 81 | 0.56% | 0.61% | 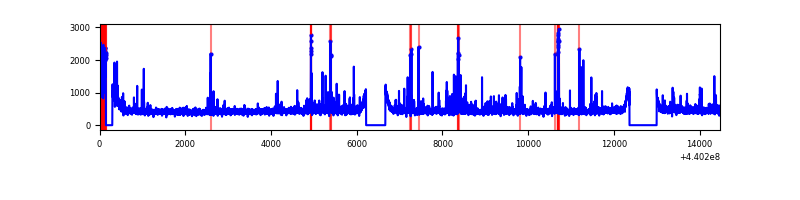 |
| D | 14465 | 13230 | 954 | 954 | 6.60% | 7.21% | 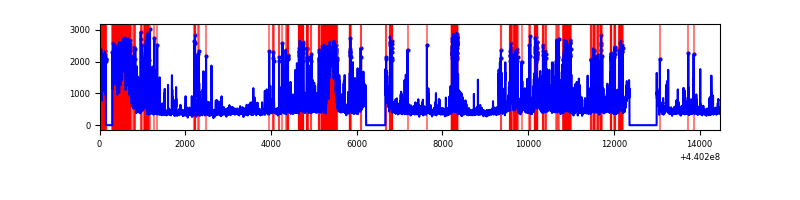 |
Top three noisy pixels from each quadrant. If the there are fewer than three noisy pixels in the level2.evt file, extra rows are filled as -1
| Pixel properties | Quadrant properties | ||||||
|---|---|---|---|---|---|---|---|
| Quadrant | DetID | PixID | Counts | Sigma | Mean | Median | Sigma |
| A | 10 | 83 | 3171321 | 10134.08 | 1508 | 1472 | 312.8 |
| A | 13 | 248 | 76431 | 239.65 | 1508 | 1472 | 312.8 |
| A | 7 | 3 | 59666 | 186.05 | 1508 | 1472 | 312.8 |
| B | 0 | 219 | 293283 | 970.95 | 1509 | 1460 | 300.6 |
| B | 4 | 173 | 236873 | 783.26 | 1509 | 1460 | 300.6 |
| B | 5 | 255 | 193713 | 639.66 | 1509 | 1460 | 300.6 |
| C | 14 | 254 | 349083 | 999.32 | 1475 | 1481 | 347.8 |
| C | 15 | 158 | 168909 | 481.34 | 1475 | 1481 | 347.8 |
| C | 3 | 233 | 50580 | 141.16 | 1475 | 1481 | 347.8 |
| D | 2 | 249 | 1281959 | 3614.15 | 1419 | 1375 | 354.3 |
| D | 4 | 221 | 693975 | 1954.7 | 1419 | 1375 | 354.3 |
| D | 8 | 240 | 581755 | 1637.99 | 1419 | 1375 | 354.3 |
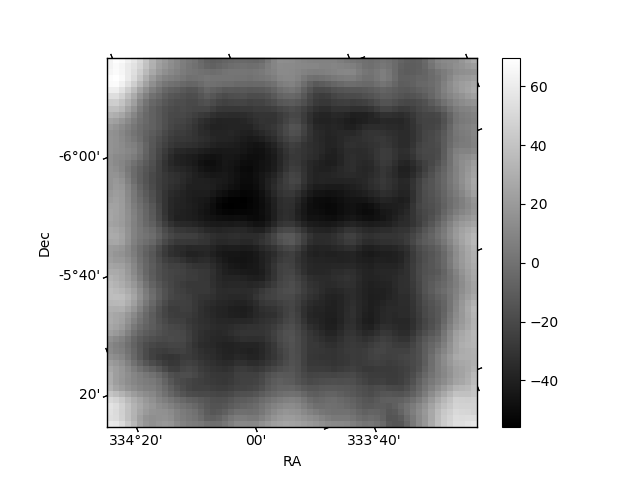
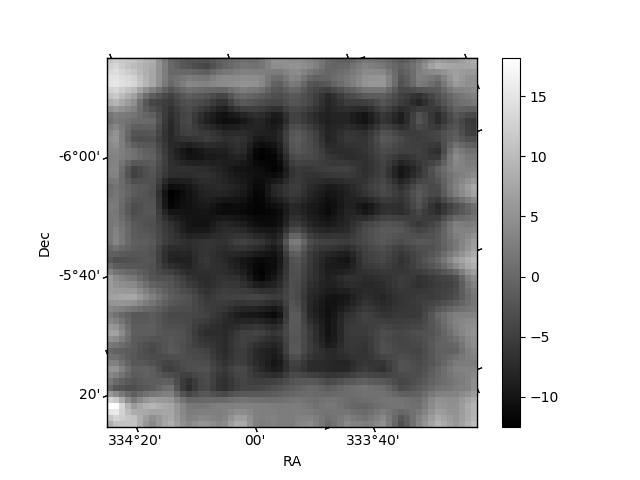
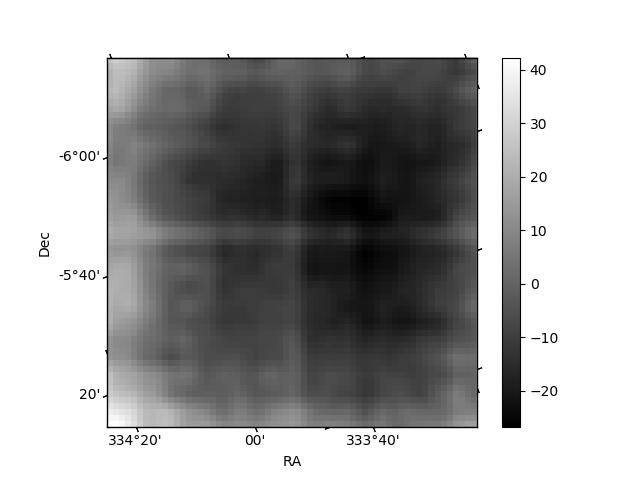
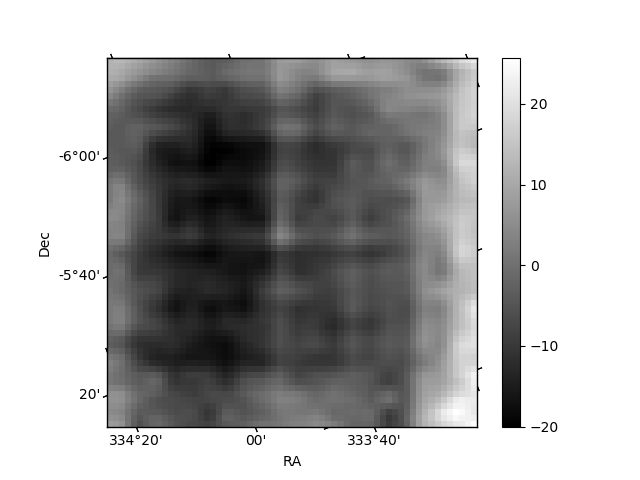
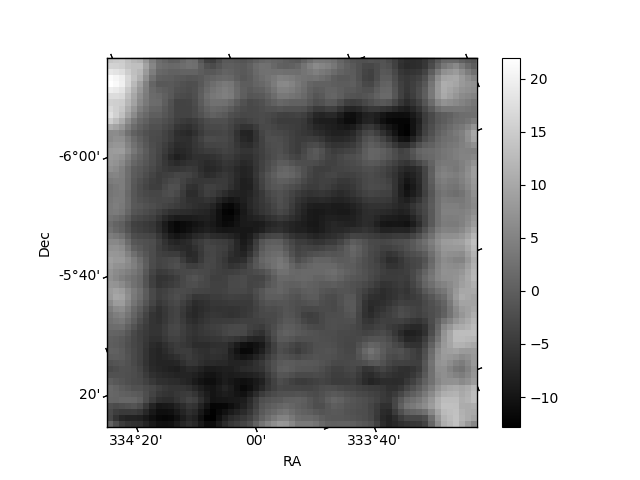
Histogram calculated using DETX and DETY for each event in the final _common_clean file
| Quadrant A | 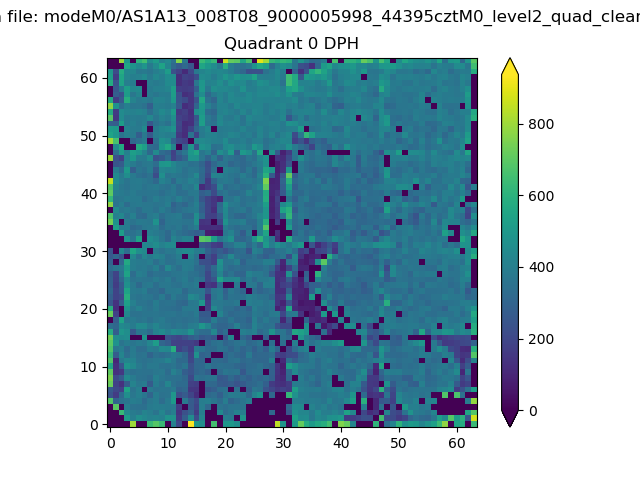 |
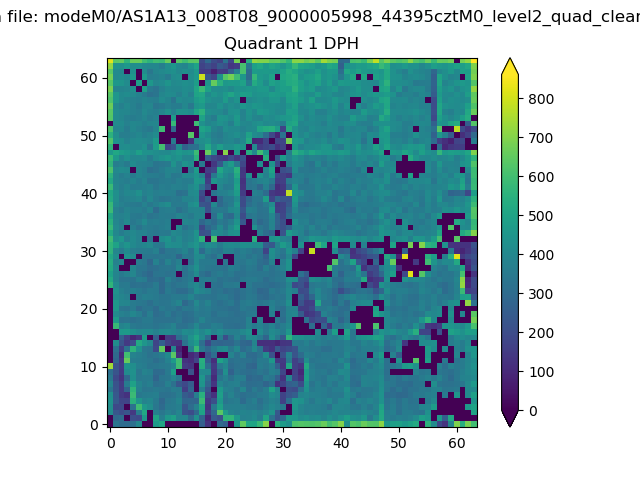 |
Quadrant B |
|---|---|---|---|
| Quadrant D | 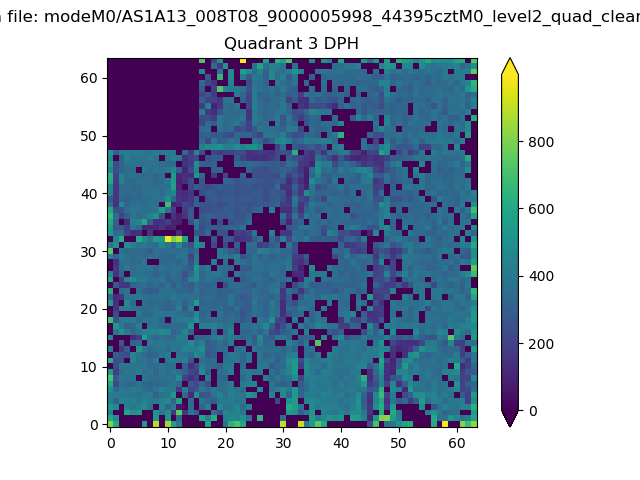 |
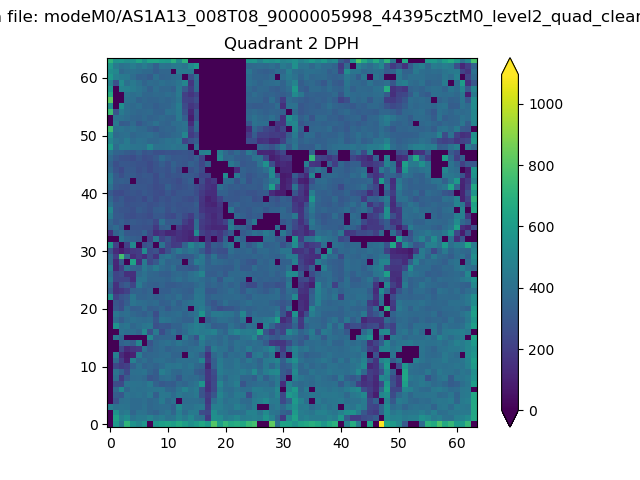 |
Quadrant C |
| Plot type | Count rate plots | Images |
|---|---|---|
| Comparison with Poisson distribution Blue bars denote a histogram of data divided into 1 sec bins. Red curve is a Poisson curve with rate = median count rate of data. |
 |
 |
| Quadrant-wise count rates Data is divided into 100 sec bins |
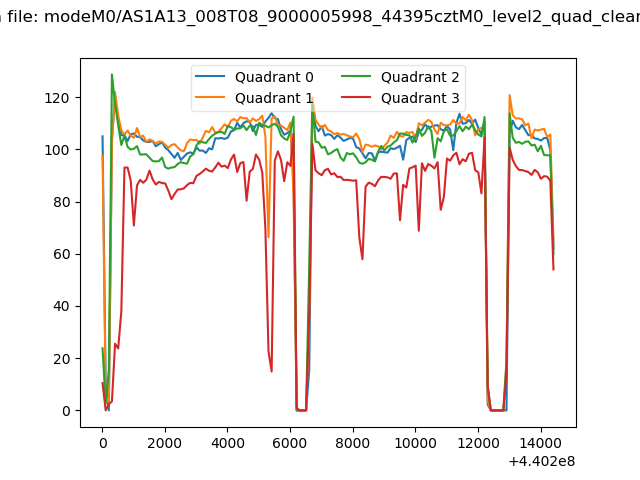 |
|
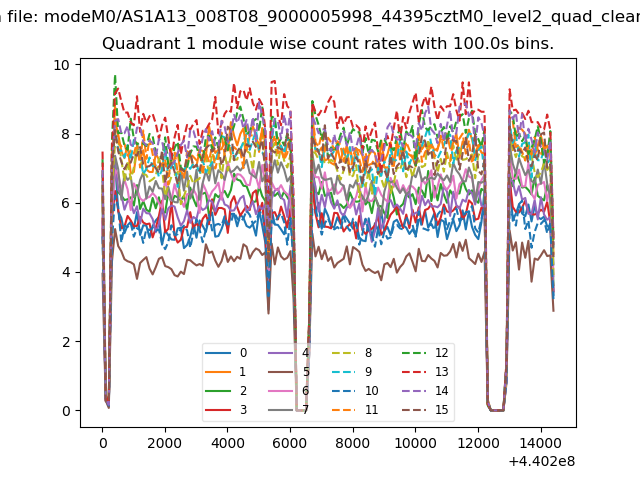
| Module-wise count rates for Quadrant A Data is divided into 100 sec bins |
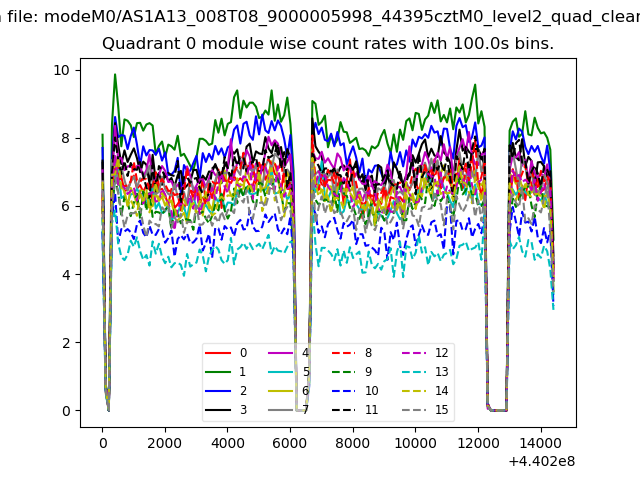 |
 |
| Module-wise count rates for Quadrant B Data is divided into 100 sec bins |
 |
 |
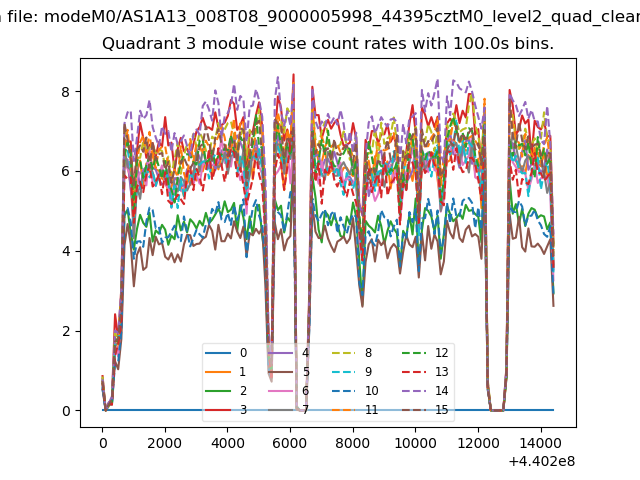
| Module-wise count rates for Quadrant C Data is divided into 100 sec bins |
 |
 |
| Module-wise count rates for Quadrant D Data is divided into 100 sec bins |
 |
 |
| Parameter | Plot |
|---|---|
| CZT HV Monitor |  |
| D_VDD | 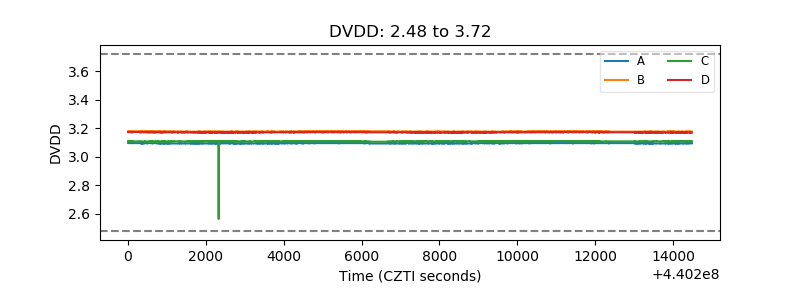 |
| Temperature 1 | 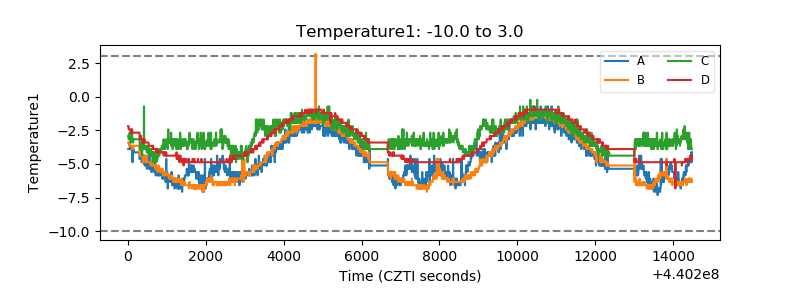 |
| Veto HV Monitor | 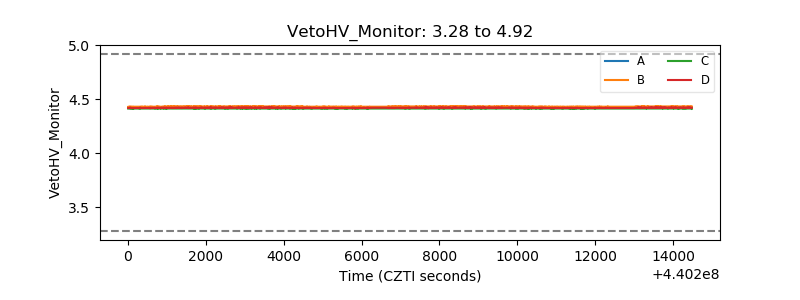 |
| Veto LLD | 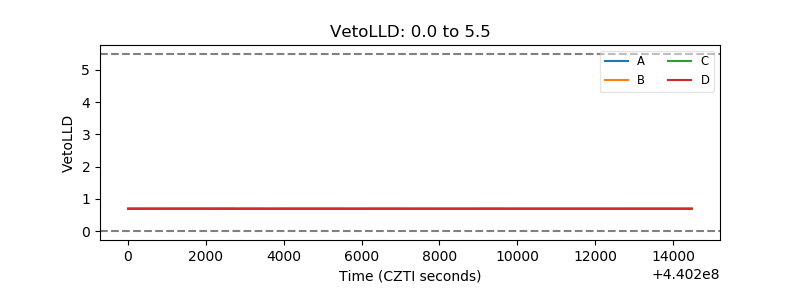 |
| Alpha Counter | 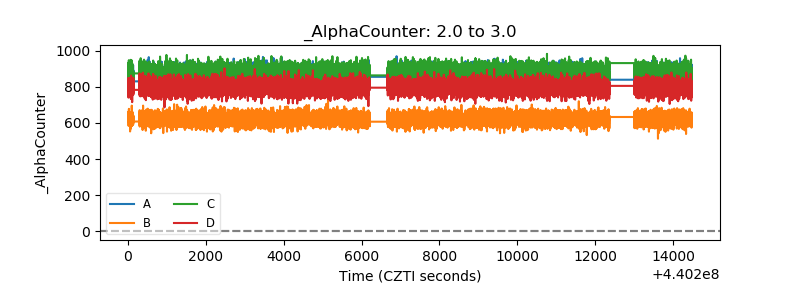 |
| _CPM_Rate | 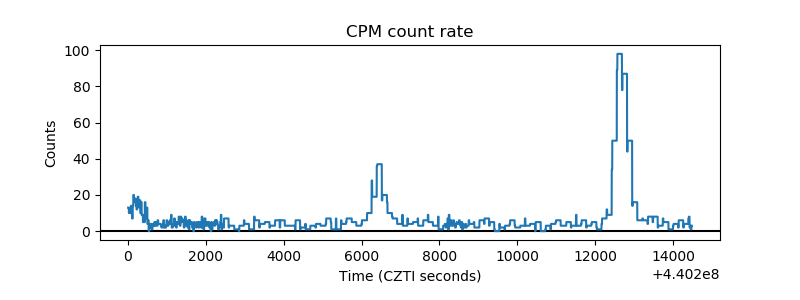 |
| CZT Counter | 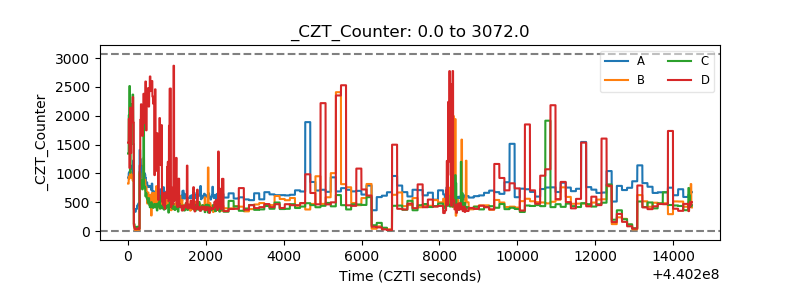 |
| +2.5 Volts monitor | 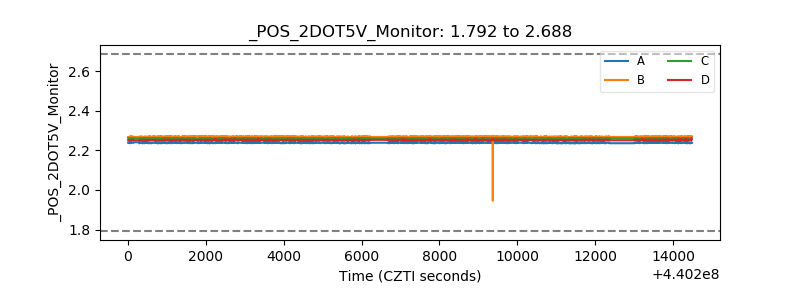 |
| +5 Volts monitor | 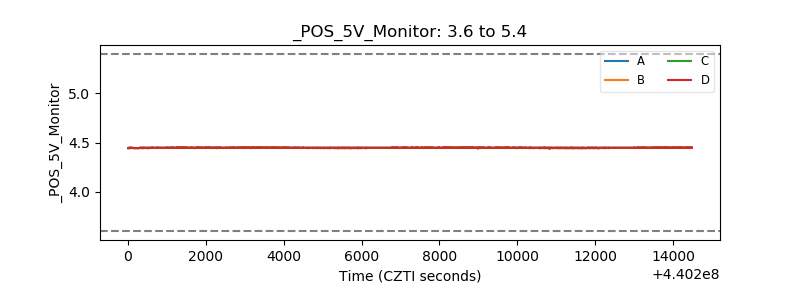 |
| _ROLL_ROT | 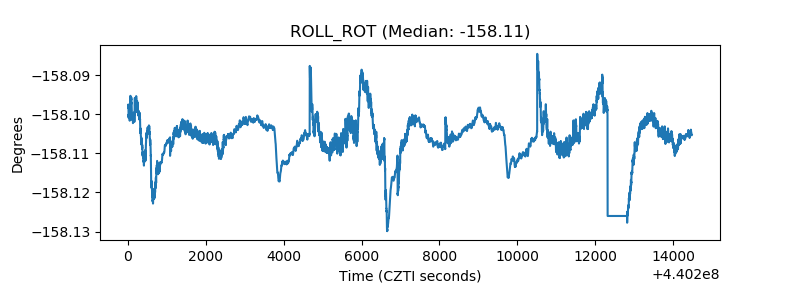 |
| _Roll_DEC | 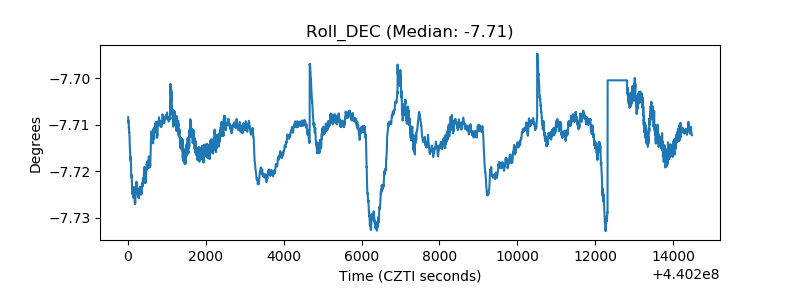 |
| _Roll_RA | 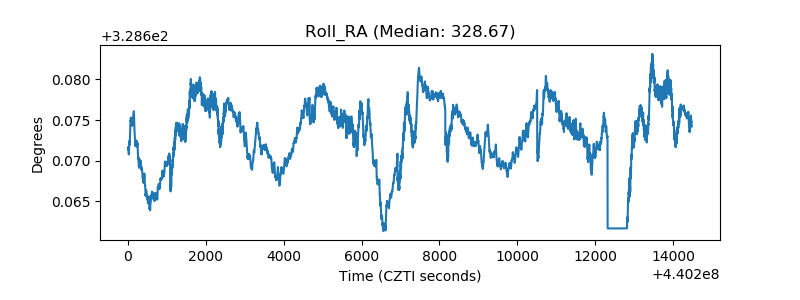 |
| Veto Counter | 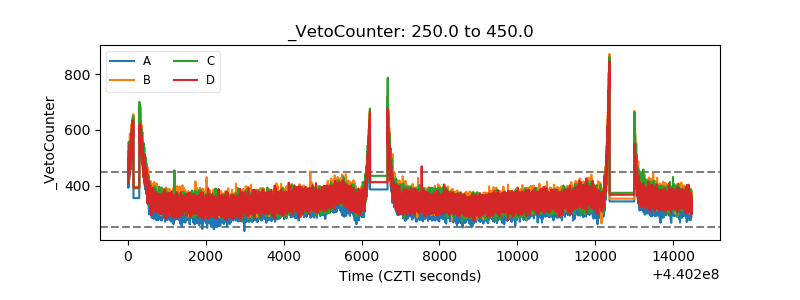 |