| Param | Original file | Final file |
|---|---|---|
| Filename | modeM0/AS1A13_008T08_9000005998_44396cztM0_level2.fits | modeM0/AS1A13_008T08_9000005998_44396cztM0_level2_quad_clean.evt |
| Size (bytes) | 461,442,240 | 113,800,320 |
| Size | 440.1 MB | 108.5 MB |
| Events in quadrant A | 5,168,378 | 748,115 |
| Events in quadrant B | 3,664,019 | 776,475 |
| Events in quadrant C | 3,326,634 | 746,454 |
| Events in quadrant D | 4,364,289 | 674,111 |
| Mode SS | |||
|---|---|---|---|
| Quadrant | BADHDUFLAG | Total packets | Discarded packets |
| A | 0 | 150 | 0 |
| B | 0 | 150 | 0 |
| C | 0 | 150 | 0 |
| D | 0 | 150 | 0 |
| Mode M0 | |||
|---|---|---|---|
| Quadrant | BADHDUFLAG | Total packets | Discarded packets |
| A | 0 | 21673 | 2 |
| B | 0 | 15529 | 2 |
| C | 0 | 15049 | 2 |
| D | 0 | 17920 | 2 |
| Mode M9 | |||
|---|---|---|---|
| Quadrant | BADHDUFLAG | Total packets | Discarded packets |
| A | 0 | 13 | 0 |
| B | 0 | 13 | 0 |
| C | 0 | 13 | 0 |
| D | 0 | 13 | 0 |
| Quadrant | Total seconds | Saturated seconds | Saturation percentage |
|---|---|---|---|
| A | 7176 | 213 | 2.968227% |
| B | 7176 | 183 | 2.550167% |
| C | 7177 | 111 | 1.546607% |
| D | 7177 | 254 | 3.539083% |
Noise dominated data is calculated using 1-second bins in cleaned event files. If a bin has >2000 counts, and if more than 50% of those come from <1% of pixels, then it is considered to be noise-dominated and hence unusable.
| Quadrant | # 1 sec bins | Bins with >0 counts | Bins with >2000 counts | High rate bins dominated by noise | Noise dominated (total time) | Noise dominated (detector-on time) | Marked lightcurve |
|---|---|---|---|---|---|---|---|
| A | 8600 | 7175 | 12 | 12 | 0.14% | 0.17% | 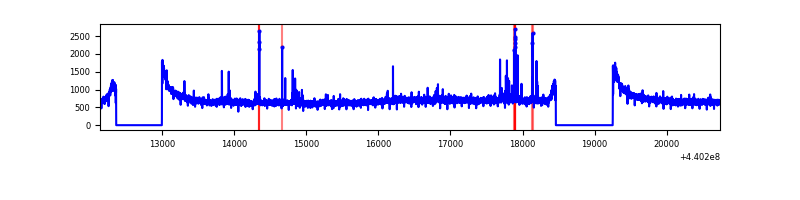 |
| B | 8600 | 7175 | 19 | 19 | 0.22% | 0.26% | 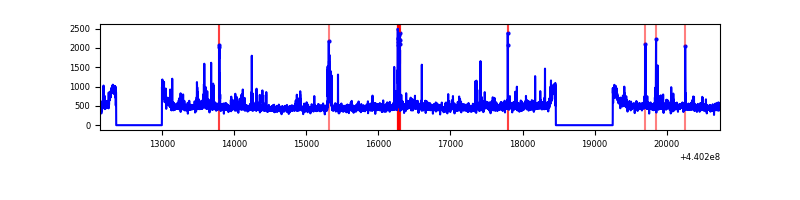 |
| C | 8601 | 7176 | 4 | 4 | 0.05% | 0.06% | 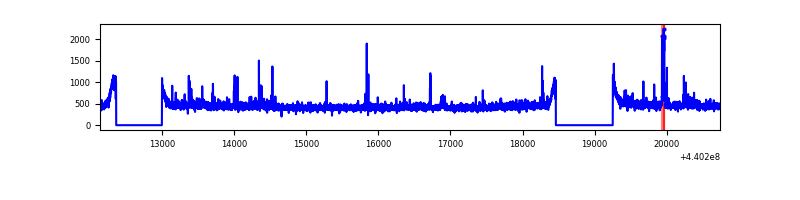 |
| D | 8601 | 7176 | 162 | 162 | 1.88% | 2.26% | 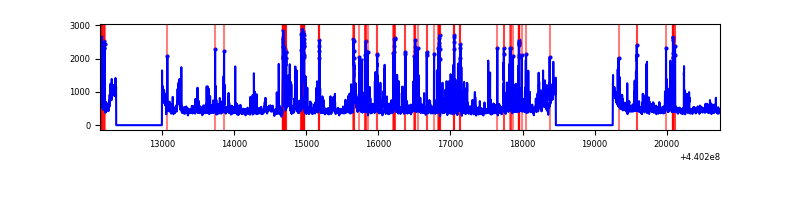 |
Top three noisy pixels from each quadrant. If the there are fewer than three noisy pixels in the level2.evt file, extra rows are filled as -1
| Pixel properties | Quadrant properties | ||||||
|---|---|---|---|---|---|---|---|
| Quadrant | DetID | PixID | Counts | Sigma | Mean | Median | Sigma |
| A | 10 | 83 | 1849400 | 10653.66 | 825 | 808 | 173.5 |
| A | 13 | 248 | 50942 | 288.93 | 825 | 808 | 173.5 |
| A | 7 | 16 | 48975 | 277.59 | 825 | 808 | 173.5 |
| B | 0 | 168 | 75430 | 452.79 | 828 | 804 | 164.8 |
| B | 4 | 173 | 74566 | 447.54 | 828 | 804 | 164.8 |
| B | 5 | 255 | 65194 | 390.68 | 828 | 804 | 164.8 |
| C | 14 | 254 | 65638 | 332.87 | 818 | 823 | 194.7 |
| C | 1 | 3 | 58582 | 296.63 | 818 | 823 | 194.7 |
| C | 3 | 233 | 11464 | 54.65 | 818 | 823 | 194.7 |
| D | 2 | 249 | 286568 | 1393.95 | 809 | 784 | 205.0 |
| D | 13 | 249 | 193701 | 940.98 | 809 | 784 | 205.0 |
| D | 13 | 138 | 134630 | 652.85 | 809 | 784 | 205.0 |
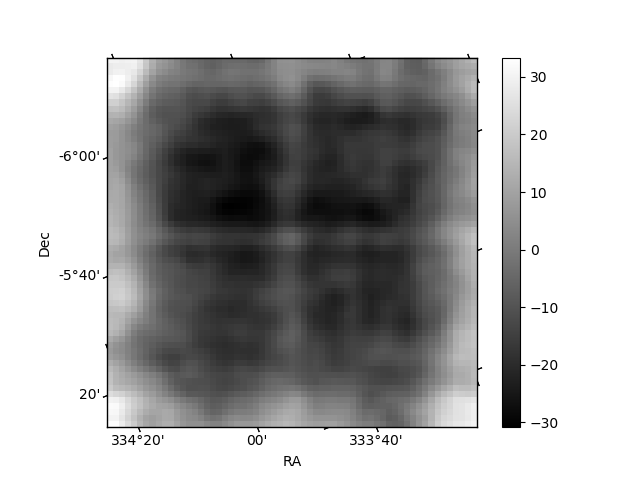
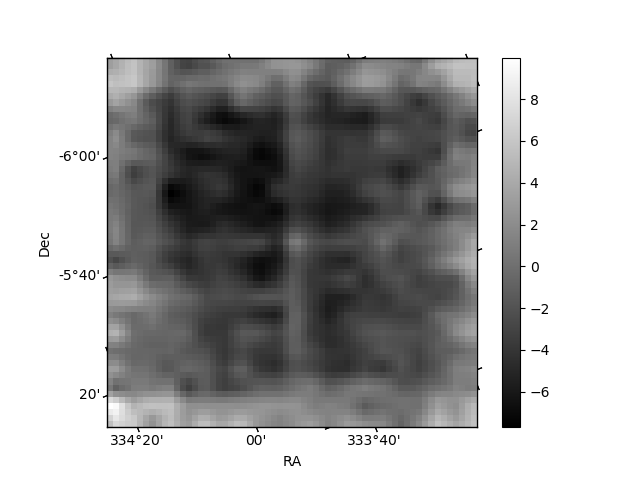
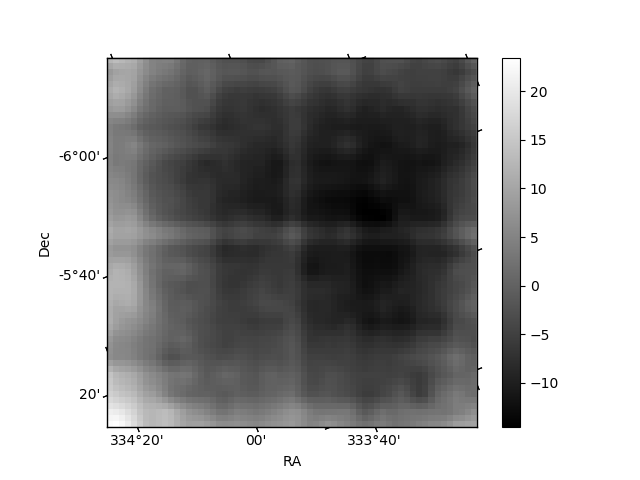
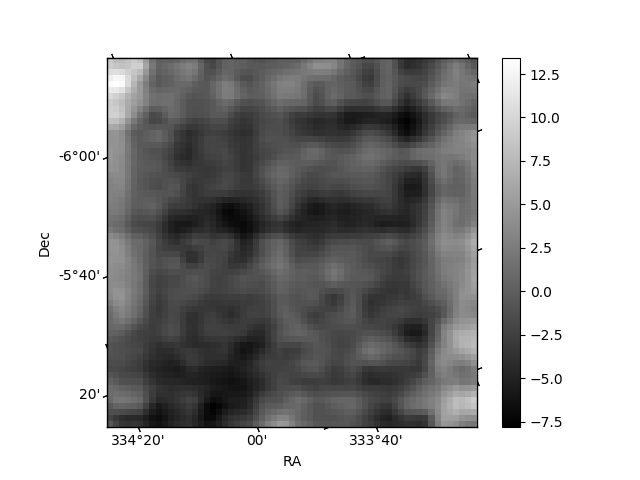
Histogram calculated using DETX and DETY for each event in the final _common_clean file
| Quadrant A | 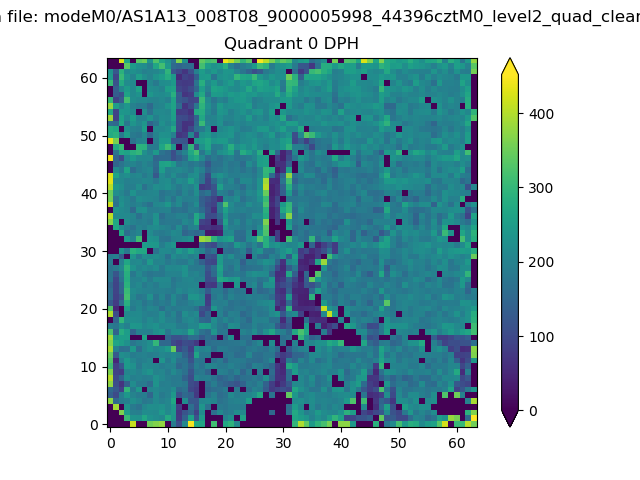 |
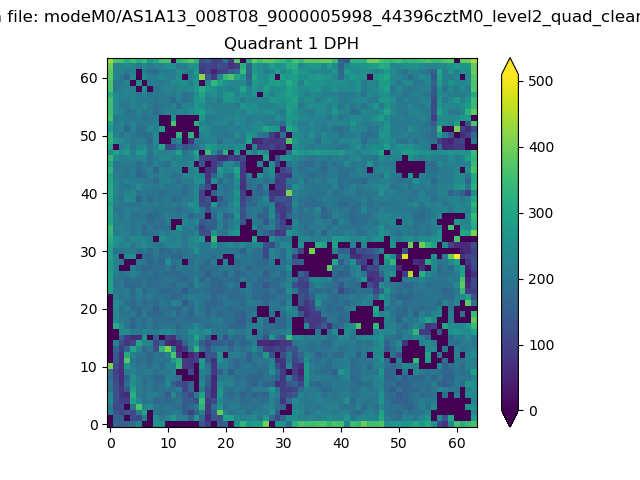 |
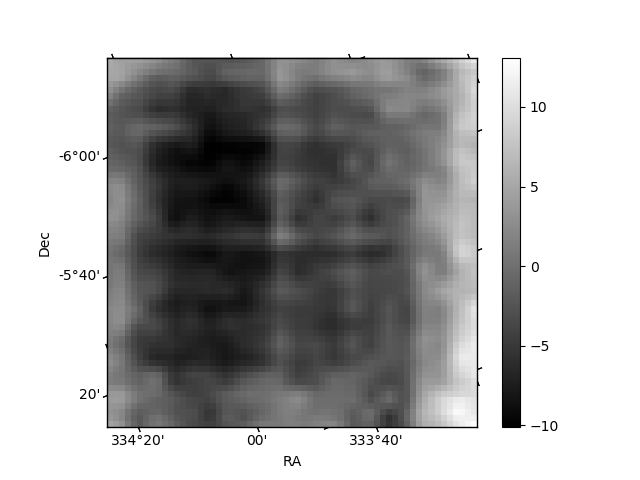
Quadrant B |
|---|---|---|---|
| Quadrant D | 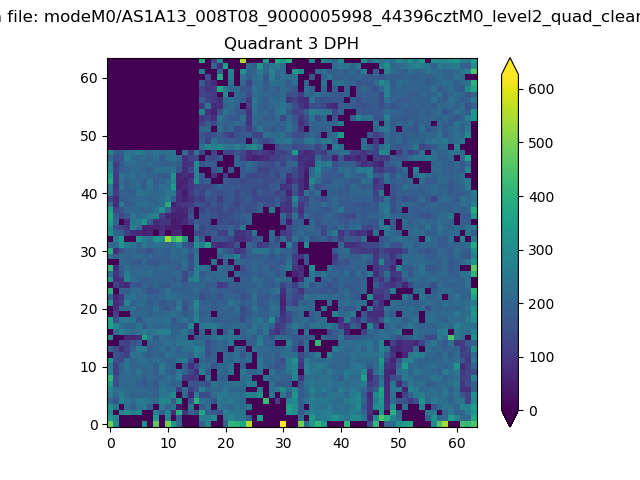 |
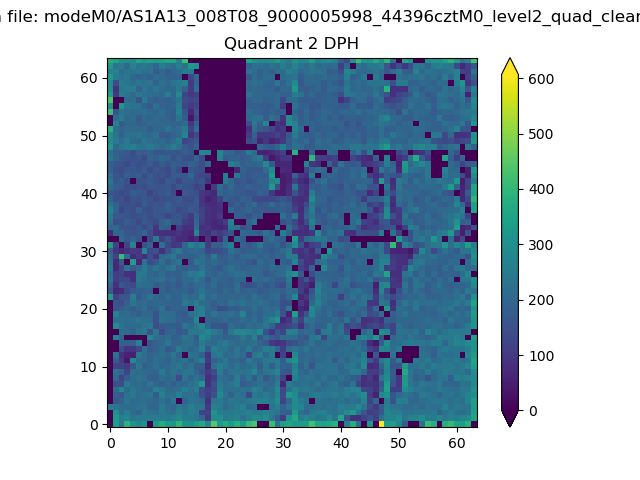 |
Quadrant C |
| Plot type | Count rate plots | Images |
|---|---|---|
| Comparison with Poisson distribution Blue bars denote a histogram of data divided into 1 sec bins. Red curve is a Poisson curve with rate = median count rate of data. |
 |
 |
| Quadrant-wise count rates Data is divided into 100 sec bins |
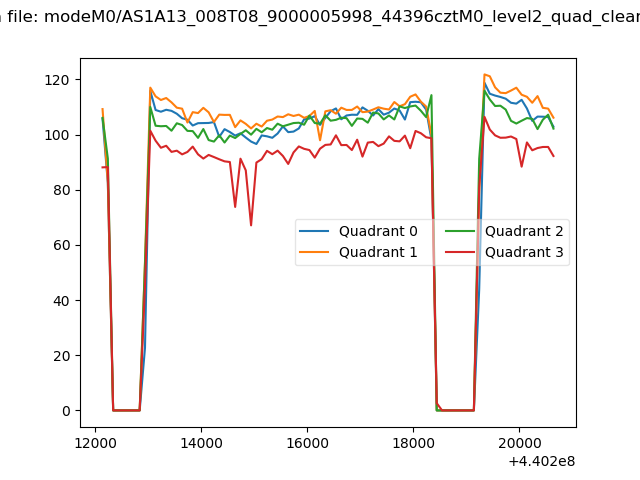 |
|
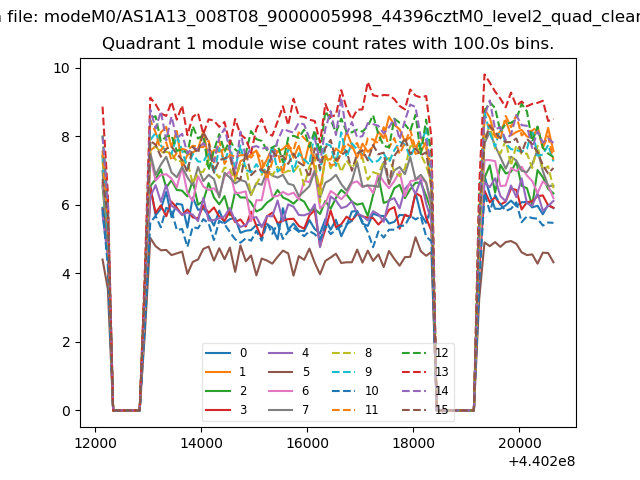
| Module-wise count rates for Quadrant A Data is divided into 100 sec bins |
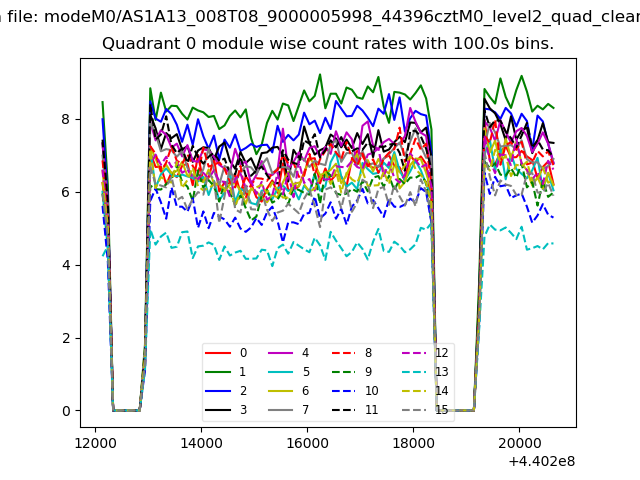 |
 |
| Module-wise count rates for Quadrant B Data is divided into 100 sec bins |
 |
 |
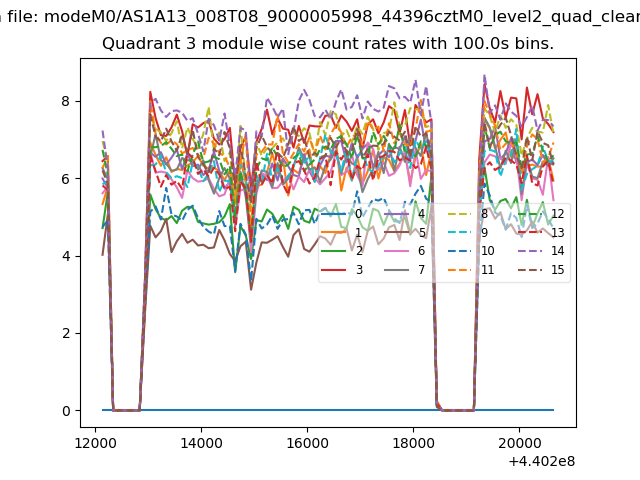
| Module-wise count rates for Quadrant C Data is divided into 100 sec bins |
 |
 |
| Module-wise count rates for Quadrant D Data is divided into 100 sec bins |
 |
 |
| Parameter | Plot |
|---|---|
| CZT HV Monitor |  |
| D_VDD | 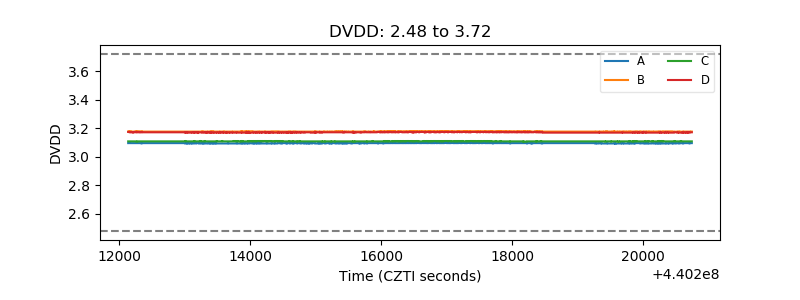 |
| Temperature 1 | 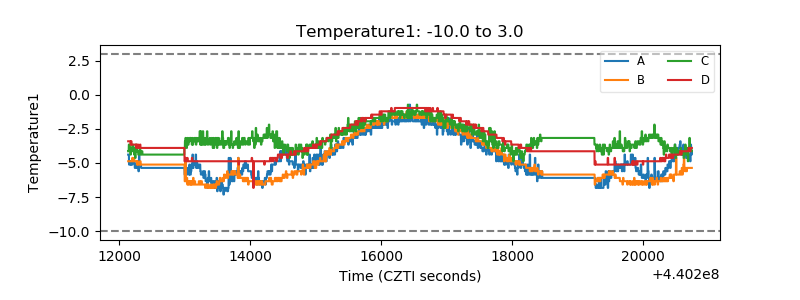 |
| Veto HV Monitor | 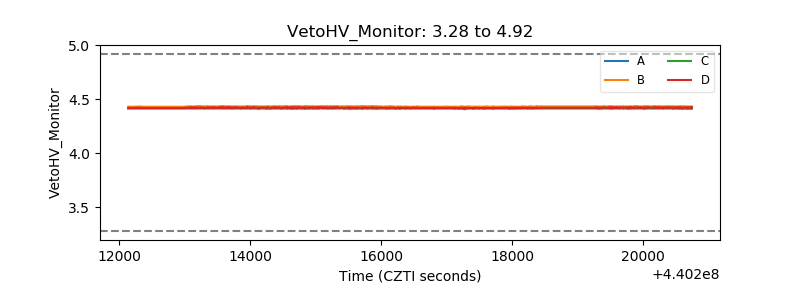 |
| Veto LLD | 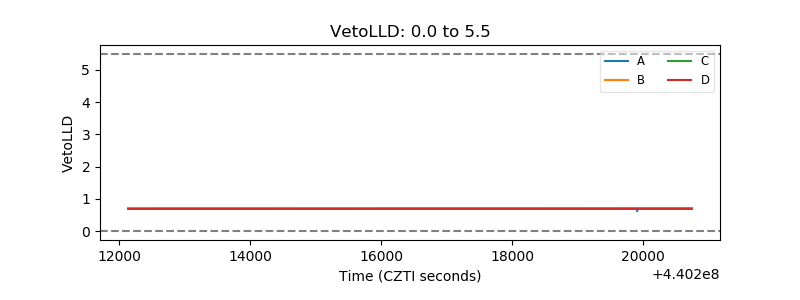 |
| Alpha Counter | 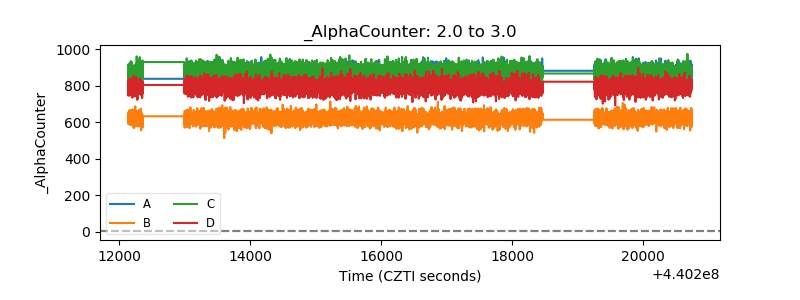 |
| _CPM_Rate | 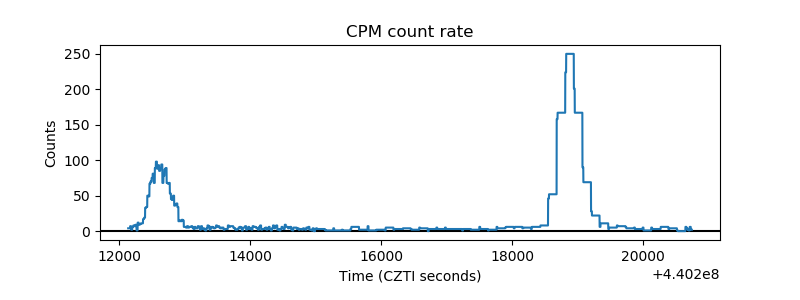 |
| CZT Counter | 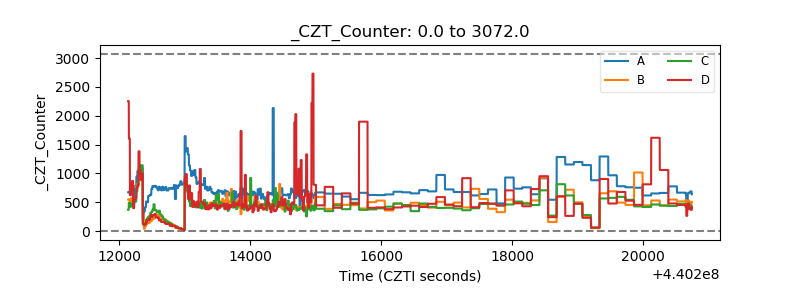 |
| +2.5 Volts monitor | 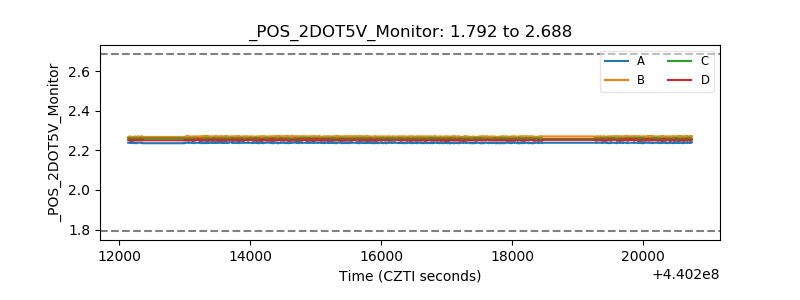 |
| +5 Volts monitor | 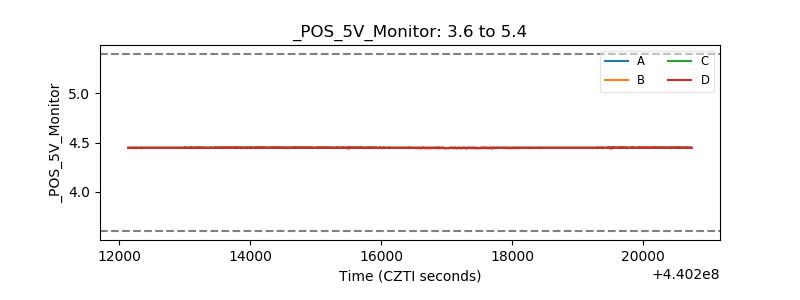 |
| _ROLL_ROT | 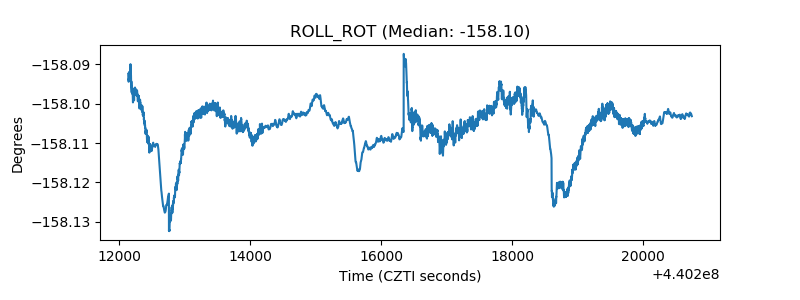 |
| _Roll_DEC | 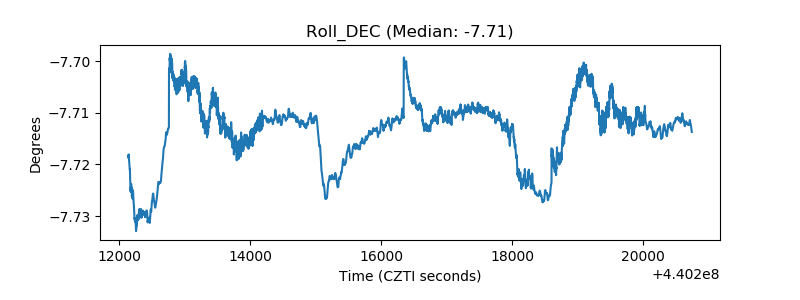 |
| _Roll_RA | 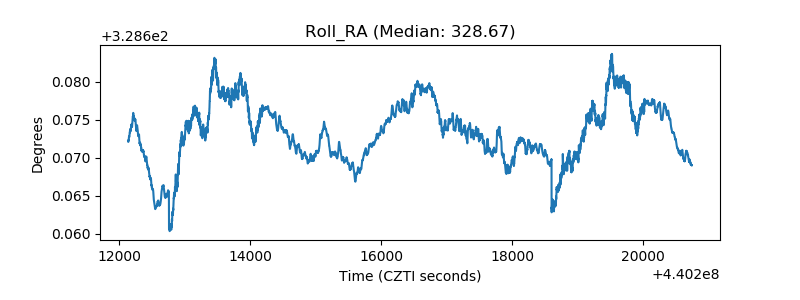 |
| Veto Counter | 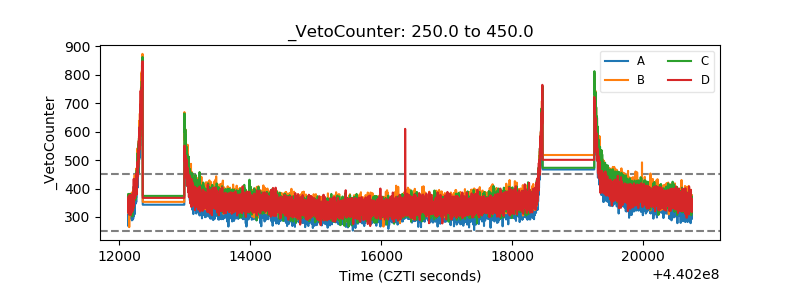 |