| Param | Original file | Final file |
|---|---|---|
| Filename | modeM0/AS1A13_008T08_9000005998_44399cztM0_level2.fits | modeM0/AS1A13_008T08_9000005998_44399cztM0_level2_quad_clean.evt |
| Size (bytes) | 485,881,920 | 109,255,680 |
| Size | 463.4 MB | 104.2 MB |
| Events in quadrant A | 5,000,854 | 733,925 |
| Events in quadrant B | 3,482,917 | 770,707 |
| Events in quadrant C | 3,332,053 | 735,512 |
| Events in quadrant D | 5,661,123 | 610,929 |
| Mode SS | |||
|---|---|---|---|
| Quadrant | BADHDUFLAG | Total packets | Discarded packets |
| A | 0 | 134 | 0 |
| B | 0 | 134 | 0 |
| C | 0 | 134 | 0 |
| D | 0 | 134 | 0 |
| Mode M0 | |||
|---|---|---|---|
| Quadrant | BADHDUFLAG | Total packets | Discarded packets |
| A | 0 | 20544 | 2 |
| B | 0 | 14498 | 2 |
| C | 0 | 14342 | 2 |
| D | 0 | 21230 | 2 |
| Mode M9 | |||
|---|---|---|---|
| Quadrant | BADHDUFLAG | Total packets | Discarded packets |
| A | 0 | 15 | 0 |
| B | 0 | 16 | 0 |
| C | 0 | 16 | 0 |
| D | 0 | 16 | 0 |
| Quadrant | Total seconds | Saturated seconds | Saturation percentage |
|---|---|---|---|
| A | 6551 | 194 | 2.961380% |
| B | 6551 | 132 | 2.014960% |
| C | 6551 | 89 | 1.358571% |
| D | 6551 | 742 | 11.326515% |
Noise dominated data is calculated using 1-second bins in cleaned event files. If a bin has >2000 counts, and if more than 50% of those come from <1% of pixels, then it is considered to be noise-dominated and hence unusable.
| Quadrant | # 1 sec bins | Bins with >0 counts | Bins with >2000 counts | High rate bins dominated by noise | Noise dominated (total time) | Noise dominated (detector-on time) | Marked lightcurve |
|---|---|---|---|---|---|---|---|
| A | 7621 | 6552 | 15 | 15 | 0.20% | 0.23% | 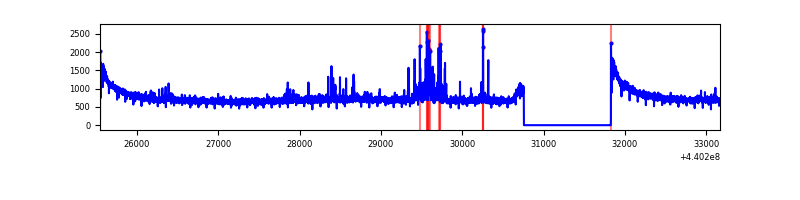 |
| B | 7620 | 6550 | 41 | 41 | 0.54% | 0.63% | 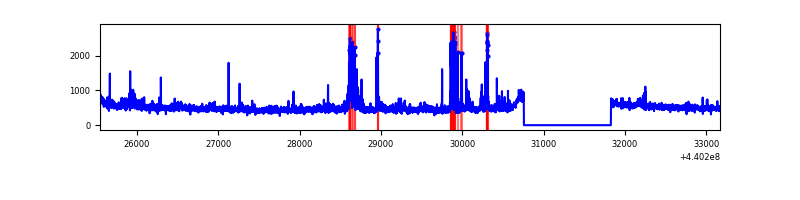 |
| C | 7620 | 6550 | 30 | 30 | 0.39% | 0.46% | 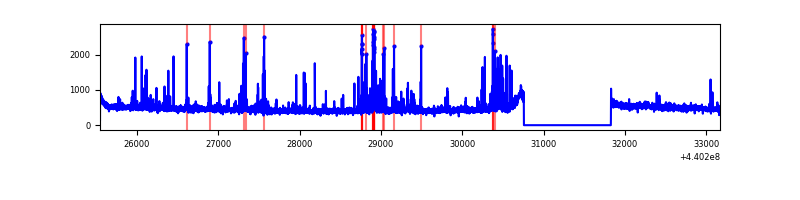 |
| D | 7620 | 6550 | 642 | 642 | 8.43% | 9.80% | 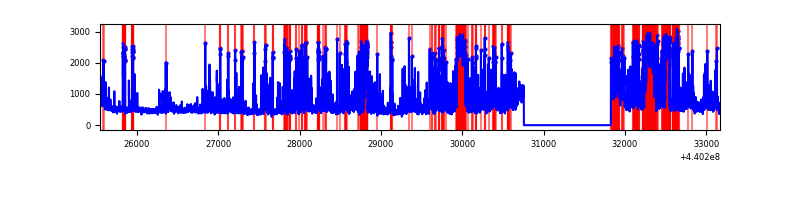 |
Top three noisy pixels from each quadrant. If the there are fewer than three noisy pixels in the level2.evt file, extra rows are filled as -1
| Pixel properties | Quadrant properties | ||||||
|---|---|---|---|---|---|---|---|
| Quadrant | DetID | PixID | Counts | Sigma | Mean | Median | Sigma |
| A | 10 | 83 | 1778864 | 10966.23 | 776 | 757 | 162.1 |
| A | 13 | 248 | 128098 | 785.36 | 776 | 757 | 162.1 |
| A | 0 | 243 | 40537 | 245.34 | 776 | 757 | 162.1 |
| B | 5 | 235 | 160422 | 1045.73 | 774 | 750 | 152.7 |
| B | 4 | 173 | 86503 | 561.62 | 774 | 750 | 152.7 |
| B | 5 | 255 | 57616 | 372.43 | 774 | 750 | 152.7 |
| C | 14 | 254 | 347315 | 1953.55 | 756 | 761 | 177.4 |
| C | 3 | 233 | 22886 | 124.72 | 756 | 761 | 177.4 |
| C | 1 | 3 | 10666 | 55.84 | 756 | 761 | 177.4 |
| D | 6 | 239 | 1186798 | 6495.78 | 725 | 700 | 182.6 |
| D | 2 | 249 | 861119 | 4712.17 | 725 | 700 | 182.6 |
| D | 2 | 153 | 209333 | 1142.6 | 725 | 700 | 182.6 |
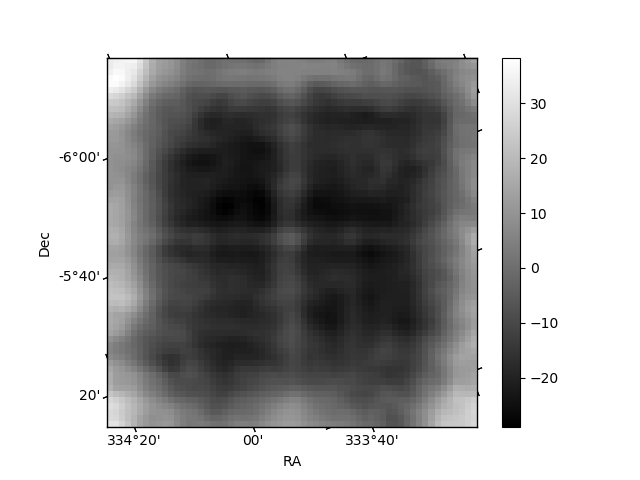
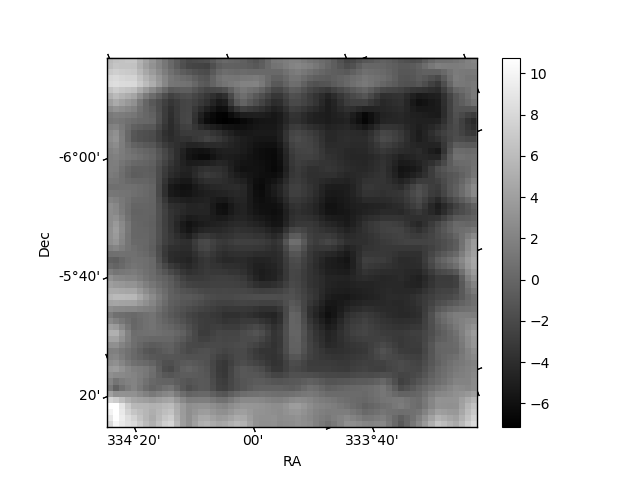
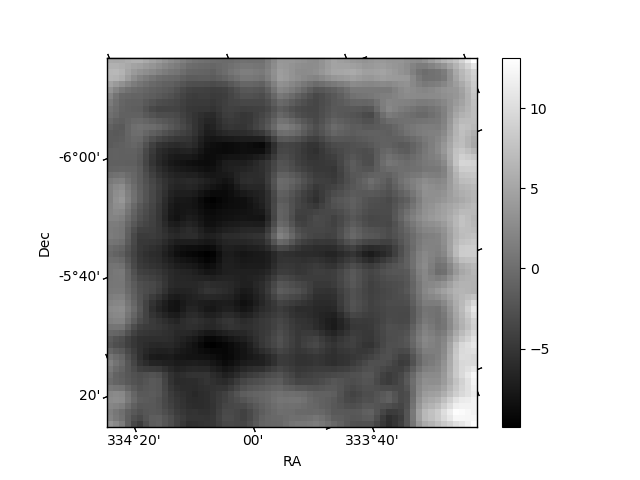
Histogram calculated using DETX and DETY for each event in the final _common_clean file
| Quadrant A | 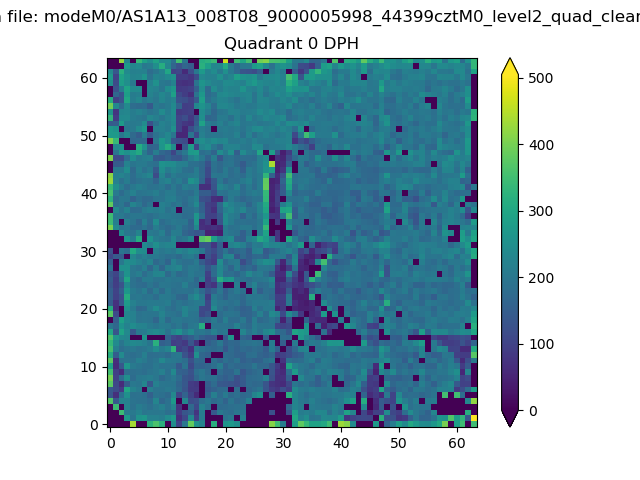 |
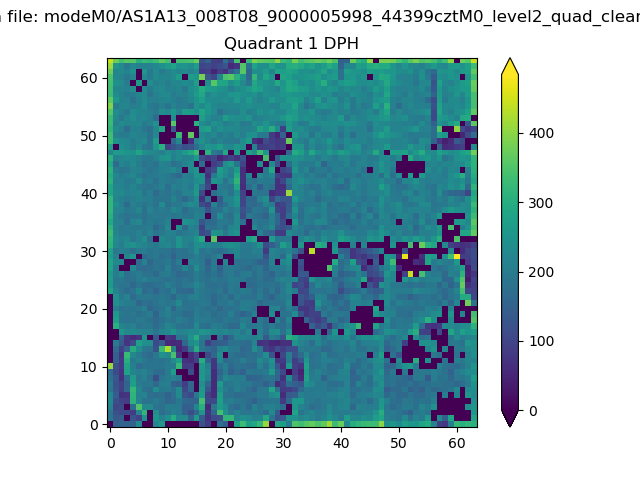 |
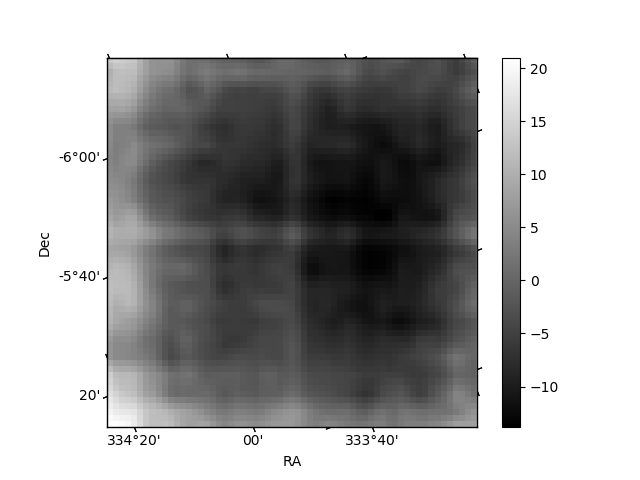
Quadrant B |
|---|---|---|---|
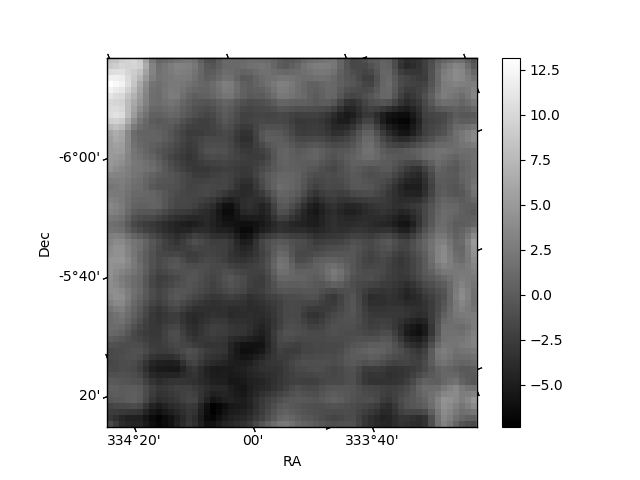
| Quadrant D | 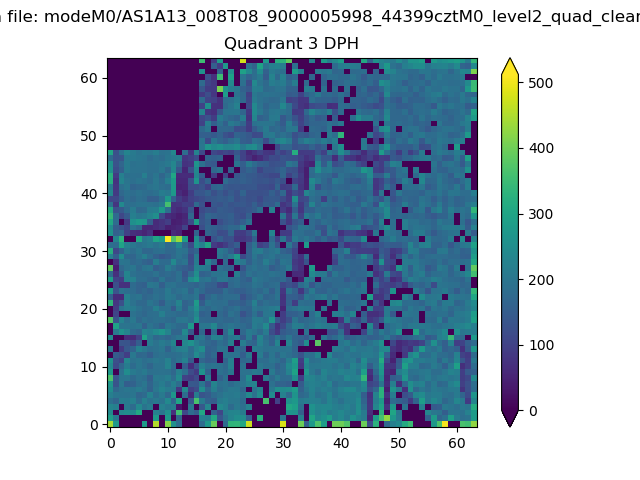 |
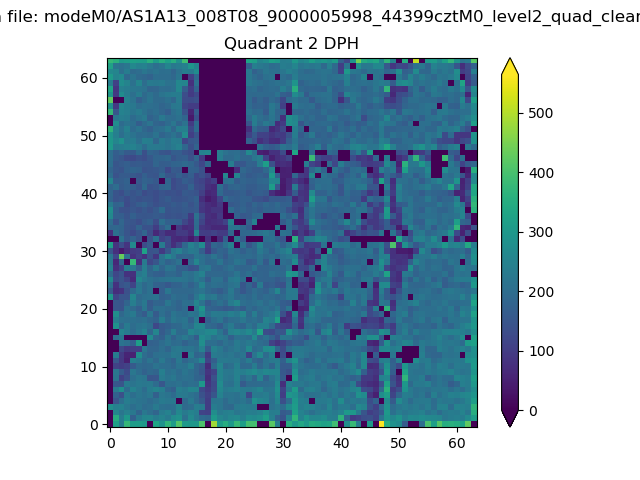 |
Quadrant C |
| Plot type | Count rate plots | Images |
|---|---|---|
| Comparison with Poisson distribution Blue bars denote a histogram of data divided into 1 sec bins. Red curve is a Poisson curve with rate = median count rate of data. |
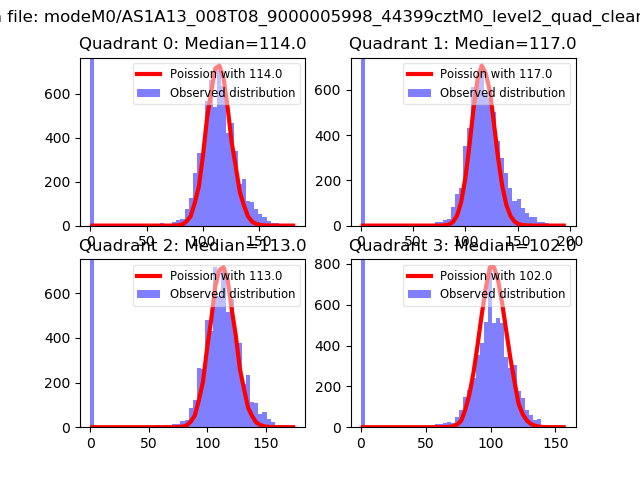 |
 |
| Quadrant-wise count rates Data is divided into 100 sec bins |
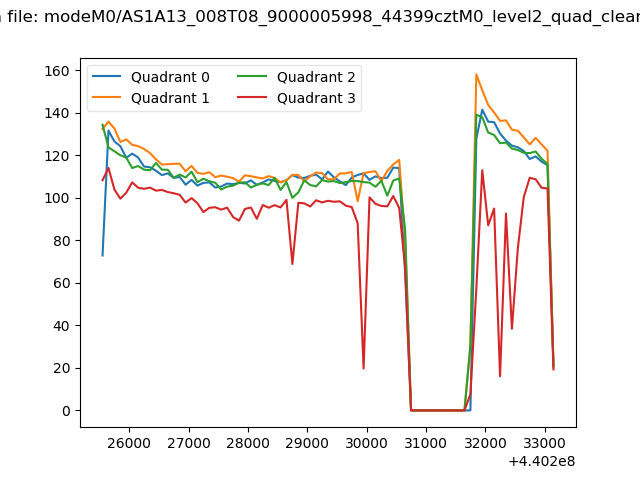 |
|
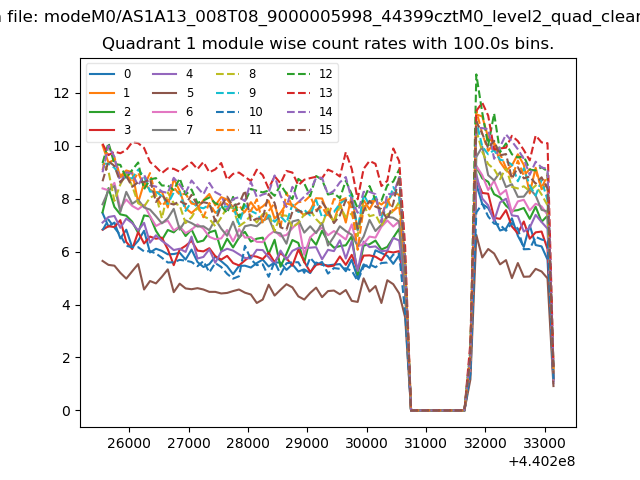
| Module-wise count rates for Quadrant A Data is divided into 100 sec bins |
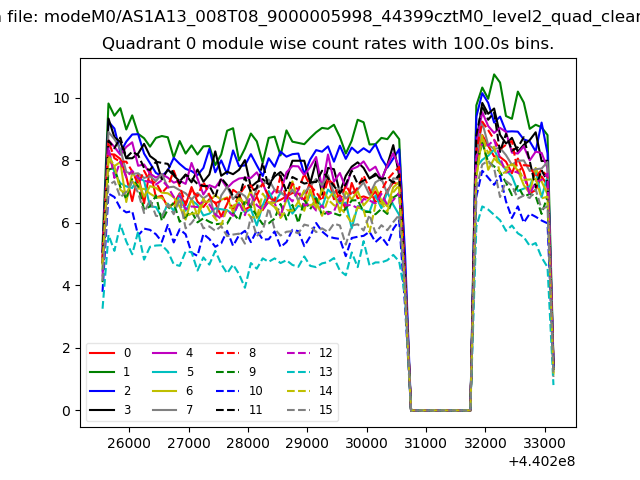 |
 |
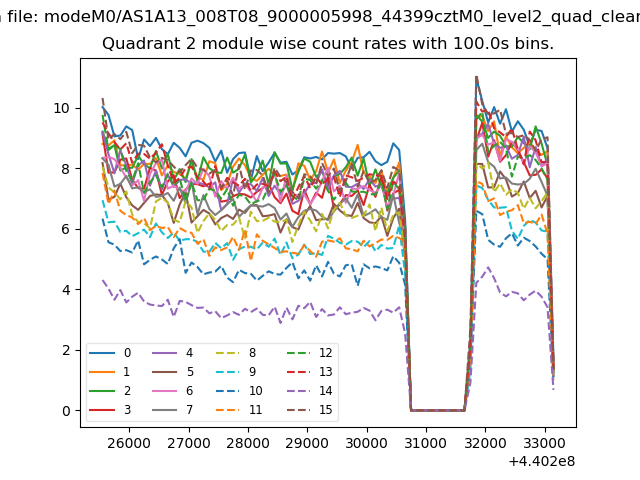
| Module-wise count rates for Quadrant B Data is divided into 100 sec bins |
 |
 |
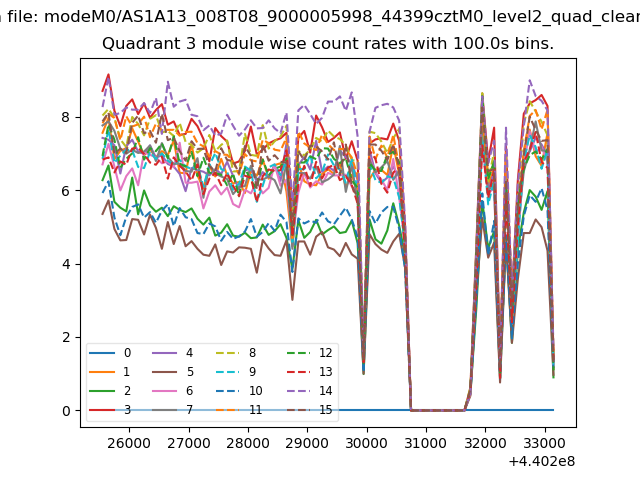
| Module-wise count rates for Quadrant C Data is divided into 100 sec bins |
 |
 |
| Module-wise count rates for Quadrant D Data is divided into 100 sec bins |
 |
 |
| Parameter | Plot |
|---|---|
| CZT HV Monitor | 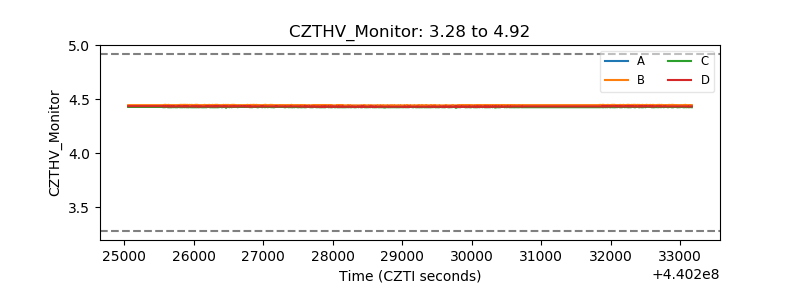 |
| D_VDD | 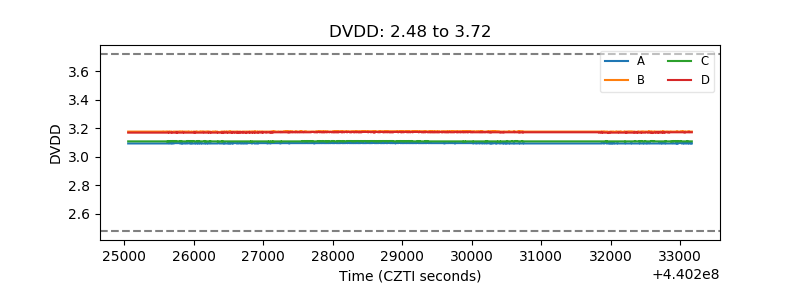 |
| Temperature 1 | 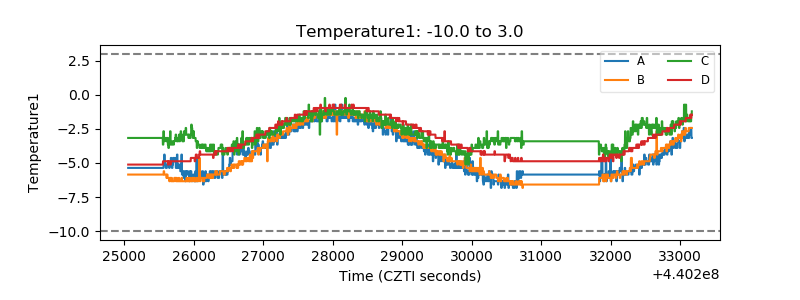 |
| Veto HV Monitor | 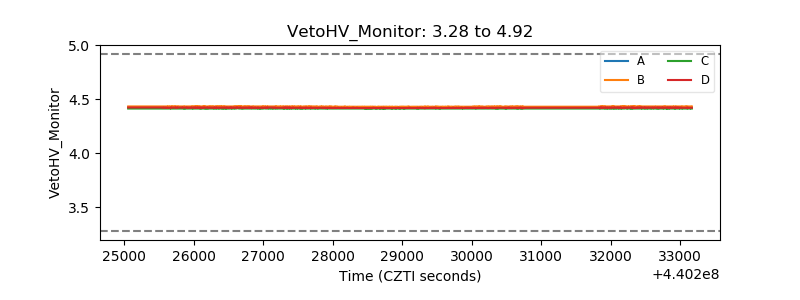 |
| Veto LLD | 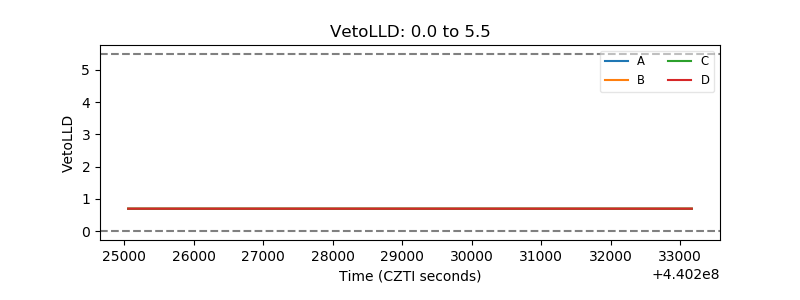 |
| Alpha Counter | 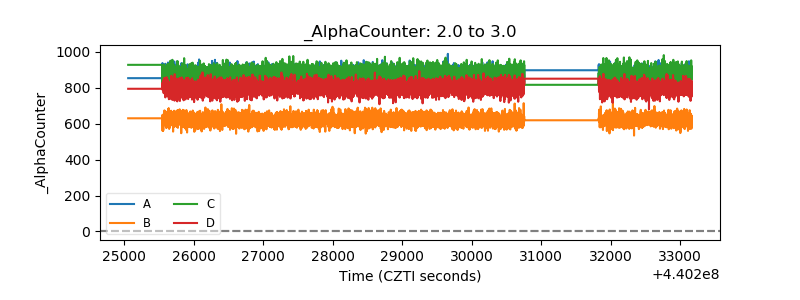 |
| _CPM_Rate | 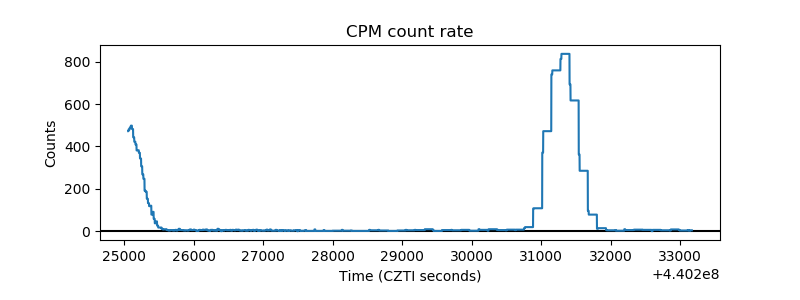 |
| CZT Counter | 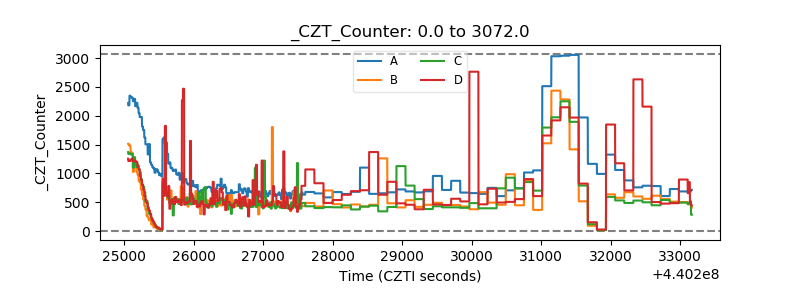 |
| +2.5 Volts monitor | 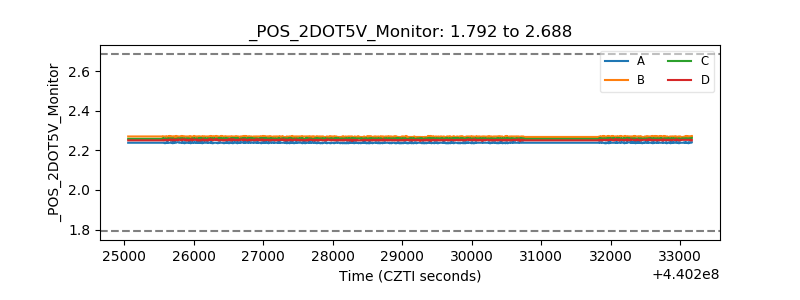 |
| +5 Volts monitor | 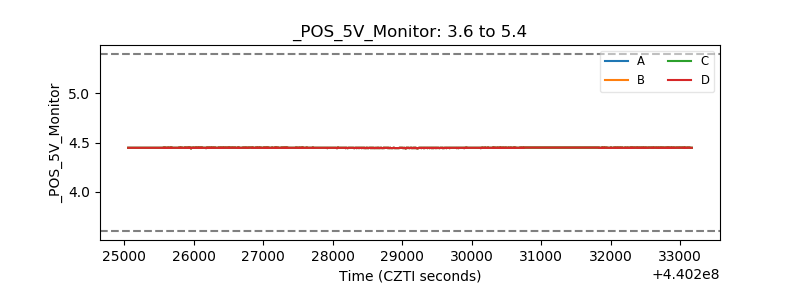 |
| _ROLL_ROT | 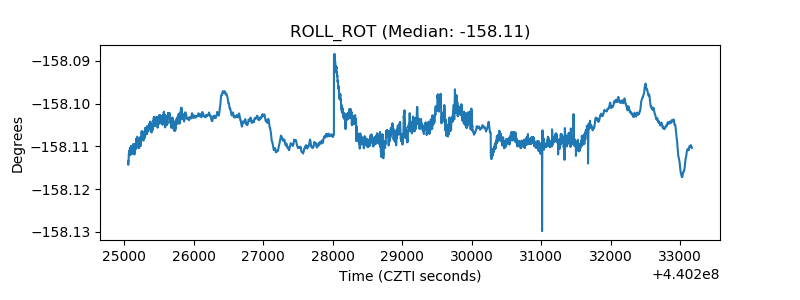 |
| _Roll_DEC | 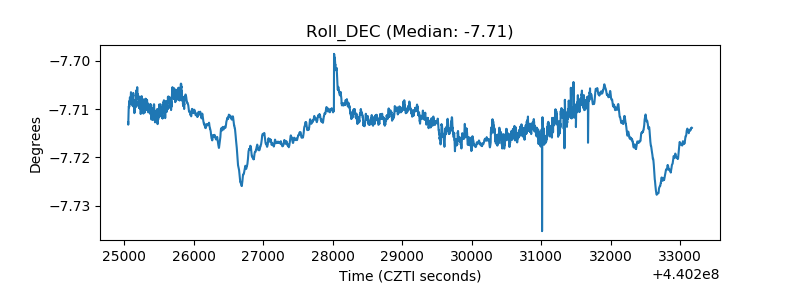 |
| _Roll_RA | 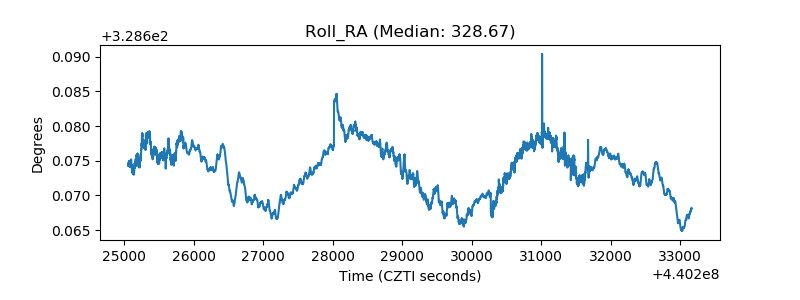 |
| Veto Counter | 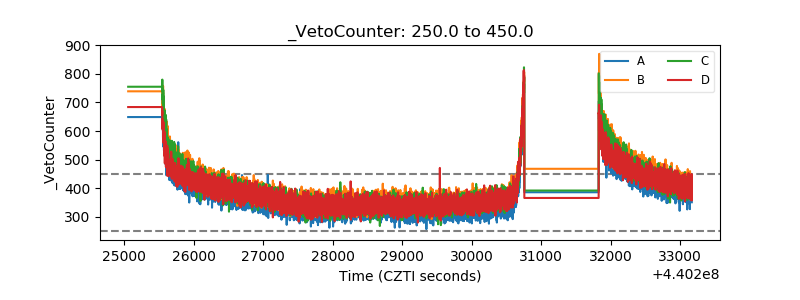 |