| Param | Original file | Final file |
|---|---|---|
| Filename | modeM0/AS1A13_008T08_9000005998_44401cztM0_level2.fits | modeM0/AS1A13_008T08_9000005998_44401cztM0_level2_quad_clean.evt |
| Size (bytes) | 467,357,760 | 104,218,560 |
| Size | 445.7 MB | 99.4 MB |
| Events in quadrant A | 4,585,755 | 714,373 |
| Events in quadrant B | 3,346,767 | 734,433 |
| Events in quadrant C | 3,188,964 | 696,956 |
| Events in quadrant D | 5,708,592 | 587,693 |
| Mode SS | |||
|---|---|---|---|
| Quadrant | BADHDUFLAG | Total packets | Discarded packets |
| A | 0 | 122 | 0 |
| B | 0 | 122 | 0 |
| C | 0 | 122 | 0 |
| D | 0 | 122 | 0 |
| Mode M0 | |||
|---|---|---|---|
| Quadrant | BADHDUFLAG | Total packets | Discarded packets |
| A | 0 | 18654 | 1 |
| B | 0 | 13780 | 1 |
| C | 0 | 13520 | 1 |
| D | 0 | 21048 | 1 |
| Mode M9 | |||
|---|---|---|---|
| Quadrant | BADHDUFLAG | Total packets | Discarded packets |
| A | 0 | 12 | 0 |
| B | 0 | 12 | 0 |
| C | 0 | 12 | 0 |
| D | 0 | 12 | 0 |
| Quadrant | Total seconds | Saturated seconds | Saturation percentage |
|---|---|---|---|
| A | 6051 | 148 | 2.445877% |
| B | 6051 | 143 | 2.363246% |
| C | 6052 | 92 | 1.520159% |
| D | 6052 | 769 | 12.706543% |
Noise dominated data is calculated using 1-second bins in cleaned event files. If a bin has >2000 counts, and if more than 50% of those come from <1% of pixels, then it is considered to be noise-dominated and hence unusable.
| Quadrant | # 1 sec bins | Bins with >0 counts | Bins with >2000 counts | High rate bins dominated by noise | Noise dominated (total time) | Noise dominated (detector-on time) | Marked lightcurve |
|---|---|---|---|---|---|---|---|
| A | 7211 | 6052 | 4 | 4 | 0.06% | 0.07% | 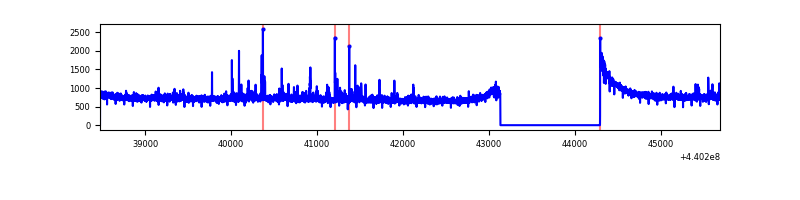 |
| B | 7211 | 6052 | 32 | 32 | 0.44% | 0.53% | 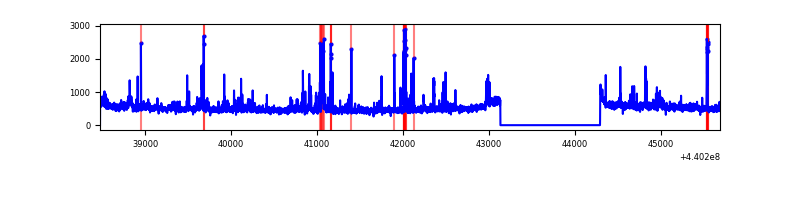 |
| C | 7212 | 6052 | 19 | 19 | 0.26% | 0.31% | 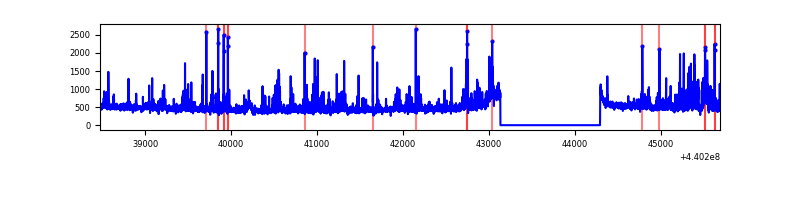 |
| D | 7212 | 6052 | 654 | 654 | 9.07% | 10.81% | 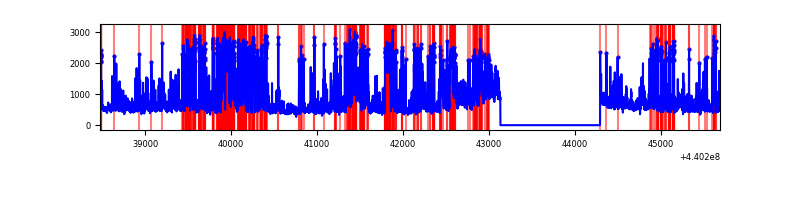 |
Top three noisy pixels from each quadrant. If the there are fewer than three noisy pixels in the level2.evt file, extra rows are filled as -1
| Pixel properties | Quadrant properties | ||||||
|---|---|---|---|---|---|---|---|
| Quadrant | DetID | PixID | Counts | Sigma | Mean | Median | Sigma |
| A | 10 | 83 | 1638148 | 10764.69 | 732 | 718 | 152.1 |
| A | 13 | 248 | 51591 | 334.45 | 732 | 718 | 152.1 |
| A | 0 | 243 | 39650 | 255.94 | 732 | 718 | 152.1 |
| B | 5 | 235 | 96019 | 662.94 | 726 | 705 | 143.8 |
| B | 0 | 155 | 90470 | 624.34 | 726 | 705 | 143.8 |
| B | 0 | 219 | 78037 | 537.87 | 726 | 705 | 143.8 |
| C | 14 | 254 | 386705 | 2323.0 | 702 | 707 | 166.2 |
| C | 3 | 233 | 37215 | 219.71 | 702 | 707 | 166.2 |
| C | 12 | 250 | 10365 | 58.12 | 702 | 707 | 166.2 |
| D | 2 | 249 | 550699 | 3223.35 | 679 | 658 | 170.6 |
| D | 6 | 239 | 548743 | 3211.89 | 679 | 658 | 170.6 |
| D | 4 | 221 | 485442 | 2840.93 | 679 | 658 | 170.6 |
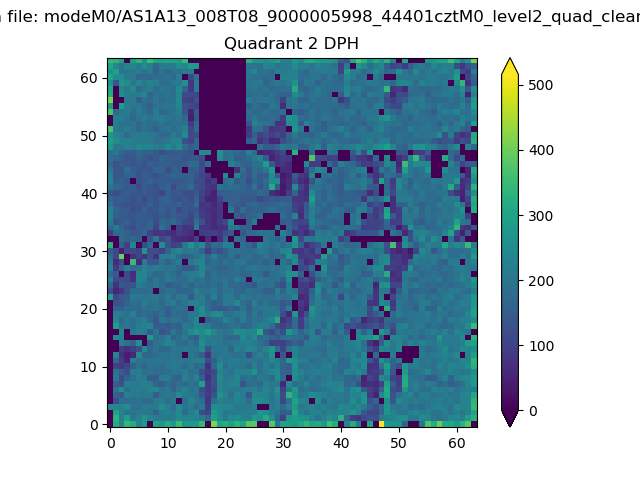
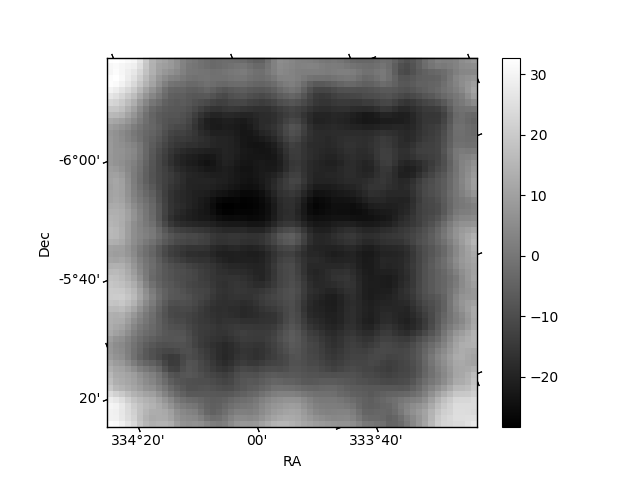
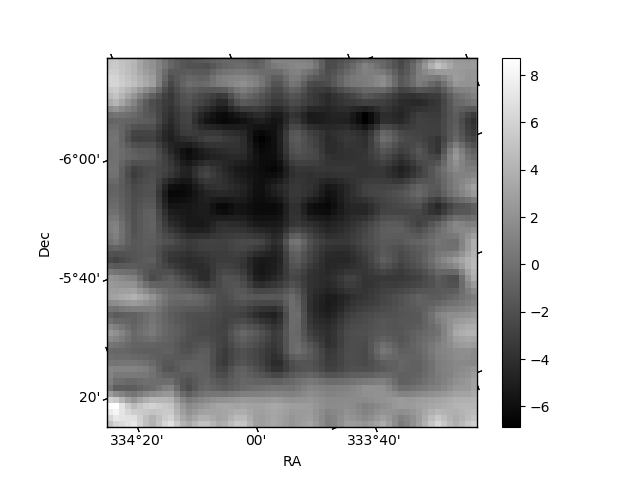
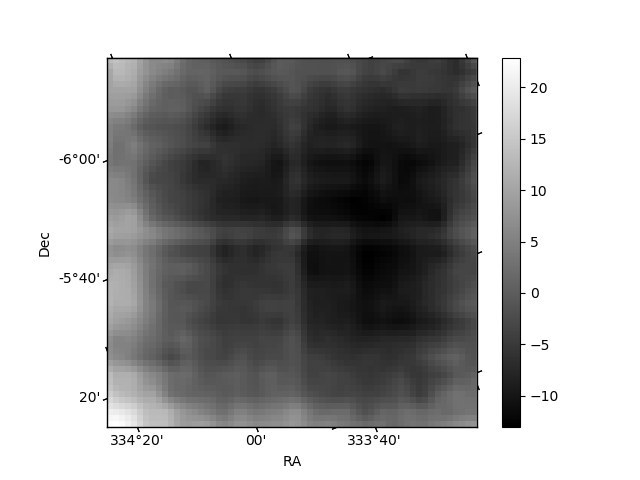
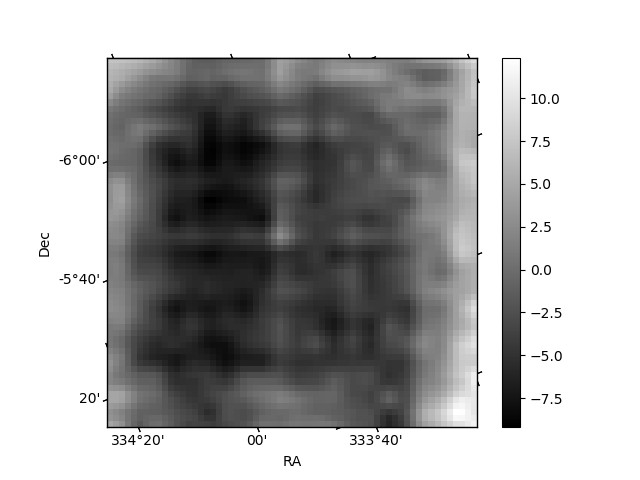
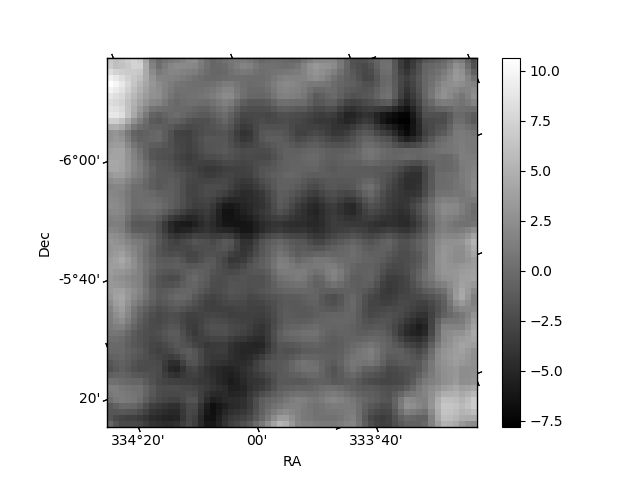
Histogram calculated using DETX and DETY for each event in the final _common_clean file
| Quadrant A | 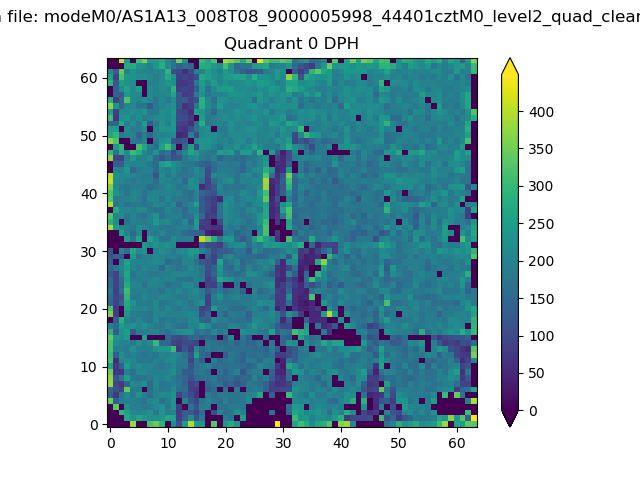 |
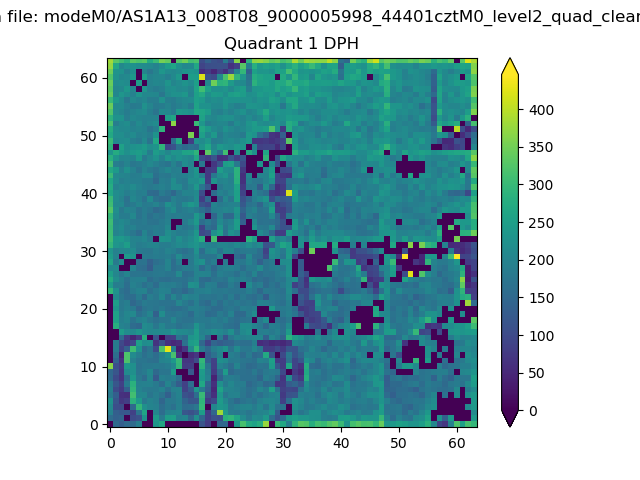 |
Quadrant B |
|---|---|---|---|
| Quadrant D | 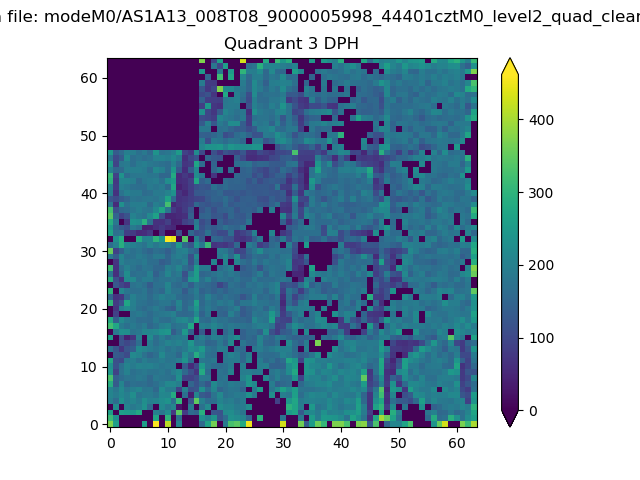 |
 |
Quadrant C |
| Plot type | Count rate plots | Images |
|---|---|---|
| Comparison with Poisson distribution Blue bars denote a histogram of data divided into 1 sec bins. Red curve is a Poisson curve with rate = median count rate of data. |
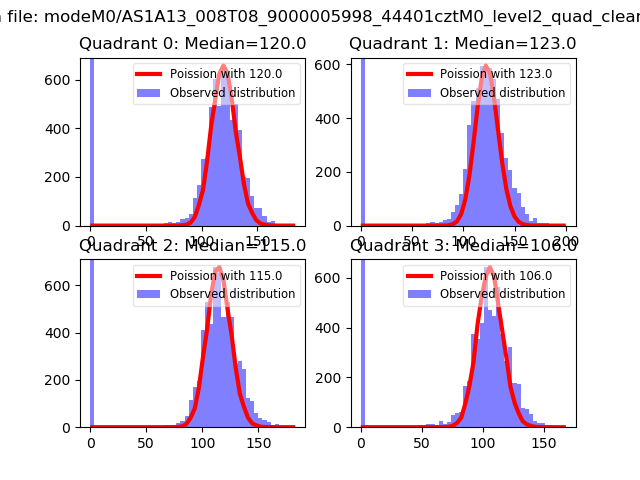 |
 |
| Quadrant-wise count rates Data is divided into 100 sec bins |
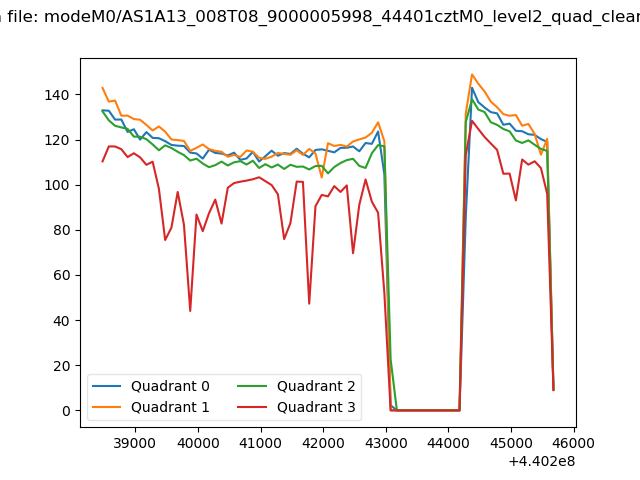 |
|
| Module-wise count rates for Quadrant A Data is divided into 100 sec bins |
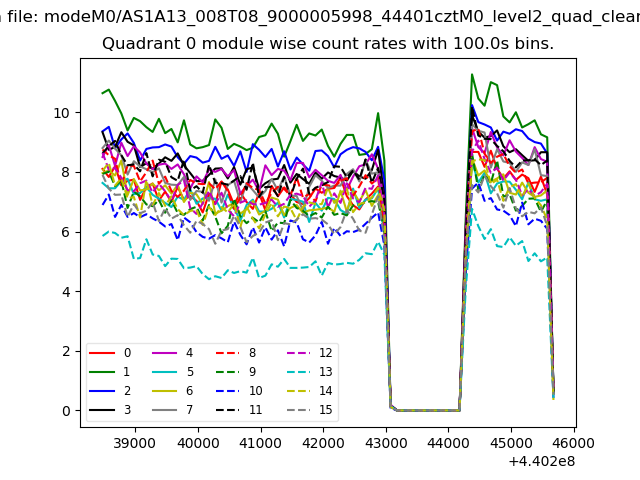 |
 |
| Module-wise count rates for Quadrant B Data is divided into 100 sec bins |
 |
 |
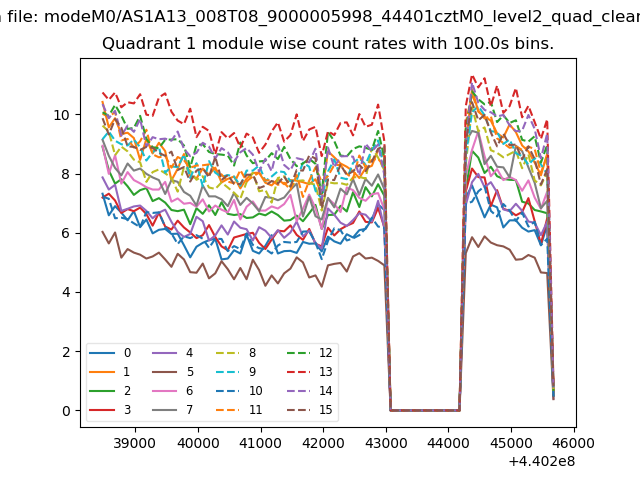
| Module-wise count rates for Quadrant C Data is divided into 100 sec bins |
 |
 |
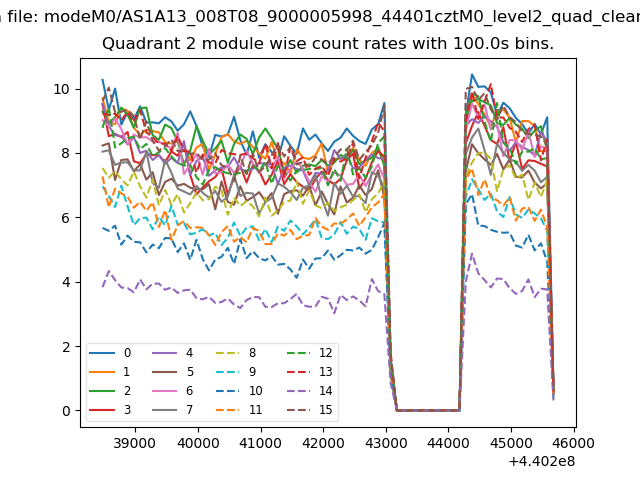
| Module-wise count rates for Quadrant D Data is divided into 100 sec bins |
 |
 |
| Parameter | Plot |
|---|---|
| CZT HV Monitor | 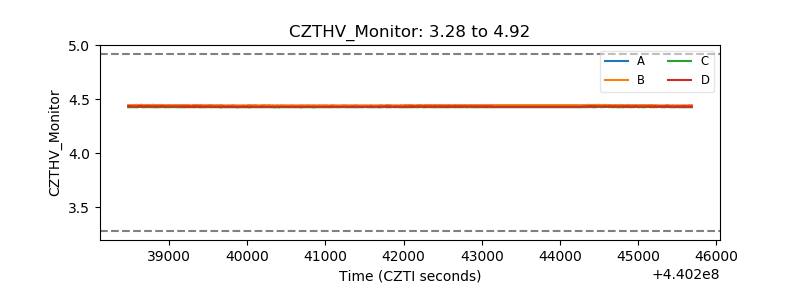 |
| D_VDD | 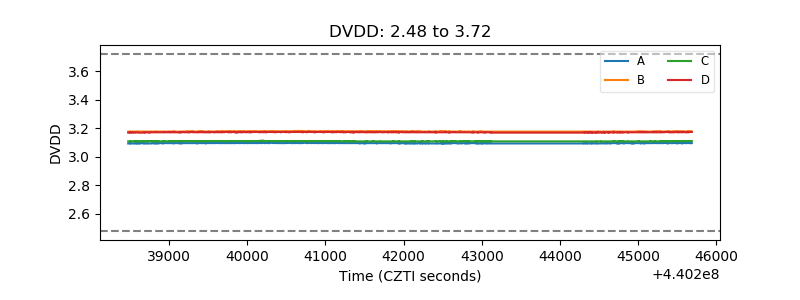 |
| Temperature 1 | 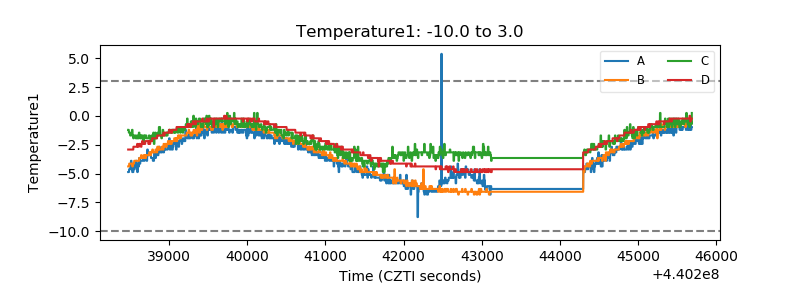 |
| Veto HV Monitor | 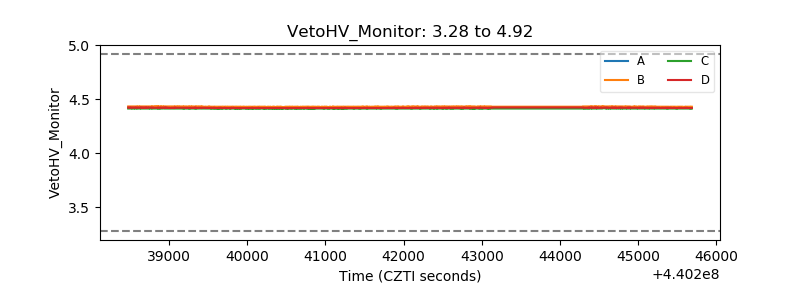 |
| Veto LLD | 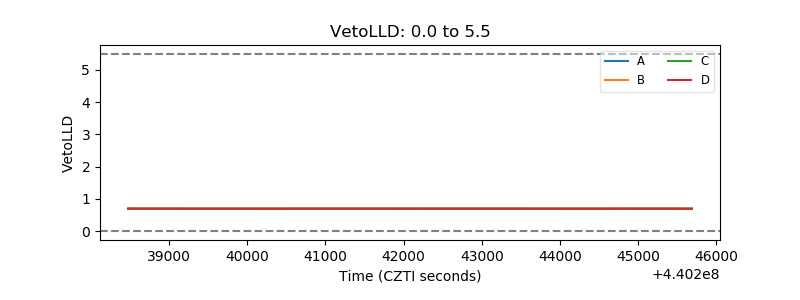 |
| Alpha Counter | 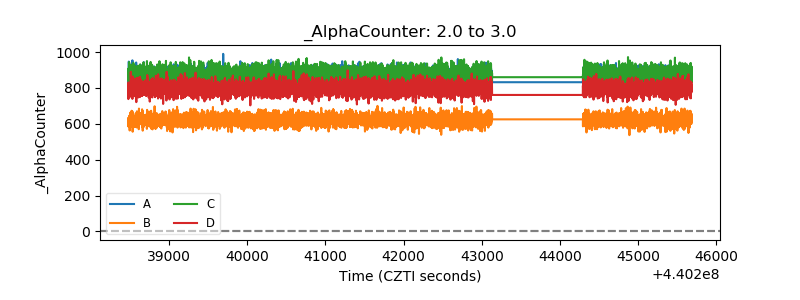 |
| _CPM_Rate | 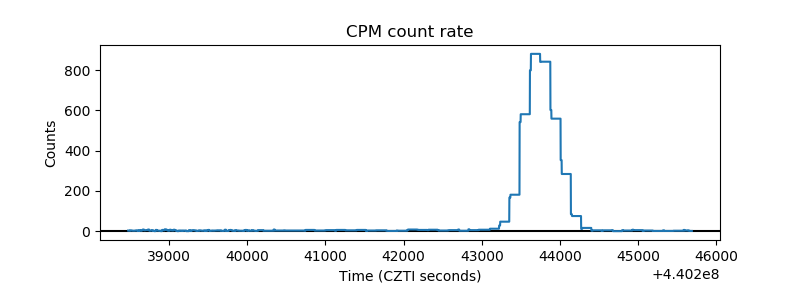 |
| CZT Counter | 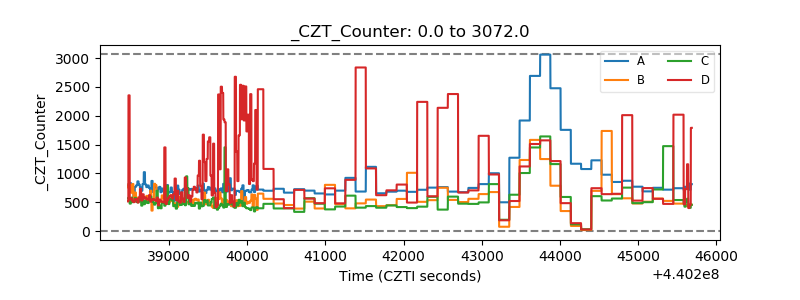 |
| +2.5 Volts monitor | 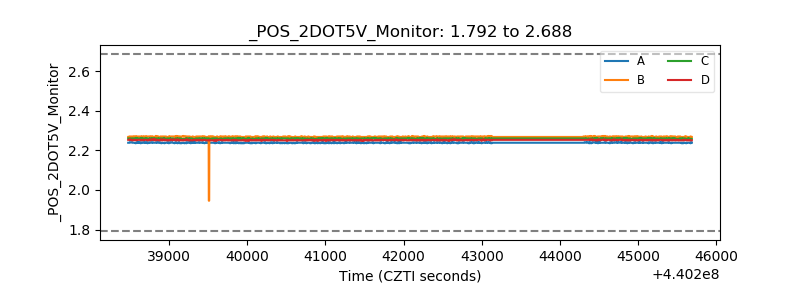 |
| +5 Volts monitor | 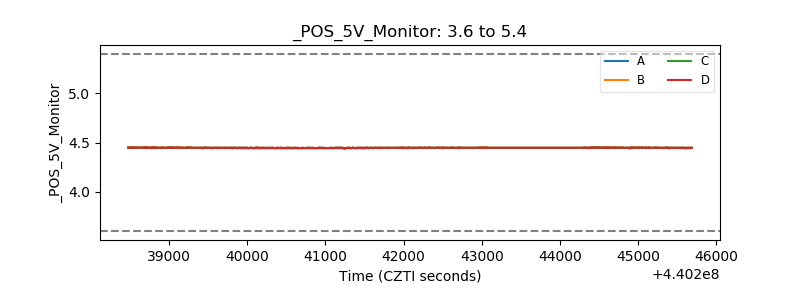 |
| _ROLL_ROT | 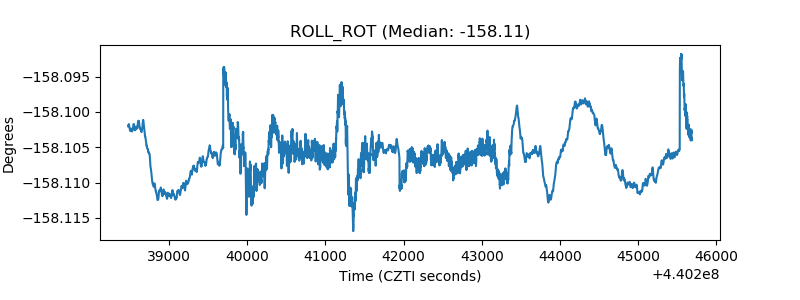 |
| _Roll_DEC | 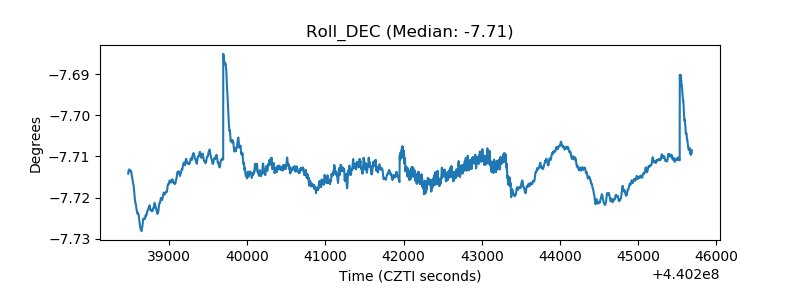 |
| _Roll_RA | 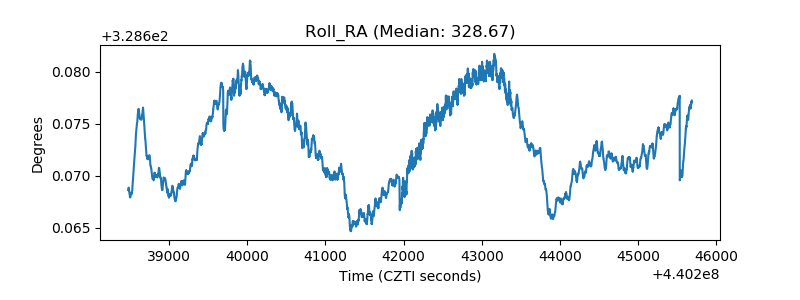 |
| Veto Counter |  |