| Param | Original file | Final file |
|---|---|---|
| Filename | modeM0/AS1A13_008T08_9000005998_44402cztM0_level2.fits | modeM0/AS1A13_008T08_9000005998_44402cztM0_level2_quad_clean.evt |
| Size (bytes) | 463,965,120 | 104,532,480 |
| Size | 442.5 MB | 99.7 MB |
| Events in quadrant A | 4,742,086 | 708,029 |
| Events in quadrant B | 3,283,365 | 733,216 |
| Events in quadrant C | 3,273,378 | 697,627 |
| Events in quadrant D | 5,397,271 | 596,292 |
| Mode SS | |||
|---|---|---|---|
| Quadrant | BADHDUFLAG | Total packets | Discarded packets |
| A | 0 | 126 | 0 |
| B | 0 | 126 | 0 |
| C | 0 | 126 | 0 |
| D | 0 | 126 | 0 |
| Mode M0 | |||
|---|---|---|---|
| Quadrant | BADHDUFLAG | Total packets | Discarded packets |
| A | 0 | 19112 | 1 |
| B | 0 | 13705 | 1 |
| C | 0 | 14022 | 1 |
| D | 0 | 20243 | 1 |
| Mode M9 | |||
|---|---|---|---|
| Quadrant | BADHDUFLAG | Total packets | Discarded packets |
| A | 0 | 11 | 0 |
| B | 0 | 11 | 0 |
| C | 0 | 11 | 0 |
| D | 0 | 11 | 0 |
| Quadrant | Total seconds | Saturated seconds | Saturation percentage |
|---|---|---|---|
| A | 6159 | 199 | 3.231044% |
| B | 6160 | 119 | 1.931818% |
| C | 6160 | 84 | 1.363636% |
| D | 6160 | 668 | 10.844156% |
Noise dominated data is calculated using 1-second bins in cleaned event files. If a bin has >2000 counts, and if more than 50% of those come from <1% of pixels, then it is considered to be noise-dominated and hence unusable.
| Quadrant | # 1 sec bins | Bins with >0 counts | Bins with >2000 counts | High rate bins dominated by noise | Noise dominated (total time) | Noise dominated (detector-on time) | Marked lightcurve |
|---|---|---|---|---|---|---|---|
| A | 7294 | 6160 | 22 | 22 | 0.30% | 0.36% | 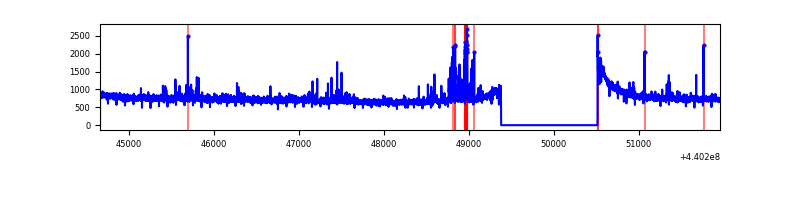 |
| B | 7295 | 6160 | 21 | 21 | 0.29% | 0.34% | 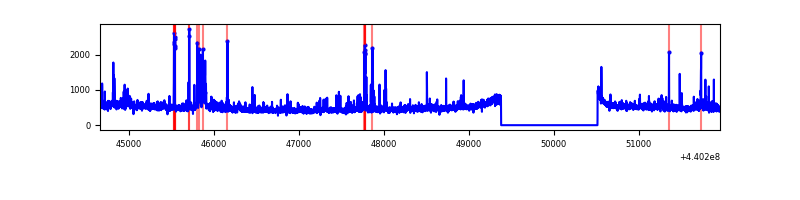 |
| C | 7295 | 6161 | 26 | 26 | 0.36% | 0.42% | 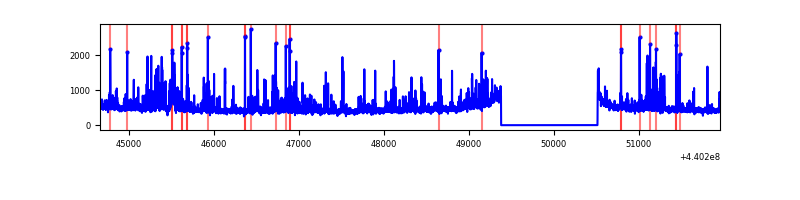 |
| D | 7295 | 6160 | 571 | 571 | 7.83% | 9.27% | 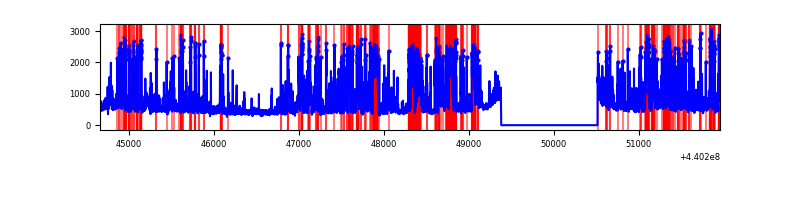 |
Top three noisy pixels from each quadrant. If the there are fewer than three noisy pixels in the level2.evt file, extra rows are filled as -1
| Pixel properties | Quadrant properties | ||||||
|---|---|---|---|---|---|---|---|
| Quadrant | DetID | PixID | Counts | Sigma | Mean | Median | Sigma |
| A | 10 | 83 | 1692582 | 11123.21 | 730 | 716 | 152.1 |
| A | 13 | 248 | 157732 | 1032.3 | 730 | 716 | 152.1 |
| A | 0 | 243 | 46944 | 303.93 | 730 | 716 | 152.1 |
| B | 5 | 235 | 139821 | 962.38 | 728 | 708 | 144.6 |
| B | 0 | 155 | 72178 | 494.43 | 728 | 708 | 144.6 |
| B | 0 | 183 | 43456 | 295.73 | 728 | 708 | 144.6 |
| C | 14 | 254 | 474735 | 2857.48 | 702 | 706 | 165.9 |
| C | 3 | 233 | 20275 | 117.96 | 702 | 706 | 165.9 |
| C | 9 | 54 | 15324 | 88.12 | 702 | 706 | 165.9 |
| D | 4 | 221 | 738968 | 4318.28 | 684 | 665 | 171.0 |
| D | 6 | 239 | 479413 | 2800.16 | 684 | 665 | 171.0 |
| D | 2 | 249 | 373538 | 2180.91 | 684 | 665 | 171.0 |
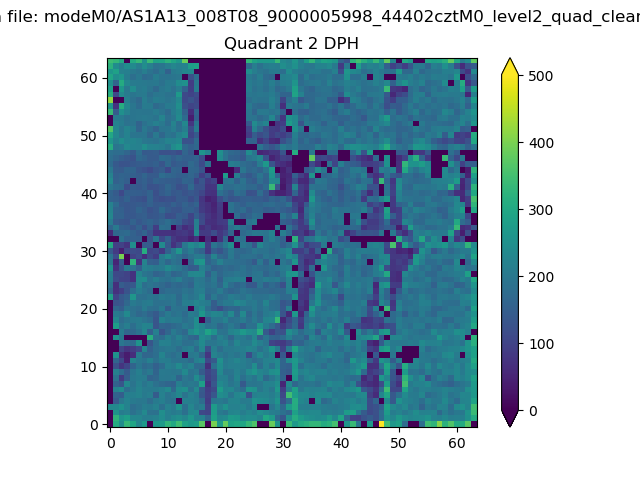
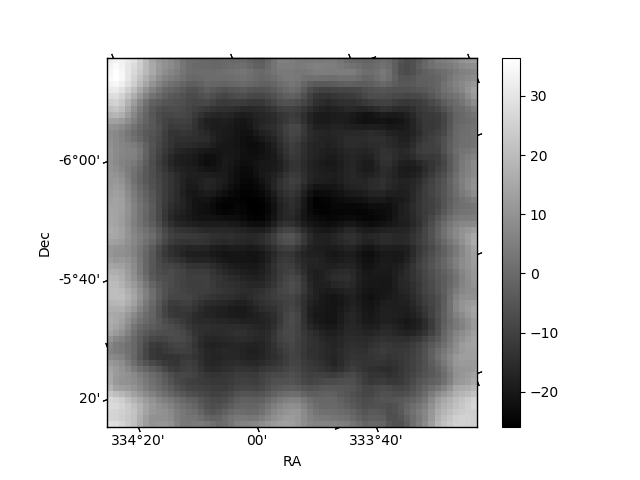
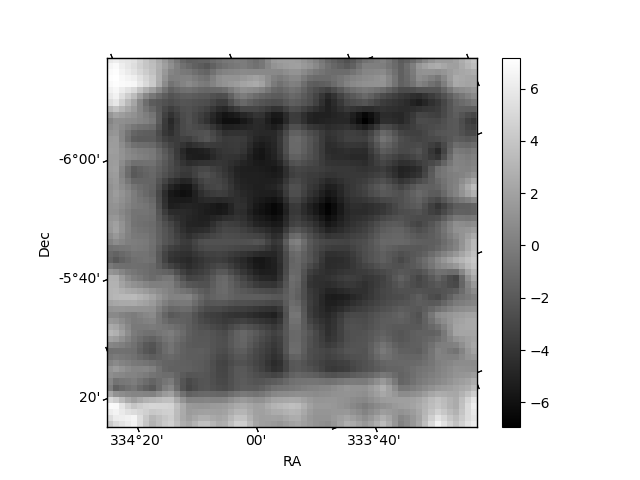
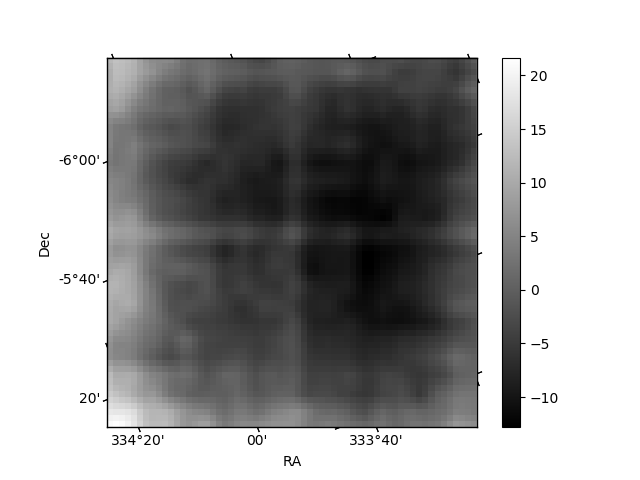
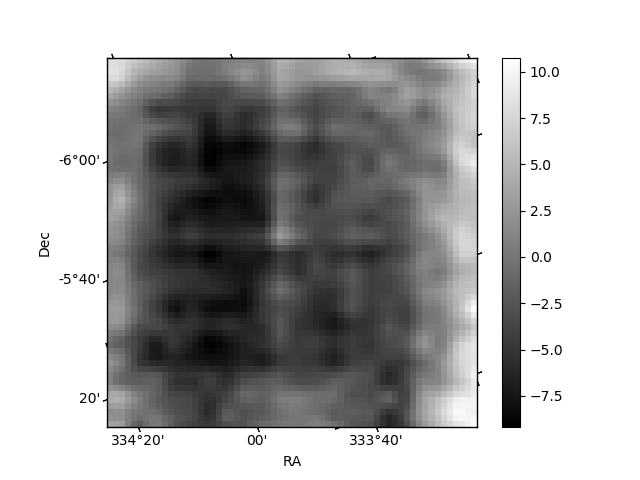
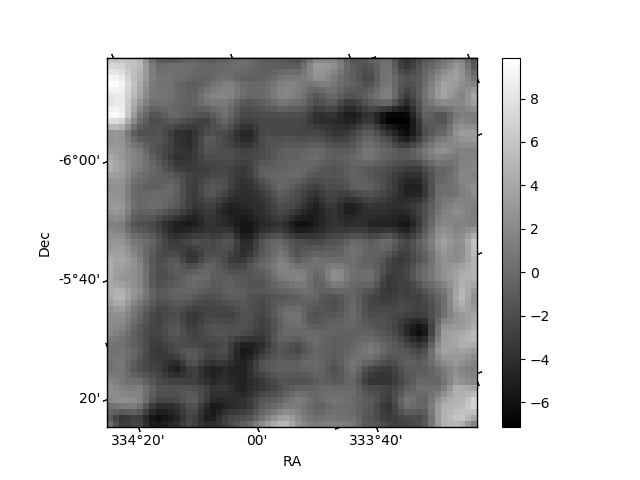
Histogram calculated using DETX and DETY for each event in the final _common_clean file
| Quadrant A | 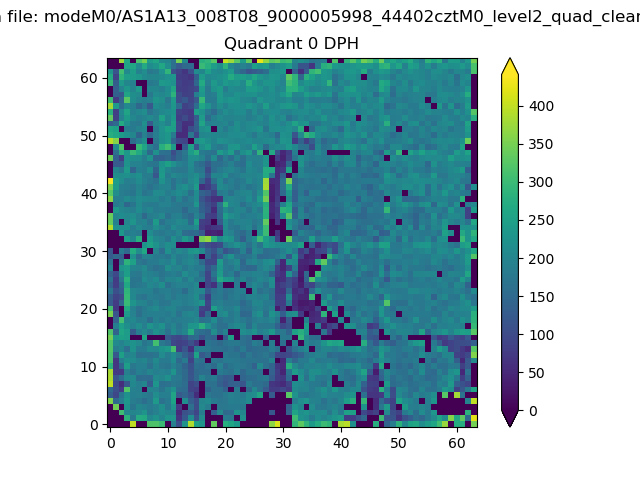 |
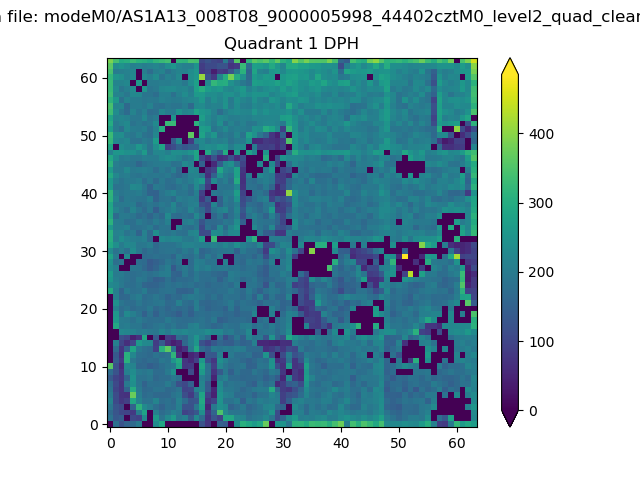 |
Quadrant B |
|---|---|---|---|
| Quadrant D | 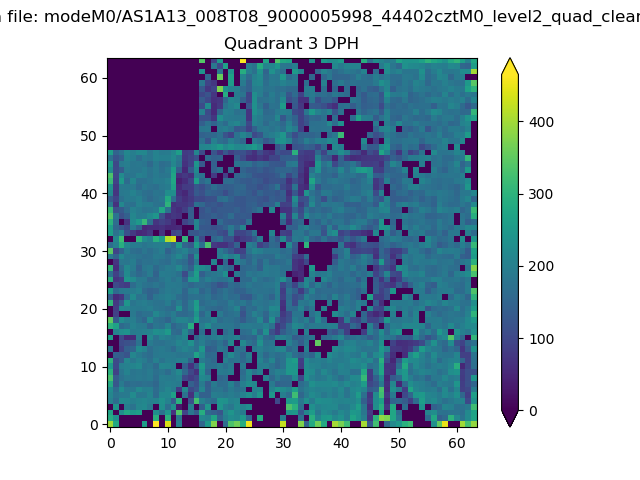 |
 |
Quadrant C |
| Plot type | Count rate plots | Images |
|---|---|---|
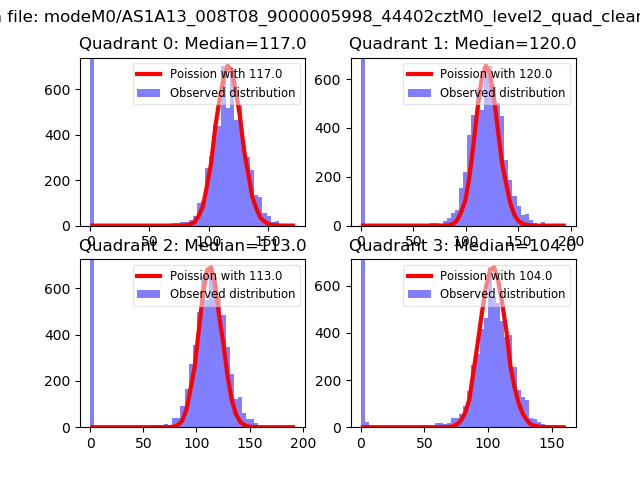
| Comparison with Poisson distribution Blue bars denote a histogram of data divided into 1 sec bins. Red curve is a Poisson curve with rate = median count rate of data. |
 |
 |
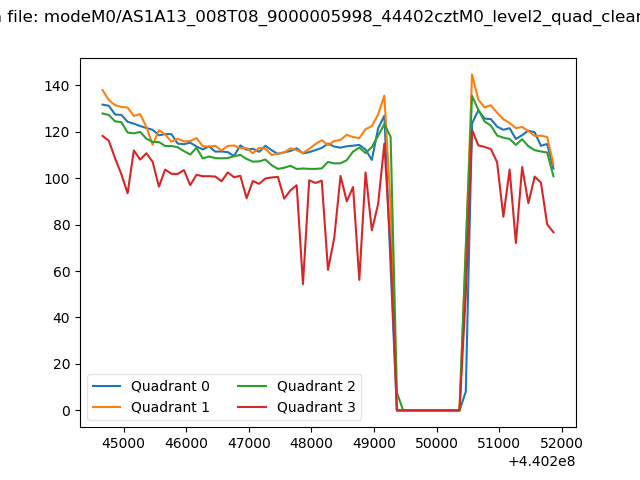
| Quadrant-wise count rates Data is divided into 100 sec bins |
 |
|
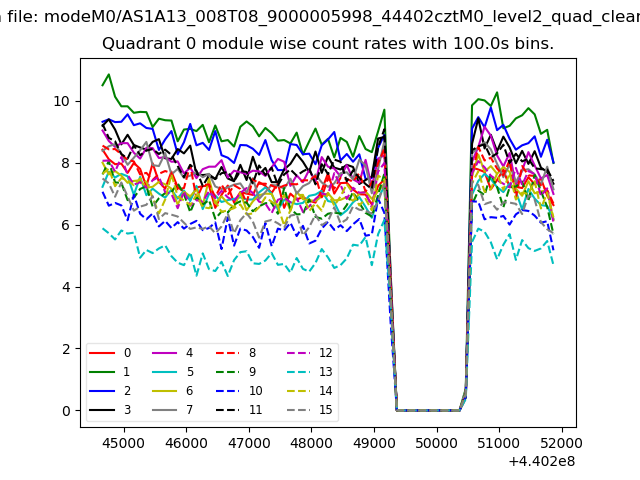
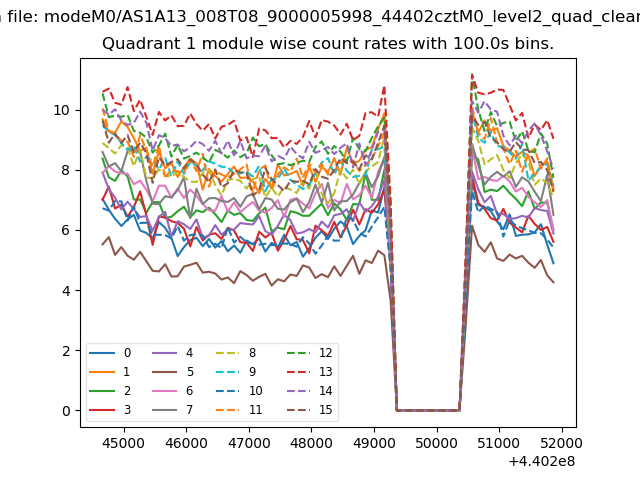
| Module-wise count rates for Quadrant A Data is divided into 100 sec bins |
 |
 |
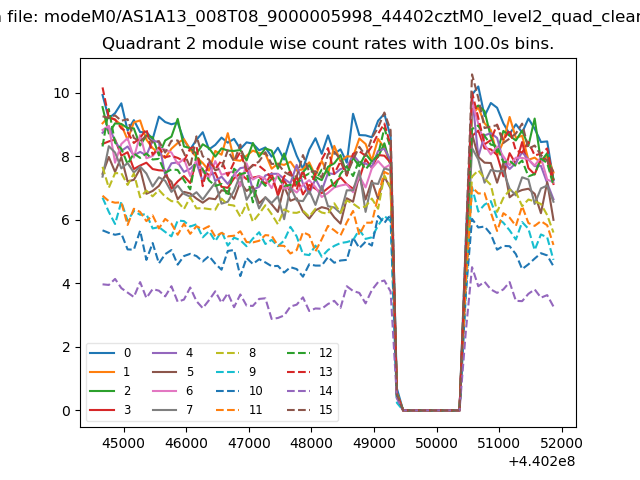
| Module-wise count rates for Quadrant B Data is divided into 100 sec bins |
 |
 |
| Module-wise count rates for Quadrant C Data is divided into 100 sec bins |
 |
 |
| Module-wise count rates for Quadrant D Data is divided into 100 sec bins |
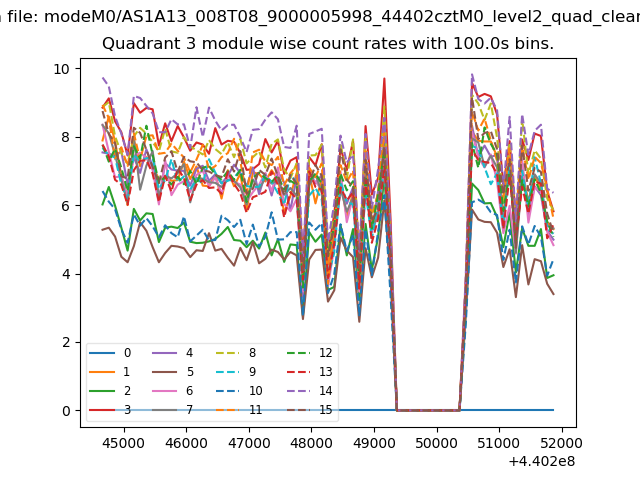 |
 |
| Parameter | Plot |
|---|---|
| CZT HV Monitor | 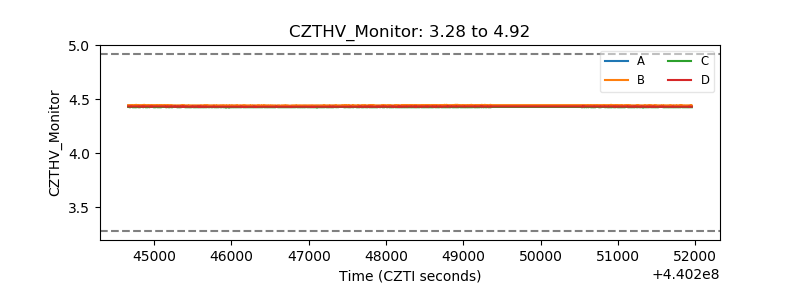 |
| D_VDD | 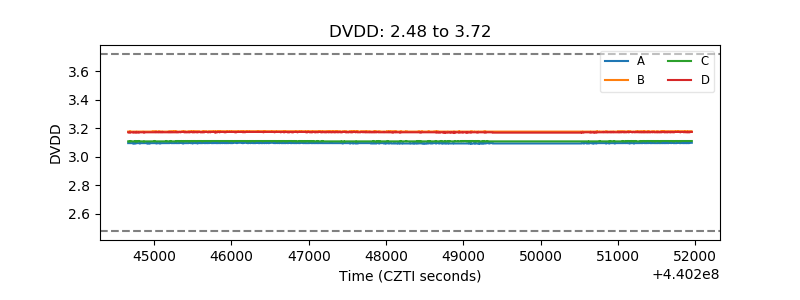 |
| Temperature 1 | 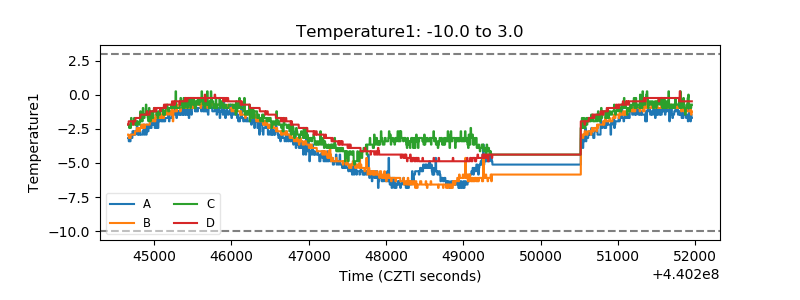 |
| Veto HV Monitor | 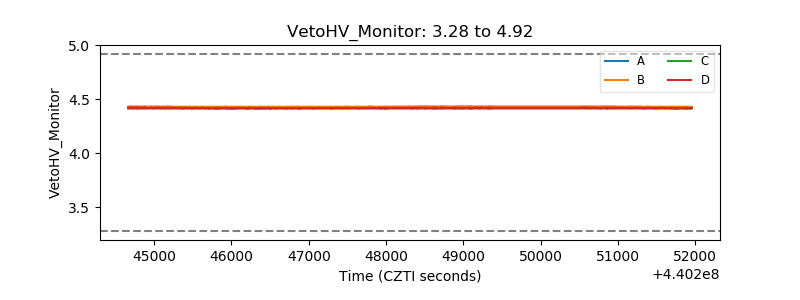 |
| Veto LLD | 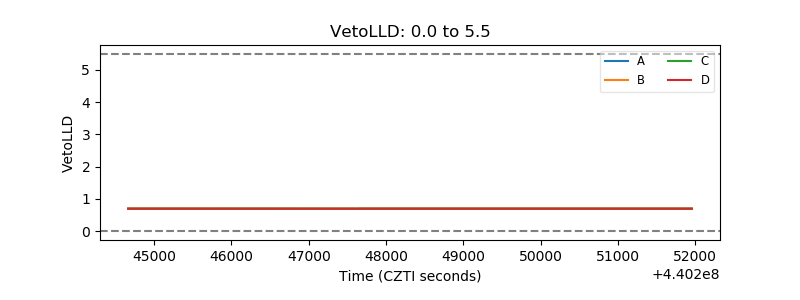 |
| Alpha Counter | 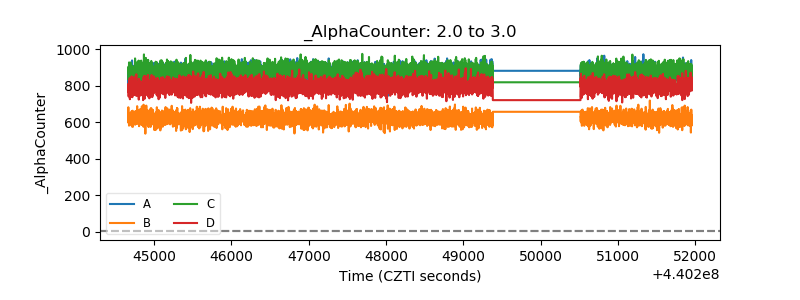 |
| _CPM_Rate | 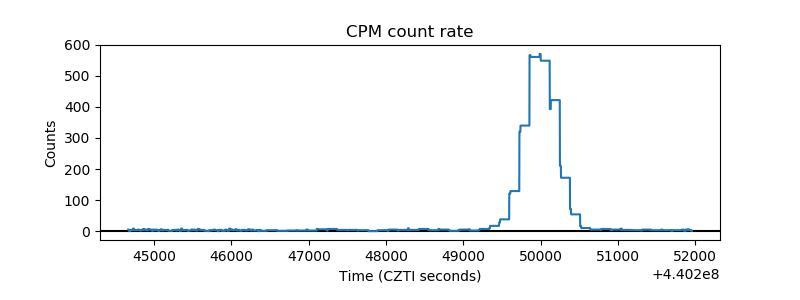 |
| CZT Counter | 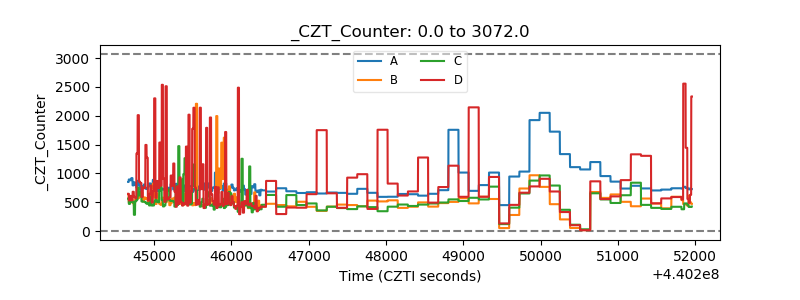 |
| +2.5 Volts monitor |  |
| +5 Volts monitor | 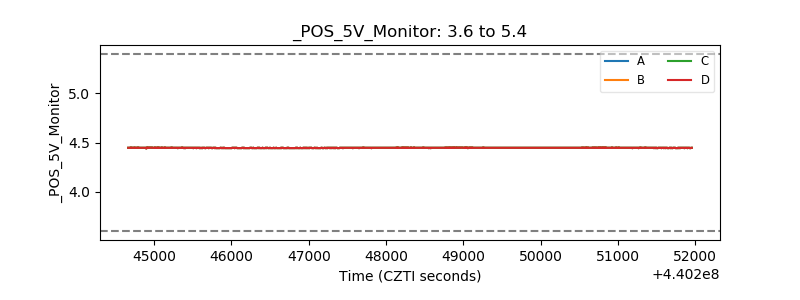 |
| _ROLL_ROT | 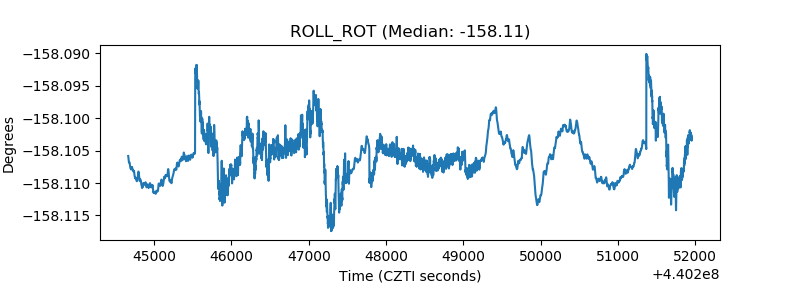 |
| _Roll_DEC | 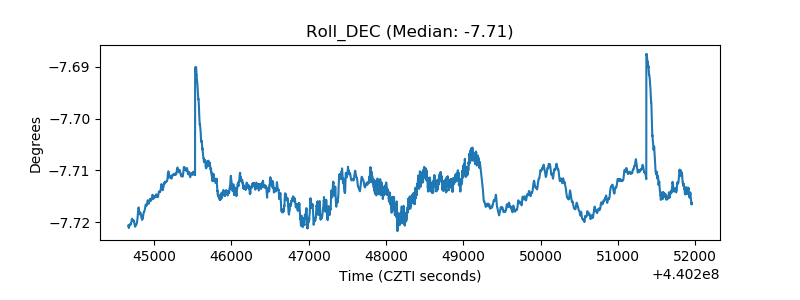 |
| _Roll_RA | 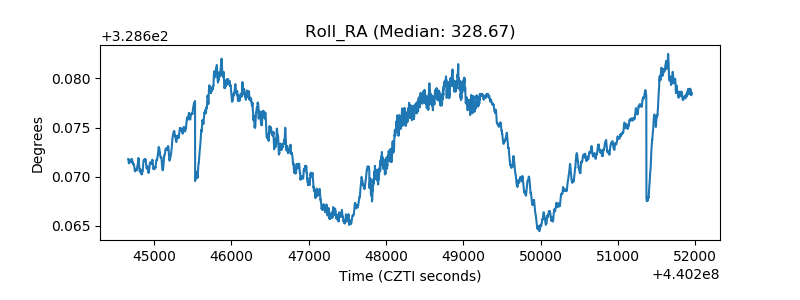 |
| Veto Counter | 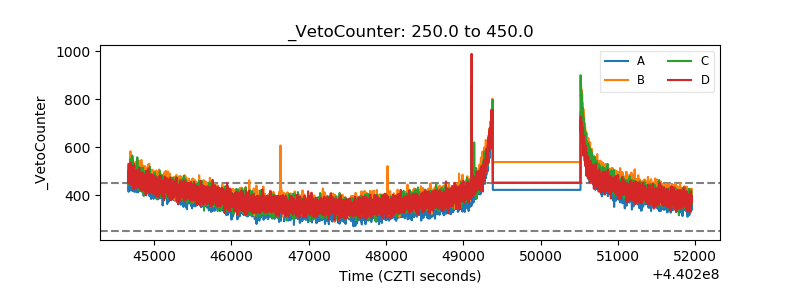 |