| Param | Original file | Final file |
|---|---|---|
| Filename | modeM0/AS1A13_008T08_9000005998_44403cztM0_level2.fits | modeM0/AS1A13_008T08_9000005998_44403cztM0_level2_quad_clean.evt |
| Size (bytes) | 545,376,960 | 106,643,520 |
| Size | 520.1 MB | 101.7 MB |
| Events in quadrant A | 4,885,217 | 738,608 |
| Events in quadrant B | 3,406,903 | 754,372 |
| Events in quadrant C | 3,382,665 | 720,808 |
| Events in quadrant D | 8,001,430 | 555,003 |
| Mode SS | |||
|---|---|---|---|
| Quadrant | BADHDUFLAG | Total packets | Discarded packets |
| A | 0 | 134 | 0 |
| B | 0 | 134 | 0 |
| C | 0 | 134 | 0 |
| D | 0 | 134 | 0 |
| Mode M0 | |||
|---|---|---|---|
| Quadrant | BADHDUFLAG | Total packets | Discarded packets |
| A | 0 | 19990 | 1 |
| B | 0 | 14518 | 1 |
| C | 0 | 14755 | 1 |
| D | 0 | 28313 | 1 |
| Mode M9 | |||
|---|---|---|---|
| Quadrant | BADHDUFLAG | Total packets | Discarded packets |
| A | 0 | 10 | 0 |
| B | 0 | 10 | 0 |
| C | 0 | 10 | 0 |
| D | 0 | 10 | 0 |
| Quadrant | Total seconds | Saturated seconds | Saturation percentage |
|---|---|---|---|
| A | 6599 | 165 | 2.500379% |
| B | 6600 | 128 | 1.939394% |
| C | 6600 | 69 | 1.045455% |
| D | 6600 | 1379 | 20.893939% |
Noise dominated data is calculated using 1-second bins in cleaned event files. If a bin has >2000 counts, and if more than 50% of those come from <1% of pixels, then it is considered to be noise-dominated and hence unusable.
| Quadrant | # 1 sec bins | Bins with >0 counts | Bins with >2000 counts | High rate bins dominated by noise | Noise dominated (total time) | Noise dominated (detector-on time) | Marked lightcurve |
|---|---|---|---|---|---|---|---|
| A | 7604 | 6600 | 6 | 6 | 0.08% | 0.09% | 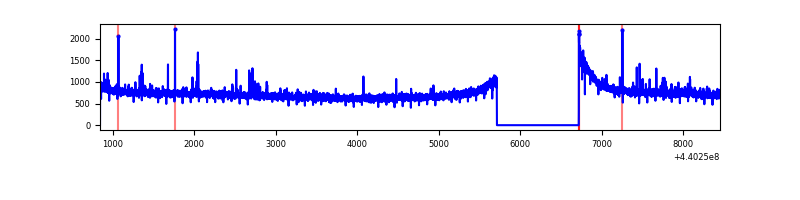 |
| B | 7605 | 6600 | 20 | 20 | 0.26% | 0.30% | 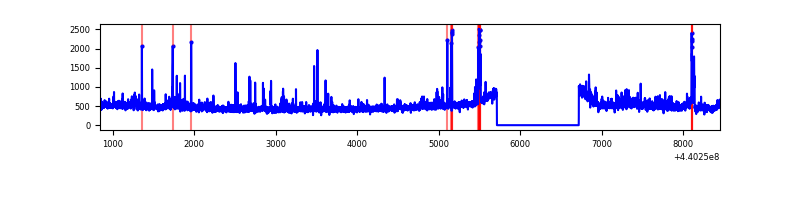 |
| C | 7605 | 6600 | 33 | 33 | 0.43% | 0.50% | 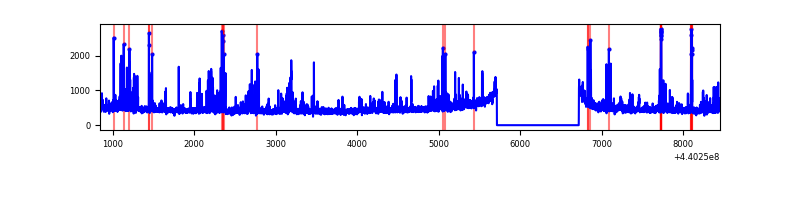 |
| D | 7605 | 6600 | 1363 | 1363 | 17.92% | 20.65% | 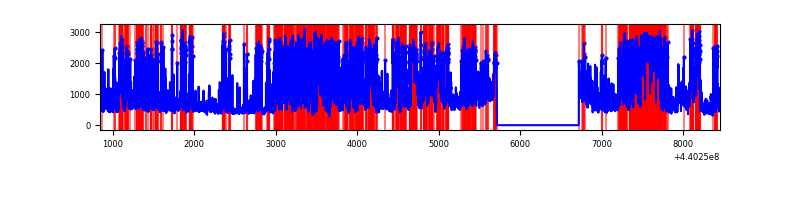 |
Top three noisy pixels from each quadrant. If the there are fewer than three noisy pixels in the level2.evt file, extra rows are filled as -1
| Pixel properties | Quadrant properties | ||||||
|---|---|---|---|---|---|---|---|
| Quadrant | DetID | PixID | Counts | Sigma | Mean | Median | Sigma |
| A | 10 | 83 | 1832175 | 11425.29 | 766 | 750 | 160.3 |
| A | 0 | 243 | 39593 | 242.32 | 766 | 750 | 160.3 |
| A | 13 | 248 | 33933 | 207.01 | 766 | 750 | 160.3 |
| B | 5 | 255 | 75981 | 496.2 | 763 | 742 | 151.6 |
| B | 0 | 155 | 66844 | 435.94 | 763 | 742 | 151.6 |
| B | 5 | 172 | 57639 | 375.23 | 763 | 742 | 151.6 |
| C | 14 | 254 | 357576 | 2019.51 | 738 | 741 | 176.7 |
| C | 3 | 233 | 86172 | 483.5 | 738 | 741 | 176.7 |
| C | 12 | 250 | 39281 | 218.12 | 738 | 741 | 176.7 |
| D | 6 | 239 | 1780656 | 10240.63 | 682 | 661 | 173.8 |
| D | 1 | 52 | 1143797 | 6576.67 | 682 | 661 | 173.8 |
| D | 4 | 221 | 690334 | 3967.81 | 682 | 661 | 173.8 |
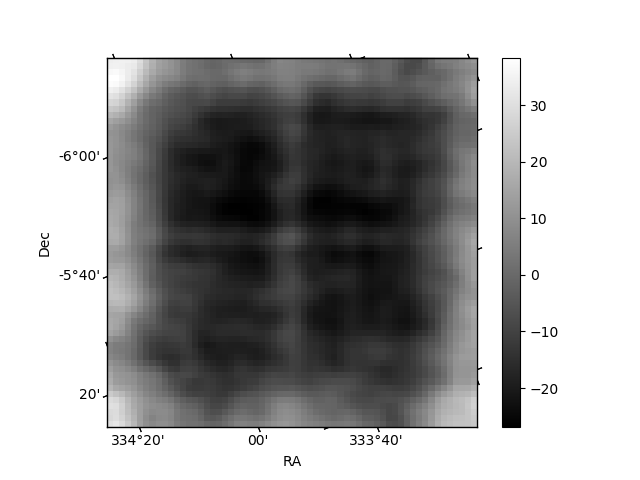
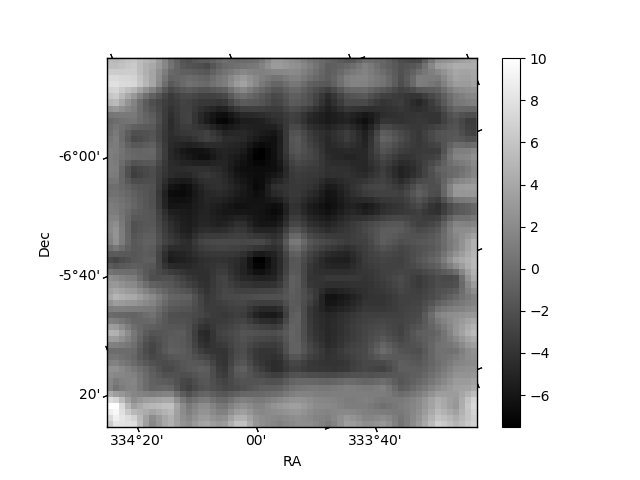
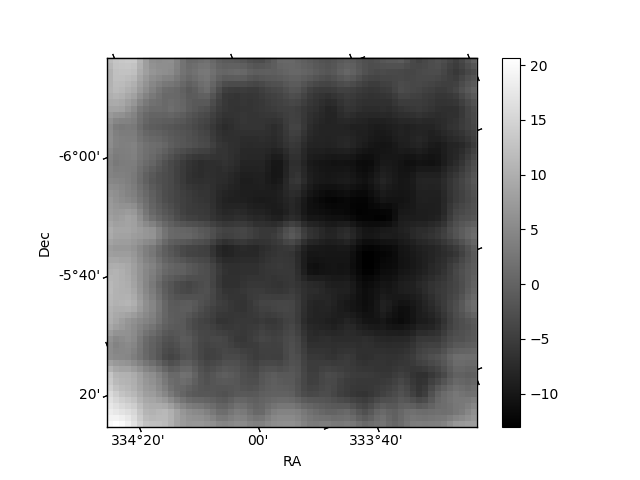
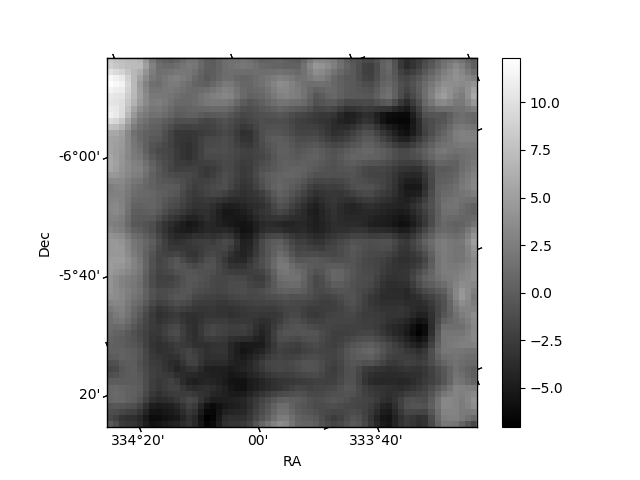
Histogram calculated using DETX and DETY for each event in the final _common_clean file
| Quadrant A | 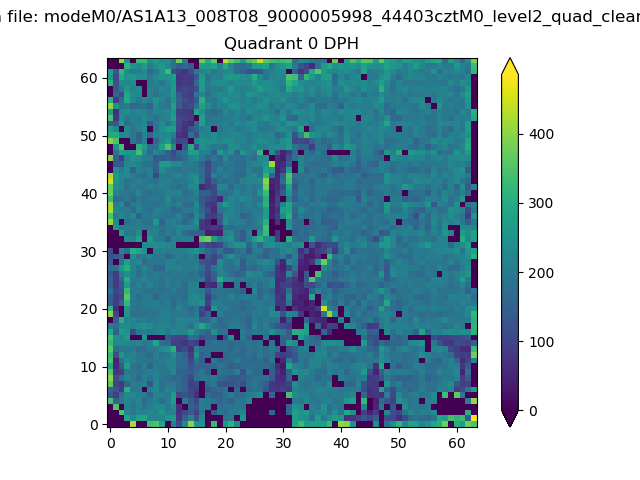 |
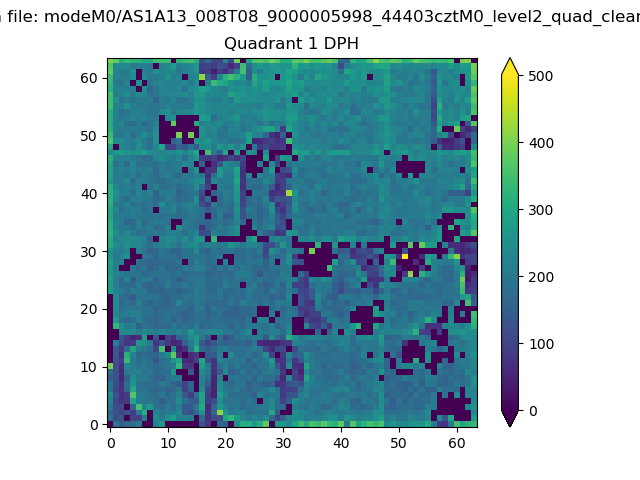 |
Quadrant B |
|---|---|---|---|
| Quadrant D | 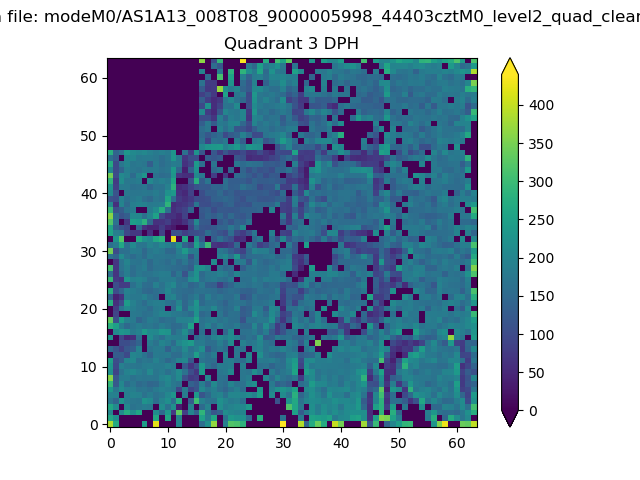 |
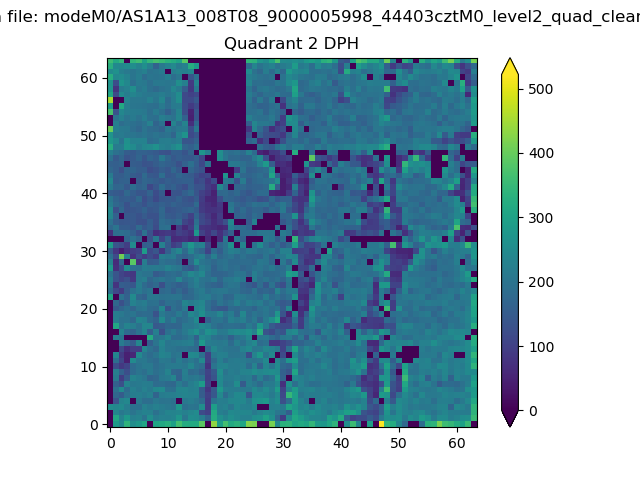 |
Quadrant C |
| Plot type | Count rate plots | Images |
|---|---|---|
| Comparison with Poisson distribution Blue bars denote a histogram of data divided into 1 sec bins. Red curve is a Poisson curve with rate = median count rate of data. |
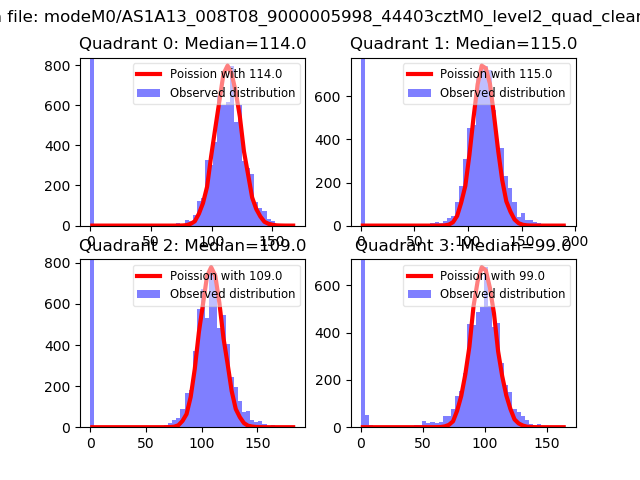 |
 |
| Quadrant-wise count rates Data is divided into 100 sec bins |
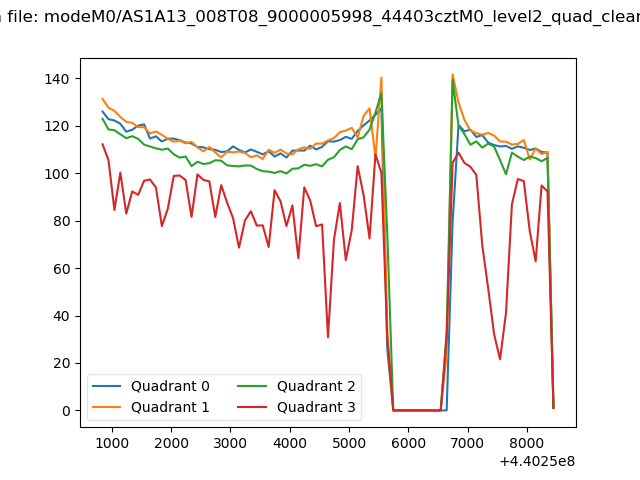 |
|
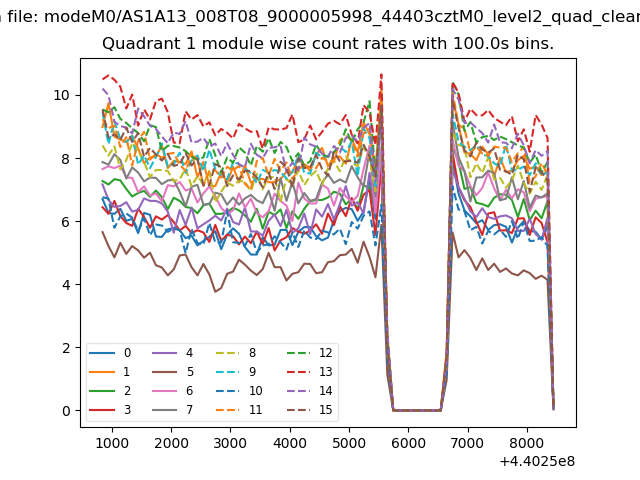
| Module-wise count rates for Quadrant A Data is divided into 100 sec bins |
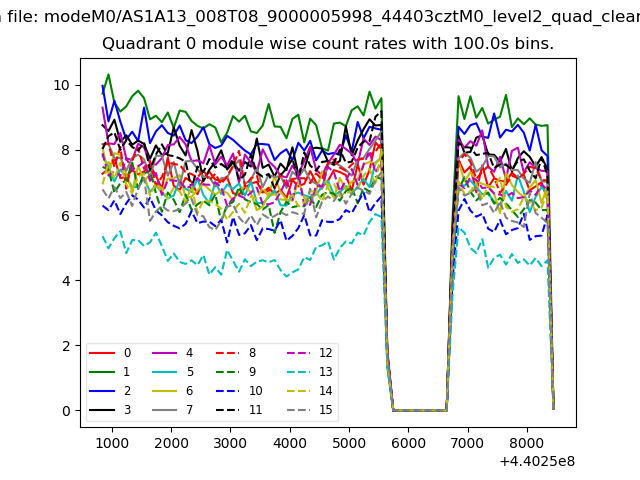 |
 |
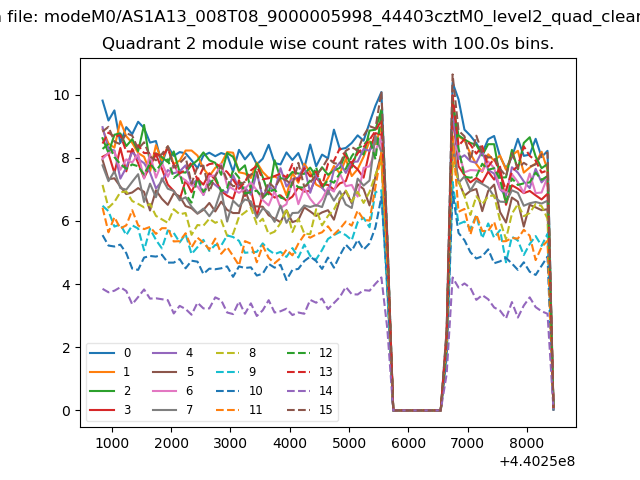
| Module-wise count rates for Quadrant B Data is divided into 100 sec bins |
 |
 |
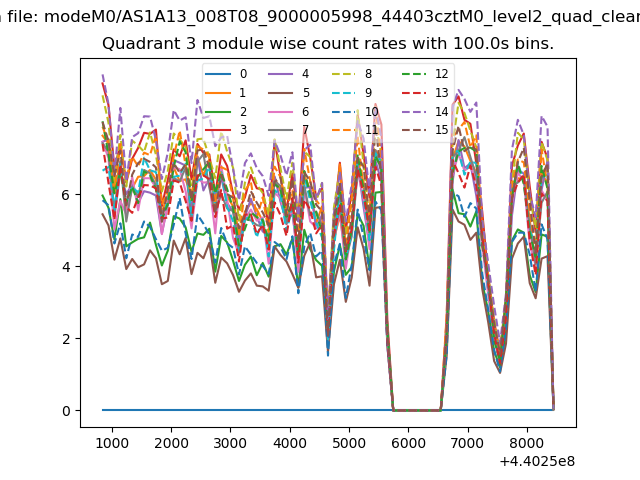
| Module-wise count rates for Quadrant C Data is divided into 100 sec bins |
 |
 |
| Module-wise count rates for Quadrant D Data is divided into 100 sec bins |
 |
 |
| Parameter | Plot |
|---|---|
| CZT HV Monitor | 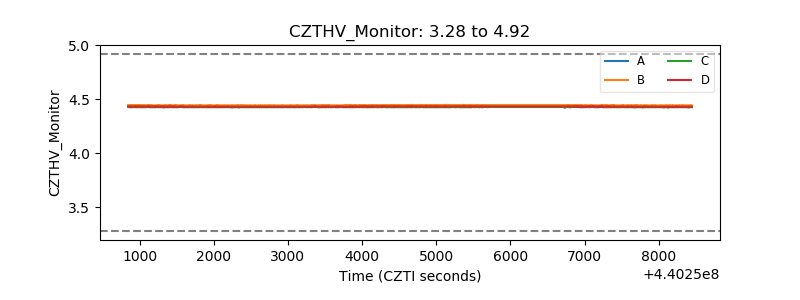 |
| D_VDD | 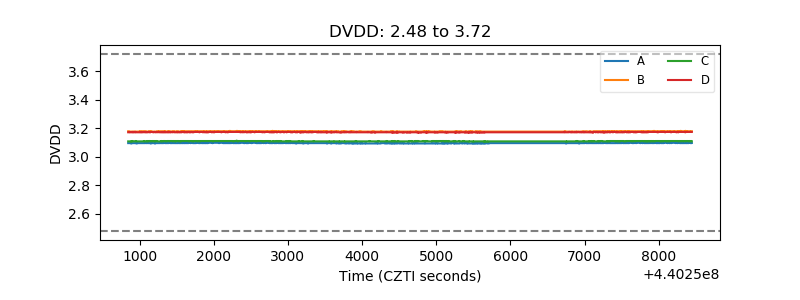 |
| Temperature 1 | 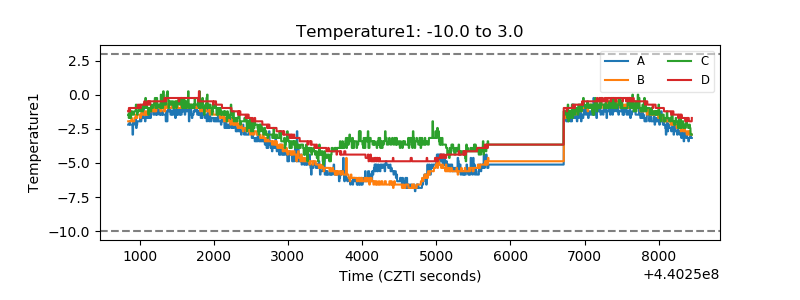 |
| Veto HV Monitor | 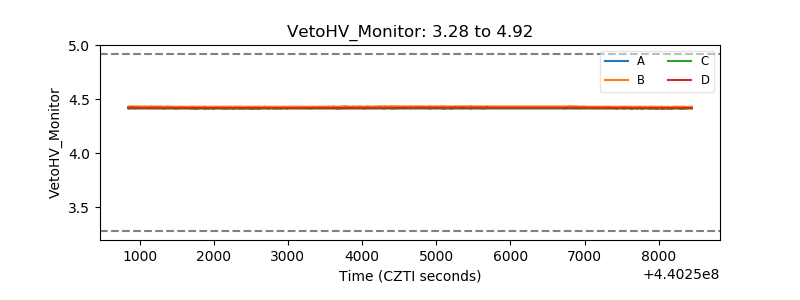 |
| Veto LLD | 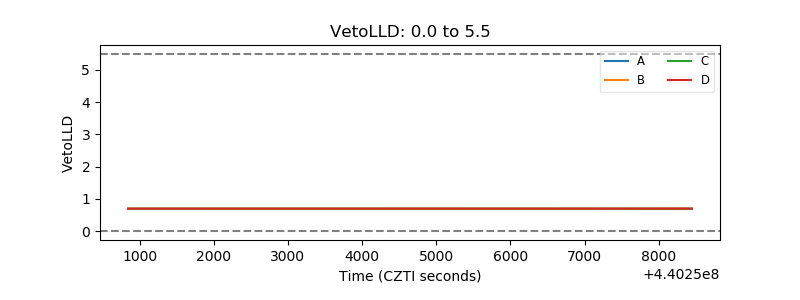 |
| Alpha Counter | 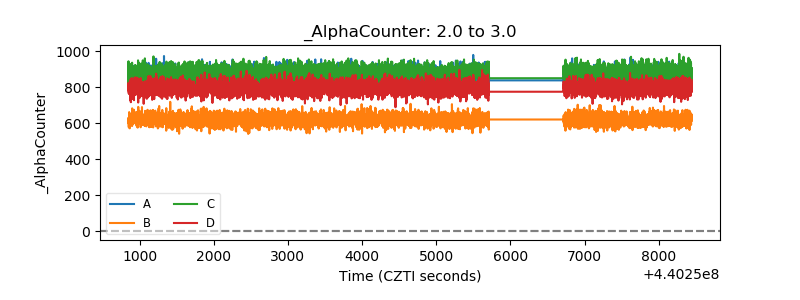 |
| _CPM_Rate | 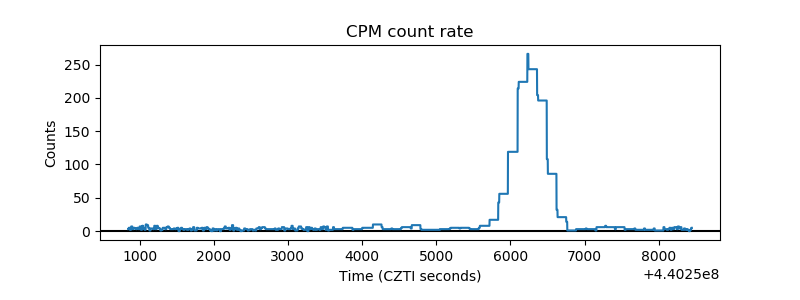 |
| CZT Counter | 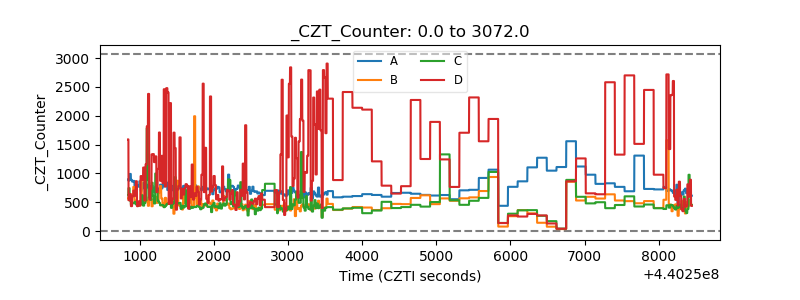 |
| +2.5 Volts monitor | 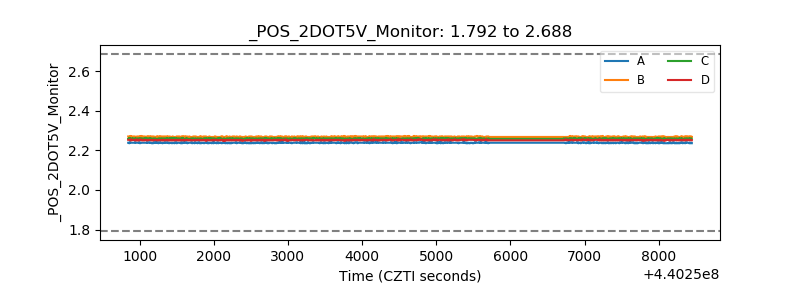 |
| +5 Volts monitor | 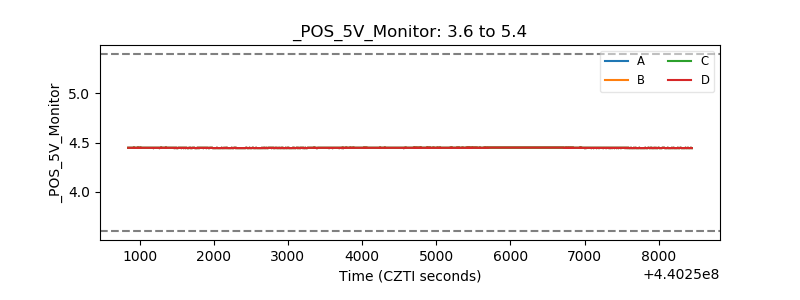 |
| _ROLL_ROT | 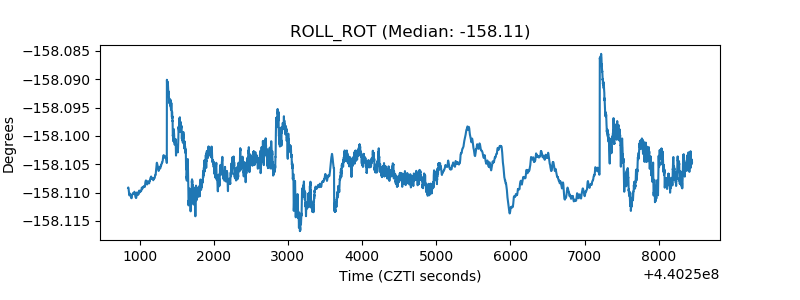 |
| _Roll_DEC | 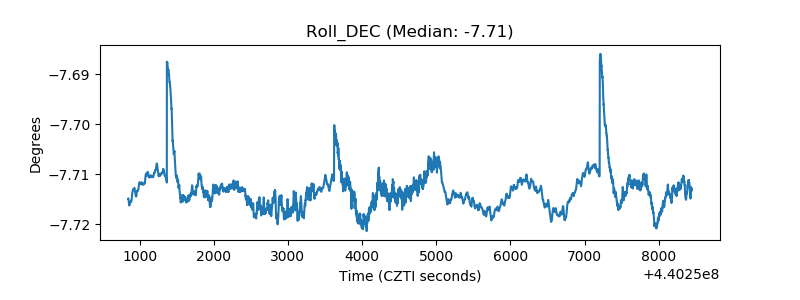 |
| _Roll_RA | 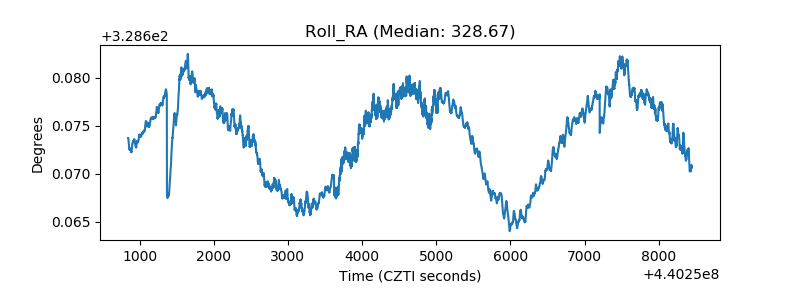 |
| Veto Counter | 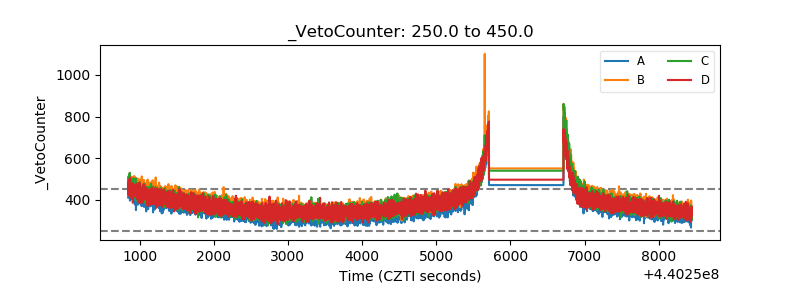 |