| Param | Original file | Final file |
|---|---|---|
| Filename | modeM0/AS1A13_008T08_9000005998_44404cztM0_level2.fits | modeM0/AS1A13_008T08_9000005998_44404cztM0_level2_quad_clean.evt |
| Size (bytes) | 504,262,080 | 98,562,240 |
| Size | 480.9 MB | 94.0 MB |
| Events in quadrant A | 4,583,294 | 665,804 |
| Events in quadrant B | 3,614,976 | 681,362 |
| Events in quadrant C | 3,254,466 | 660,299 |
| Events in quadrant D | 6,728,658 | 540,391 |
| Mode SS | |||
|---|---|---|---|
| Quadrant | BADHDUFLAG | Total packets | Discarded packets |
| A | 0 | 128 | 0 |
| B | 0 | 128 | 0 |
| C | 0 | 128 | 0 |
| D | 0 | 128 | 0 |
| Mode M0 | |||
|---|---|---|---|
| Quadrant | BADHDUFLAG | Total packets | Discarded packets |
| A | 0 | 18871 | 2 |
| B | 0 | 15039 | 1 |
| C | 0 | 14135 | 1 |
| D | 0 | 24273 | 1 |
| Mode M9 | |||
|---|---|---|---|
| Quadrant | BADHDUFLAG | Total packets | Discarded packets |
| A | 0 | 7 | 0 |
| B | 0 | 7 | 0 |
| C | 0 | 7 | 0 |
| D | 0 | 7 | 0 |
| Quadrant | Total seconds | Saturated seconds | Saturation percentage |
|---|---|---|---|
| A | 6246 | 193 | 3.089978% |
| B | 6247 | 211 | 3.377621% |
| C | 6247 | 86 | 1.376661% |
| D | 6247 | 948 | 15.175284% |
Noise dominated data is calculated using 1-second bins in cleaned event files. If a bin has >2000 counts, and if more than 50% of those come from <1% of pixels, then it is considered to be noise-dominated and hence unusable.
| Quadrant | # 1 sec bins | Bins with >0 counts | Bins with >2000 counts | High rate bins dominated by noise | Noise dominated (total time) | Noise dominated (detector-on time) | Marked lightcurve |
|---|---|---|---|---|---|---|---|
| A | 6976 | 6247 | 21 | 21 | 0.30% | 0.34% | 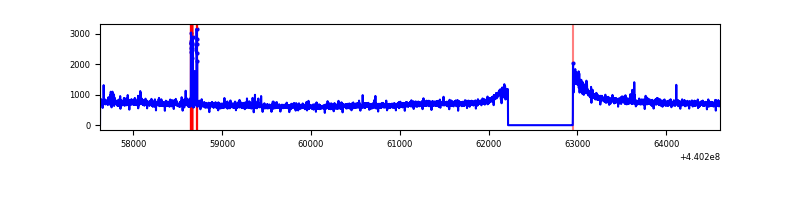 |
| B | 6977 | 6247 | 95 | 95 | 1.36% | 1.52% | 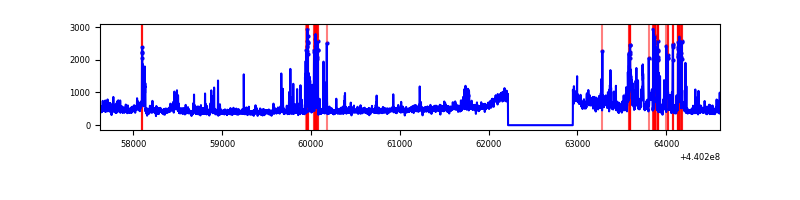 |
| C | 6977 | 6248 | 36 | 36 | 0.52% | 0.58% | 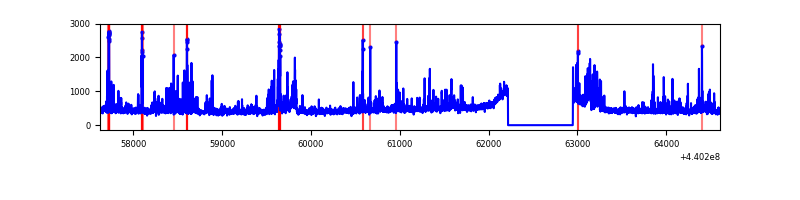 |
| D | 6977 | 6247 | 933 | 933 | 13.37% | 14.94% | 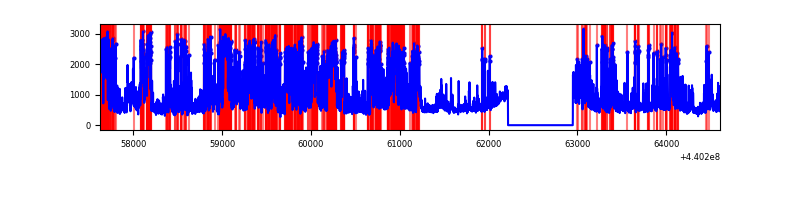 |
Top three noisy pixels from each quadrant. If the there are fewer than three noisy pixels in the level2.evt file, extra rows are filled as -1
| Pixel properties | Quadrant properties | ||||||
|---|---|---|---|---|---|---|---|
| Quadrant | DetID | PixID | Counts | Sigma | Mean | Median | Sigma |
| A | 10 | 83 | 1717870 | 11348.65 | 711 | 695 | 151.3 |
| A | 13 | 248 | 71968 | 471.04 | 711 | 695 | 151.3 |
| A | 0 | 243 | 33589 | 217.39 | 711 | 695 | 151.3 |
| B | 5 | 172 | 375060 | 2628.78 | 707 | 687 | 142.4 |
| B | 5 | 255 | 113756 | 793.95 | 707 | 687 | 142.4 |
| B | 5 | 235 | 78201 | 544.29 | 707 | 687 | 142.4 |
| C | 14 | 254 | 280716 | 1699.16 | 691 | 695 | 164.8 |
| C | 3 | 233 | 139034 | 839.44 | 691 | 695 | 164.8 |
| C | 2 | 14 | 77390 | 465.38 | 691 | 695 | 164.8 |
| D | 4 | 221 | 984267 | 5942.24 | 654 | 635 | 165.5 |
| D | 1 | 52 | 741035 | 4472.85 | 654 | 635 | 165.5 |
| D | 6 | 239 | 656723 | 3963.51 | 654 | 635 | 165.5 |
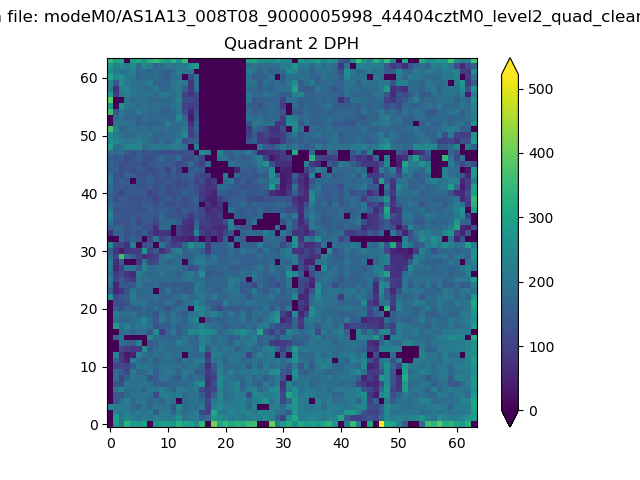
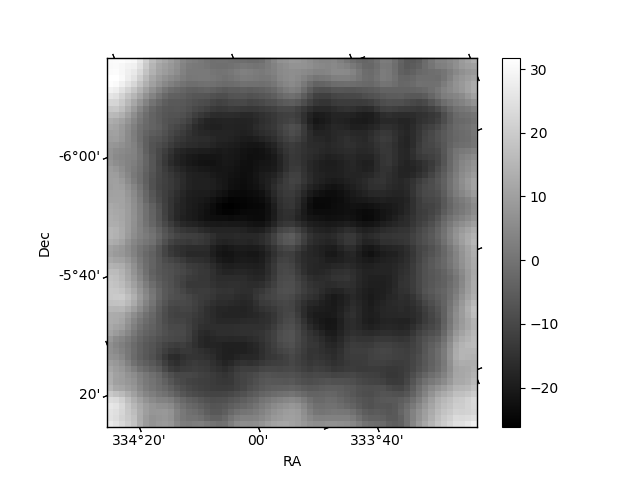
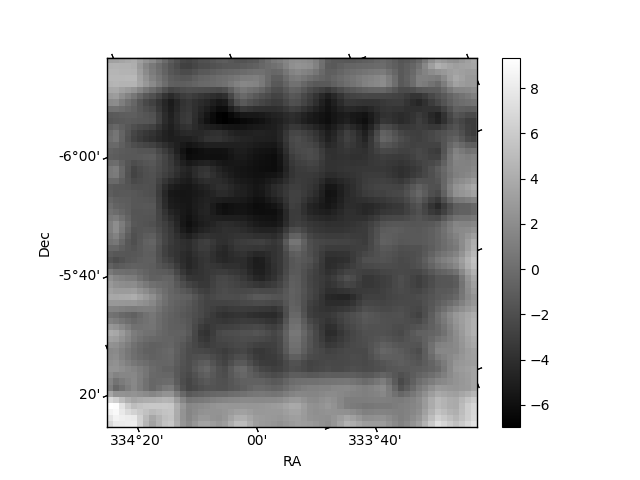
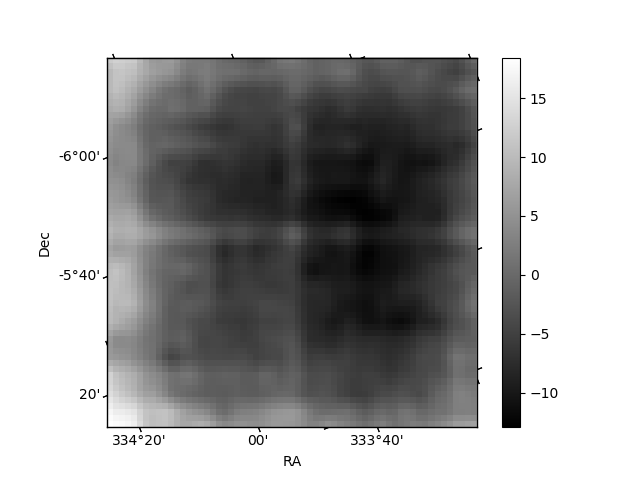
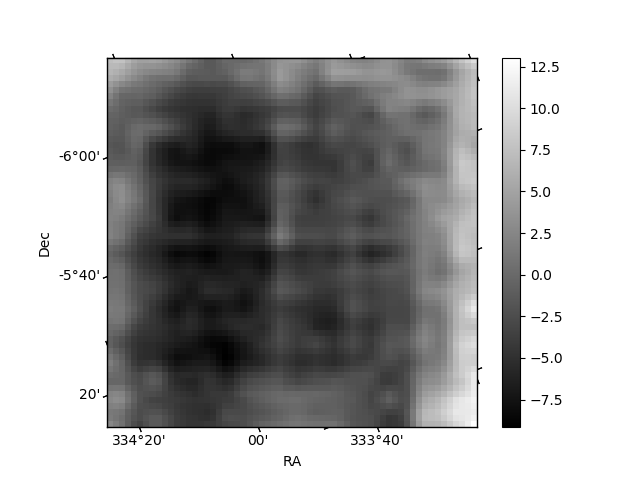
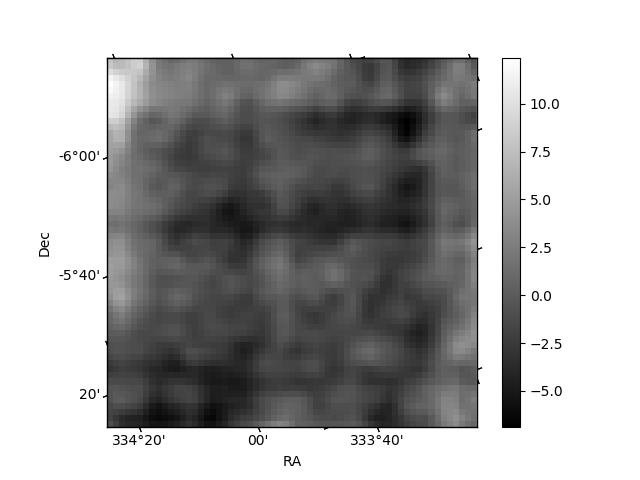
Histogram calculated using DETX and DETY for each event in the final _common_clean file
| Quadrant A | 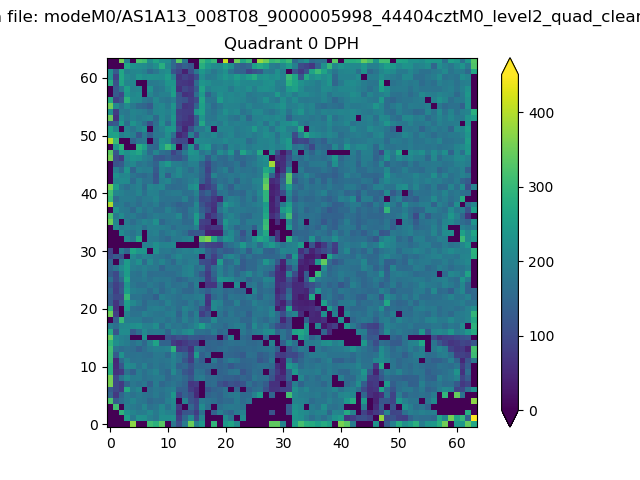 |
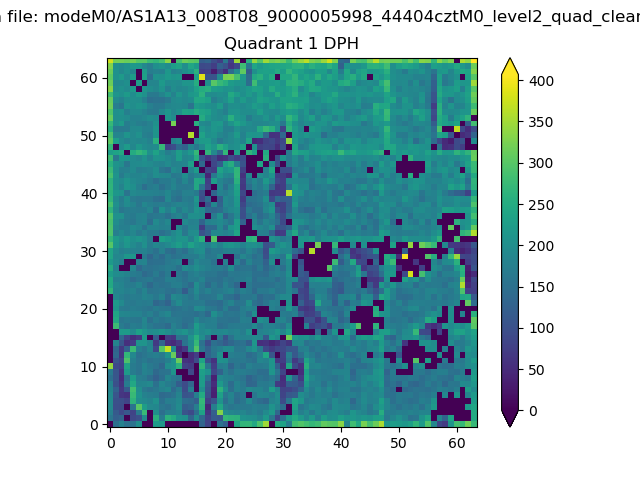 |
Quadrant B |
|---|---|---|---|
| Quadrant D | 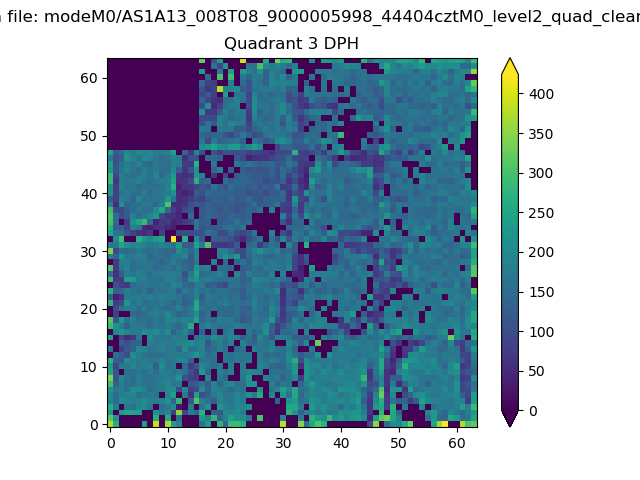 |
 |
Quadrant C |
| Plot type | Count rate plots | Images |
|---|---|---|
| Comparison with Poisson distribution Blue bars denote a histogram of data divided into 1 sec bins. Red curve is a Poisson curve with rate = median count rate of data. |
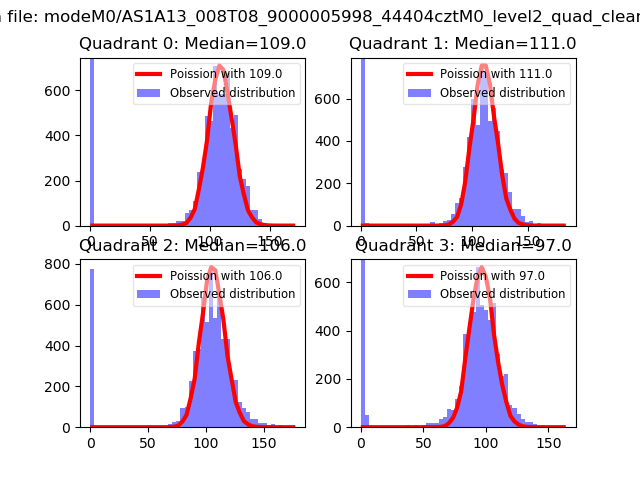 |
 |
| Quadrant-wise count rates Data is divided into 100 sec bins |
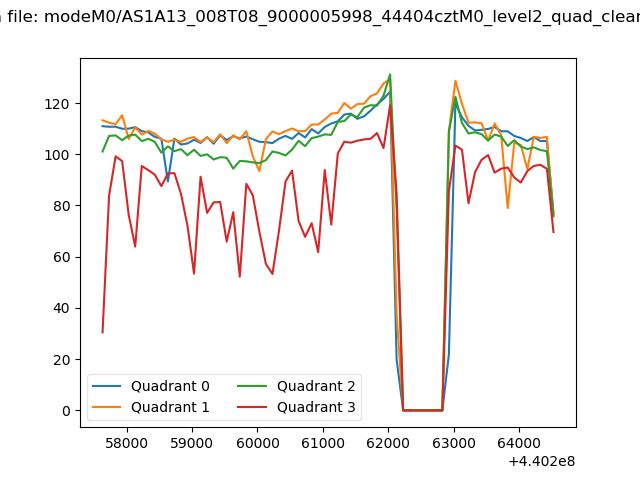 |
|
| Module-wise count rates for Quadrant A Data is divided into 100 sec bins |
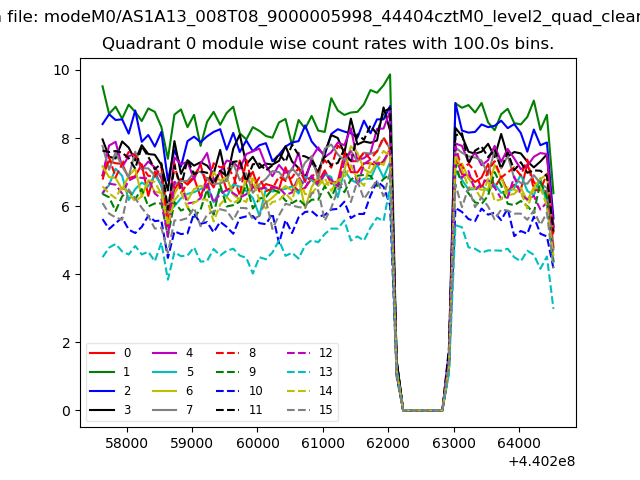 |
 |
| Module-wise count rates for Quadrant B Data is divided into 100 sec bins |
 |
 |
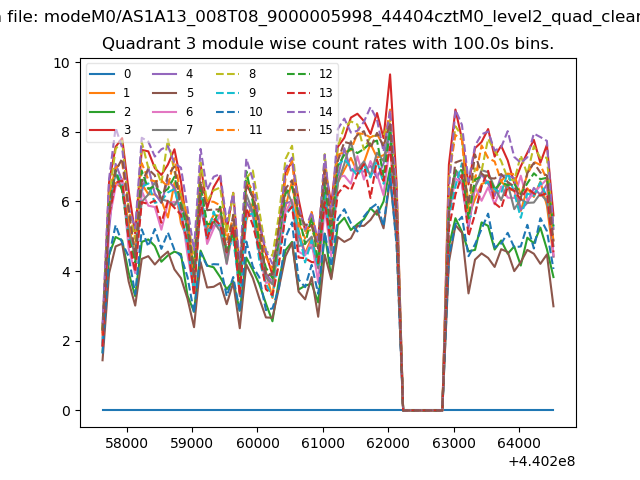
| Module-wise count rates for Quadrant C Data is divided into 100 sec bins |
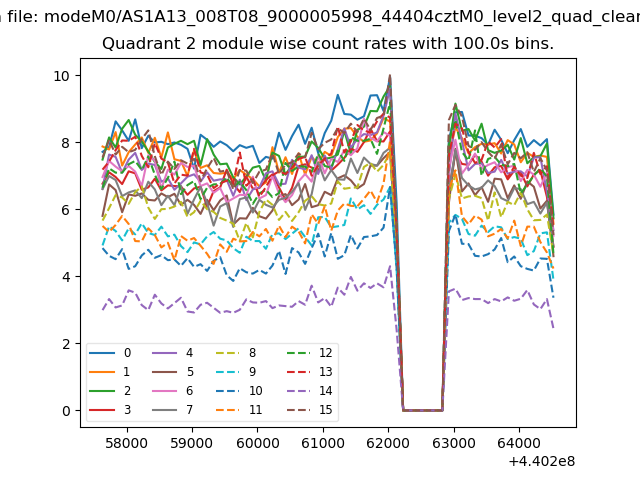 |
 |
| Module-wise count rates for Quadrant D Data is divided into 100 sec bins |
 |
 |
| Parameter | Plot |
|---|---|
| CZT HV Monitor | 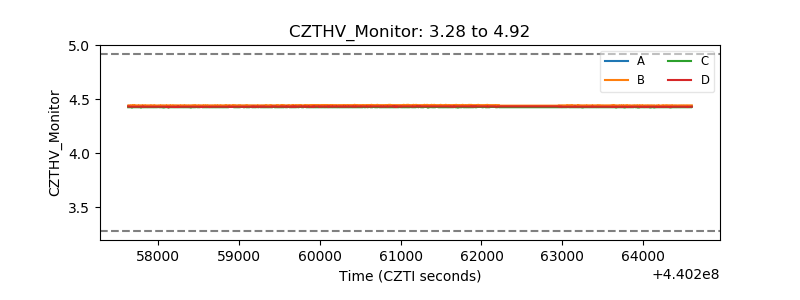 |
| D_VDD | 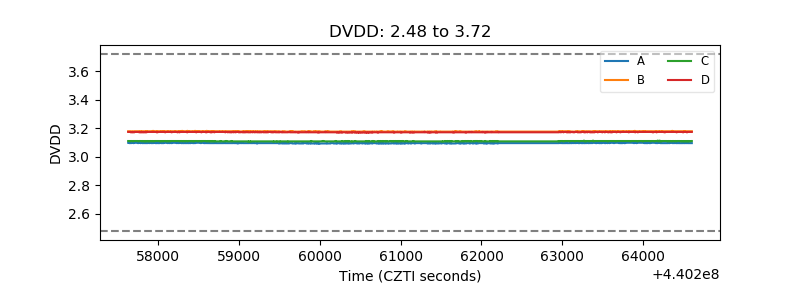 |
| Temperature 1 | 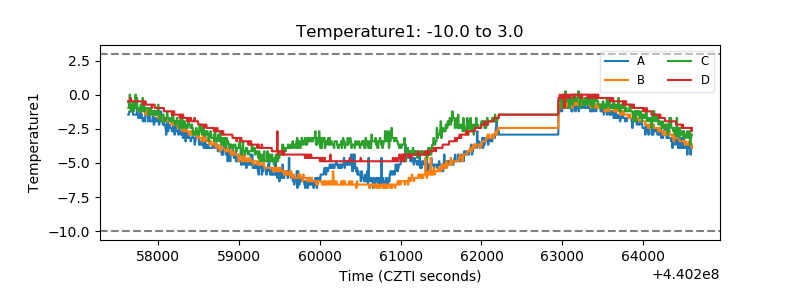 |
| Veto HV Monitor | 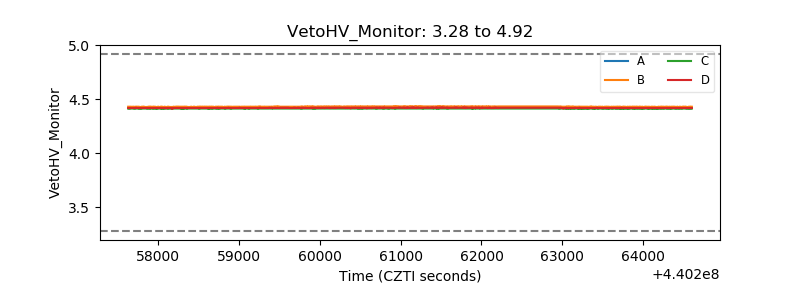 |
| Veto LLD | 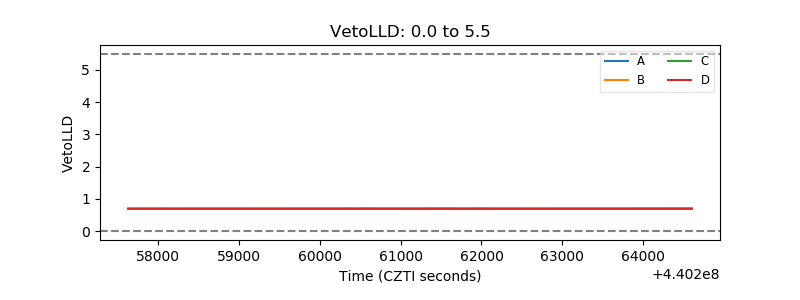 |
| Alpha Counter | 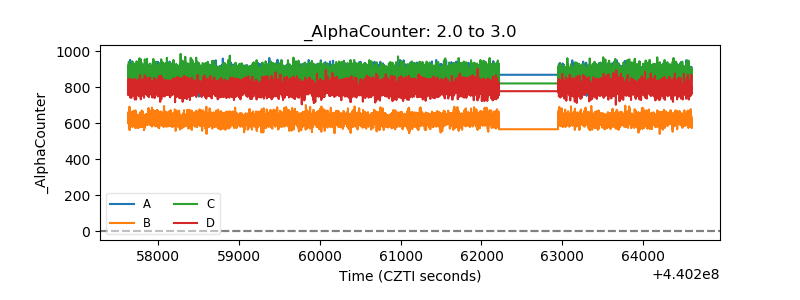 |
| _CPM_Rate | 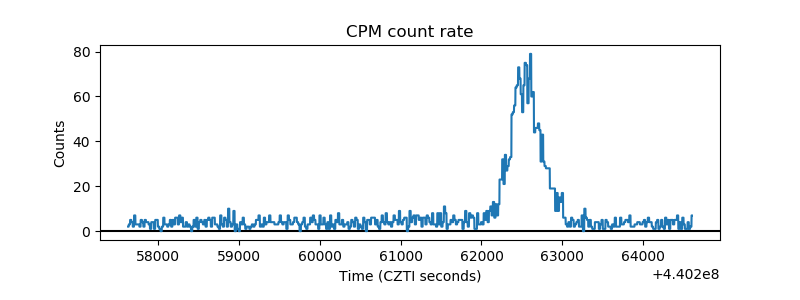 |
| CZT Counter | 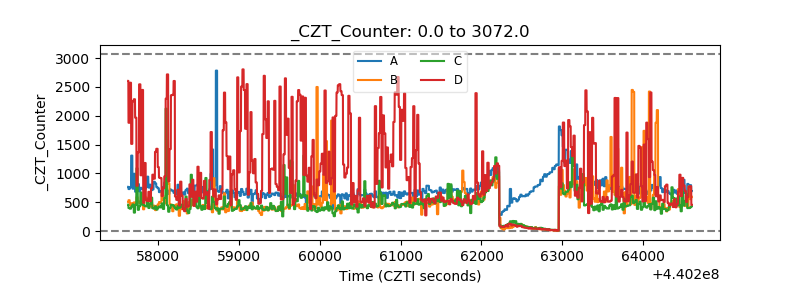 |
| +2.5 Volts monitor | 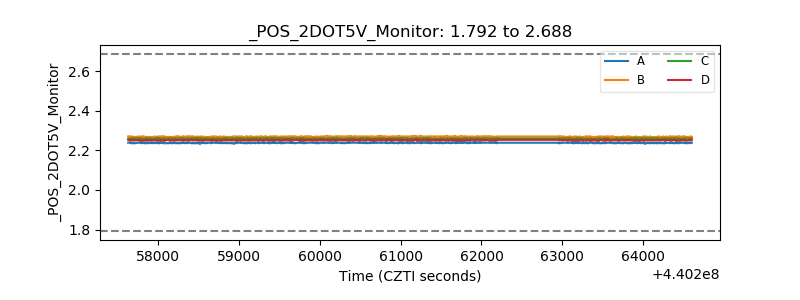 |
| +5 Volts monitor | 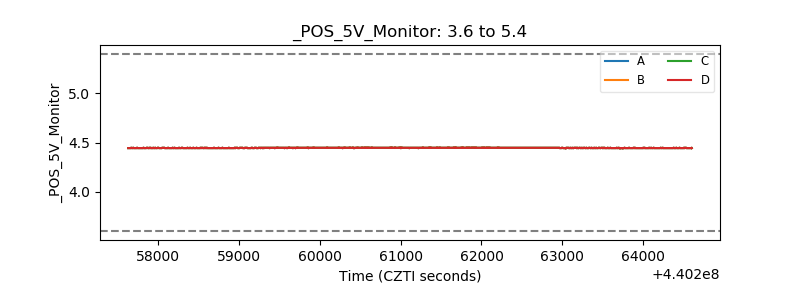 |
| _ROLL_ROT | 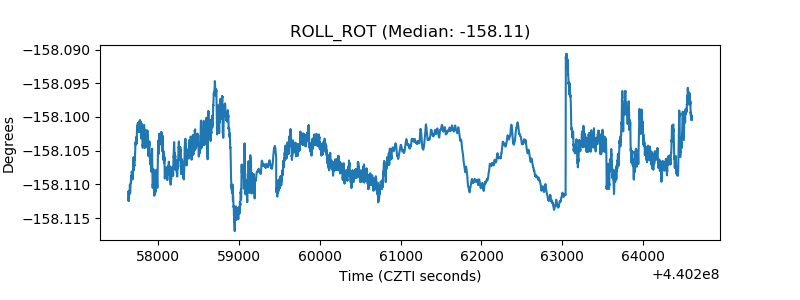 |
| _Roll_DEC | 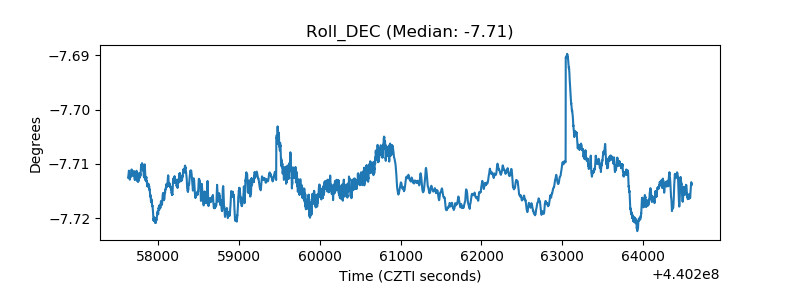 |
| _Roll_RA | 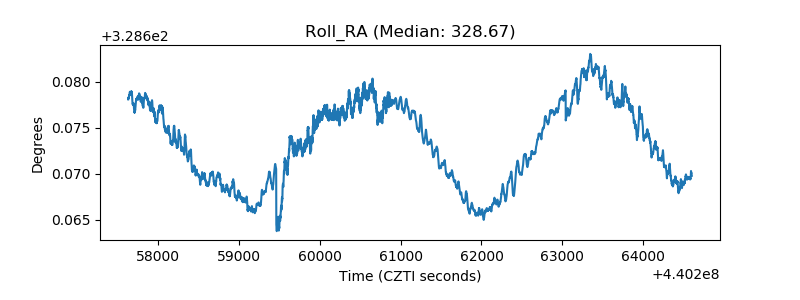 |
| Veto Counter | 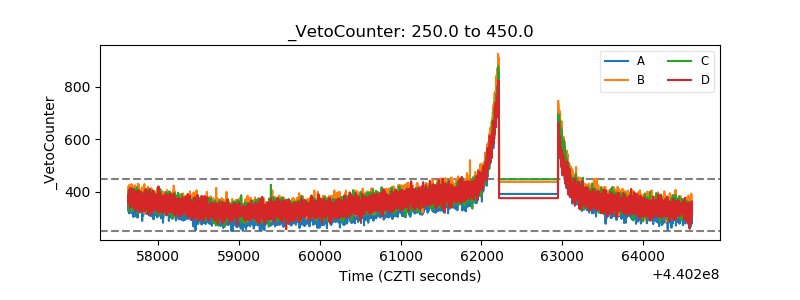 |