| Param | Original file | Final file |
|---|---|---|
| Filename | modeM0/AS1A13_008T08_9000005998_44405cztM0_level2.fits | modeM0/AS1A13_008T08_9000005998_44405cztM0_level2_quad_clean.evt |
| Size (bytes) | 556,908,480 | 108,774,720 |
| Size | 531.1 MB | 103.7 MB |
| Events in quadrant A | 4,998,518 | 743,504 |
| Events in quadrant B | 4,125,032 | 748,898 |
| Events in quadrant C | 3,424,783 | 728,845 |
| Events in quadrant D | 7,530,420 | 590,715 |
| Mode SS | |||
|---|---|---|---|
| Quadrant | BADHDUFLAG | Total packets | Discarded packets |
| A | 0 | 142 | 0 |
| B | 0 | 142 | 0 |
| C | 0 | 142 | 0 |
| D | 0 | 142 | 0 |
| Mode M0 | |||
|---|---|---|---|
| Quadrant | BADHDUFLAG | Total packets | Discarded packets |
| A | 0 | 20566 | 2 |
| B | 0 | 16948 | 2 |
| C | 0 | 15114 | 2 |
| D | 0 | 27118 | 2 |
| Mode M9 | |||
|---|---|---|---|
| Quadrant | BADHDUFLAG | Total packets | Discarded packets |
| A | 0 | 3 | 0 |
| B | 0 | 3 | 0 |
| C | 0 | 3 | 0 |
| D | 0 | 3 | 0 |
| Quadrant | Total seconds | Saturated seconds | Saturation percentage |
|---|---|---|---|
| A | 6911 | 163 | 2.358559% |
| B | 6912 | 280 | 4.050926% |
| C | 6912 | 74 | 1.070602% |
| D | 6912 | 1124 | 16.261574% |
Noise dominated data is calculated using 1-second bins in cleaned event files. If a bin has >2000 counts, and if more than 50% of those come from <1% of pixels, then it is considered to be noise-dominated and hence unusable.
| Quadrant | # 1 sec bins | Bins with >0 counts | Bins with >2000 counts | High rate bins dominated by noise | Noise dominated (total time) | Noise dominated (detector-on time) | Marked lightcurve |
|---|---|---|---|---|---|---|---|
| A | 7126 | 6914 | 9 | 9 | 0.13% | 0.13% | 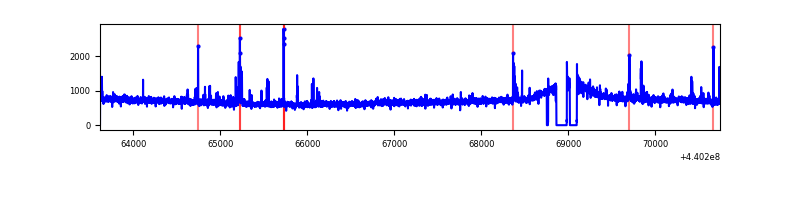 |
| B | 7127 | 6915 | 117 | 117 | 1.64% | 1.69% | 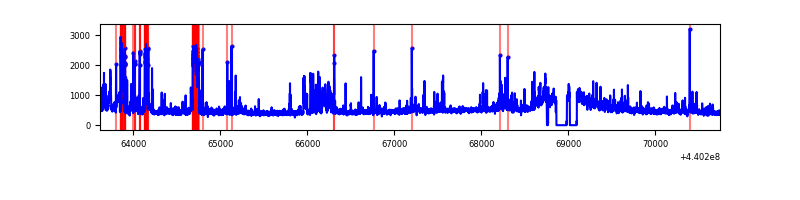 |
| C | 7127 | 6915 | 17 | 17 | 0.24% | 0.25% | 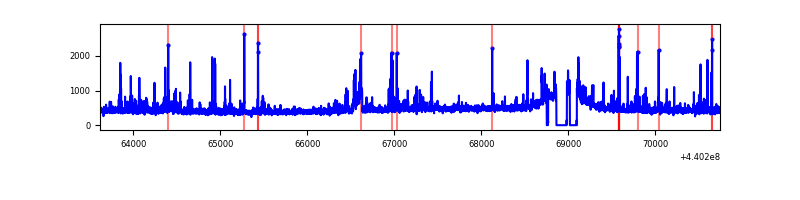 |
| D | 7127 | 6915 | 1060 | 1060 | 14.87% | 15.33% | 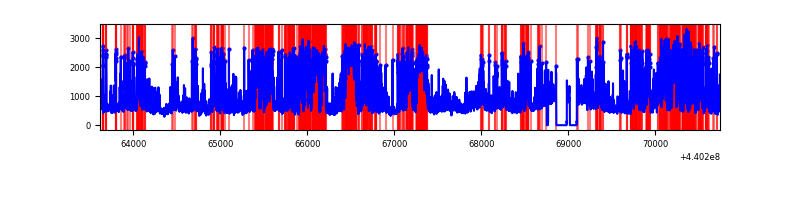 |
Top three noisy pixels from each quadrant. If the there are fewer than three noisy pixels in the level2.evt file, extra rows are filled as -1
| Pixel properties | Quadrant properties | ||||||
|---|---|---|---|---|---|---|---|
| Quadrant | DetID | PixID | Counts | Sigma | Mean | Median | Sigma |
| A | 10 | 83 | 1782528 | 10703.91 | 789 | 773 | 166.5 |
| A | 13 | 248 | 82013 | 488.05 | 789 | 773 | 166.5 |
| A | 0 | 243 | 46832 | 276.7 | 789 | 773 | 166.5 |
| B | 5 | 235 | 419637 | 2648.82 | 788 | 764 | 158.1 |
| B | 5 | 172 | 271410 | 1711.48 | 788 | 764 | 158.1 |
| B | 0 | 229 | 79133 | 495.58 | 788 | 764 | 158.1 |
| C | 14 | 254 | 263049 | 1430.25 | 770 | 776 | 183.4 |
| C | 3 | 233 | 120314 | 651.87 | 770 | 776 | 183.4 |
| C | 1 | 3 | 15784 | 81.84 | 770 | 776 | 183.4 |
| D | 4 | 221 | 1406122 | 7531.33 | 727 | 701 | 186.6 |
| D | 5 | 222 | 945817 | 5064.66 | 727 | 701 | 186.6 |
| D | 2 | 249 | 592936 | 3173.65 | 727 | 701 | 186.6 |
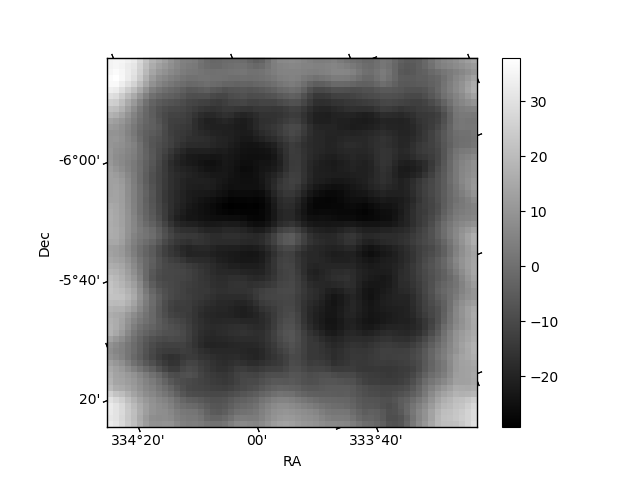
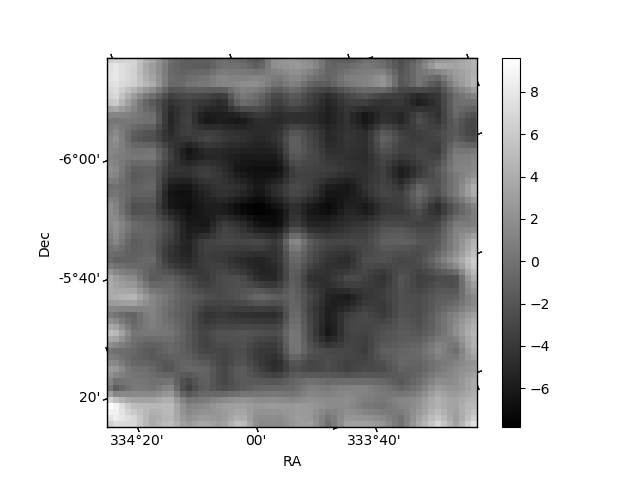
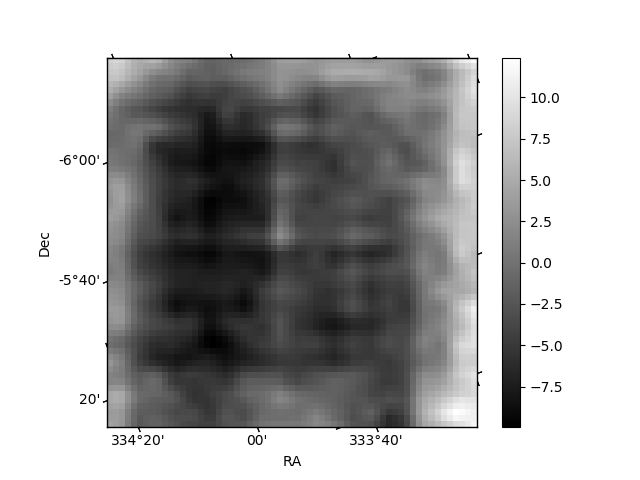
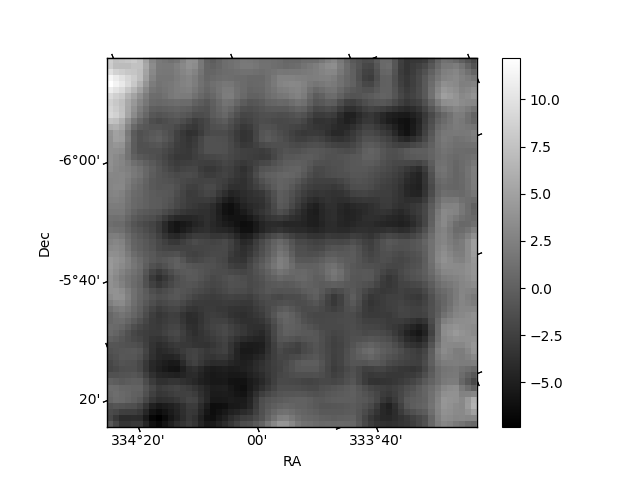
Histogram calculated using DETX and DETY for each event in the final _common_clean file
| Quadrant A | 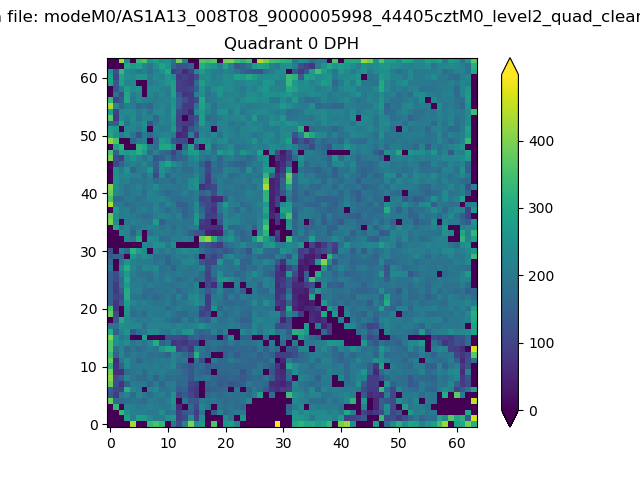 |
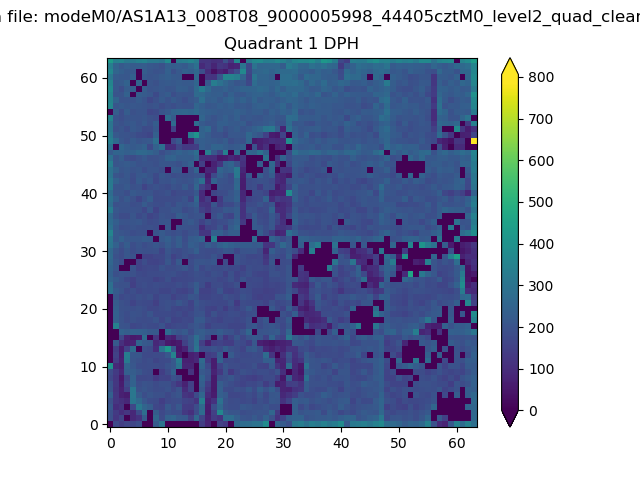 |
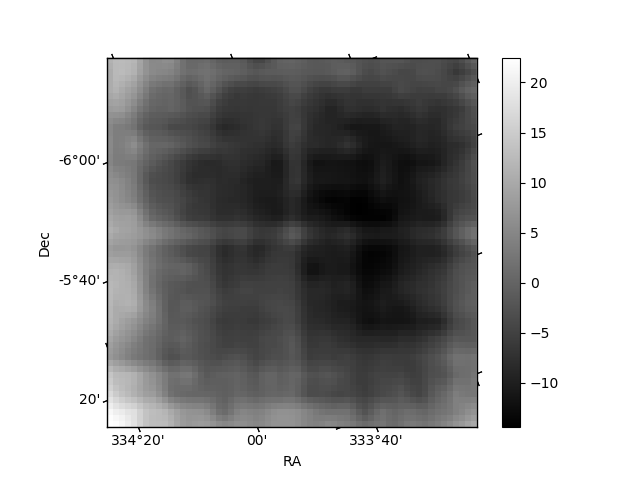
Quadrant B |
|---|---|---|---|
| Quadrant D | 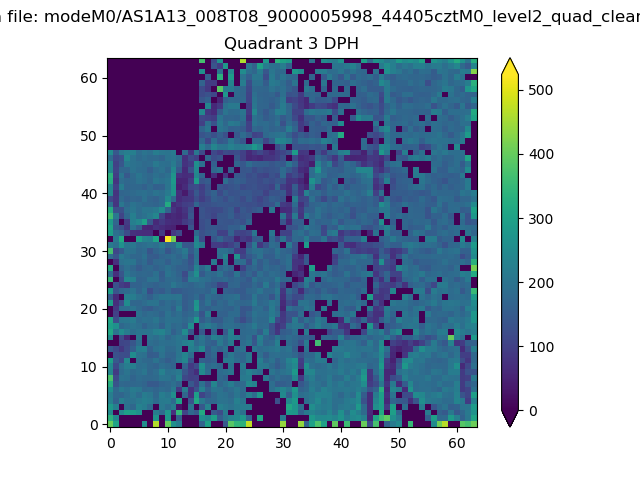 |
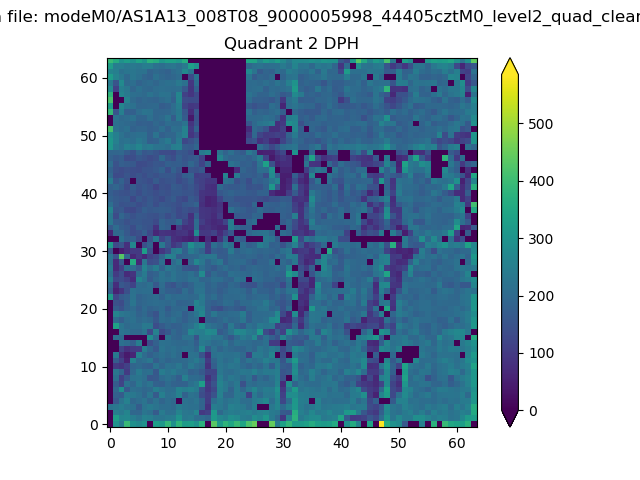 |
Quadrant C |
| Plot type | Count rate plots | Images |
|---|---|---|
| Comparison with Poisson distribution Blue bars denote a histogram of data divided into 1 sec bins. Red curve is a Poisson curve with rate = median count rate of data. |
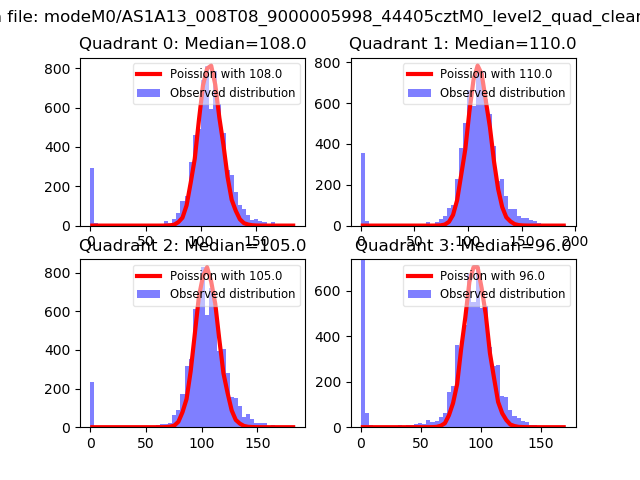 |
 |
| Quadrant-wise count rates Data is divided into 100 sec bins |
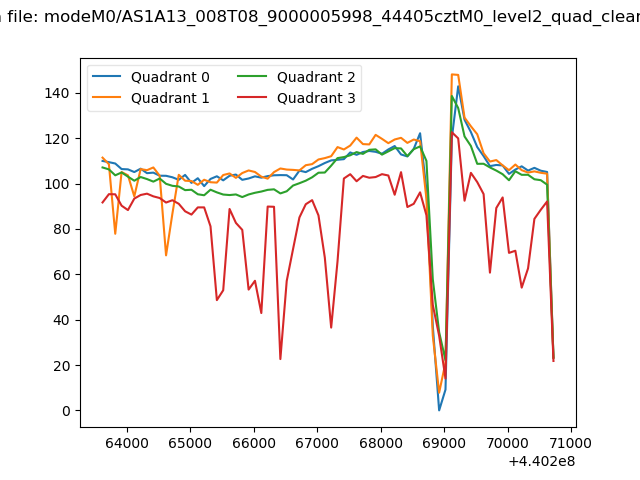 |
|
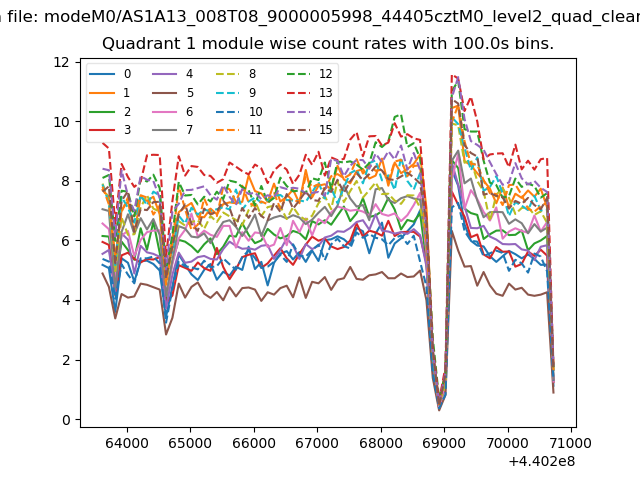
| Module-wise count rates for Quadrant A Data is divided into 100 sec bins |
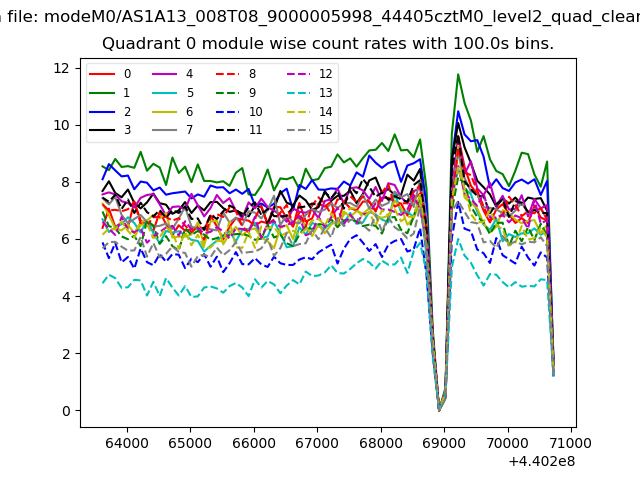 |
 |
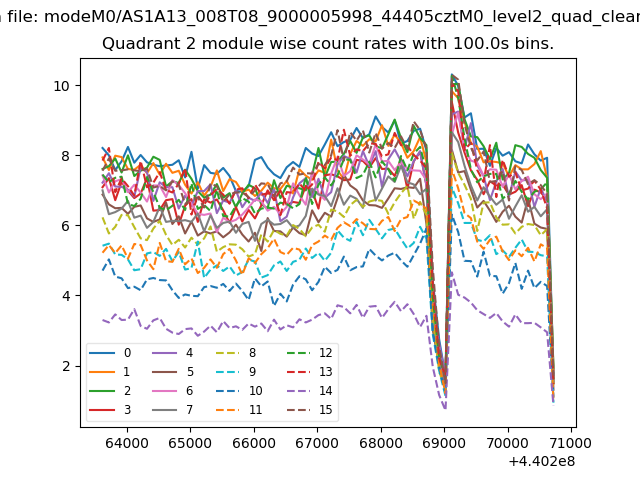
| Module-wise count rates for Quadrant B Data is divided into 100 sec bins |
 |
 |
| Module-wise count rates for Quadrant C Data is divided into 100 sec bins |
 |
 |
| Module-wise count rates for Quadrant D Data is divided into 100 sec bins |
 |
 |
| Parameter | Plot |
|---|---|
| CZT HV Monitor | 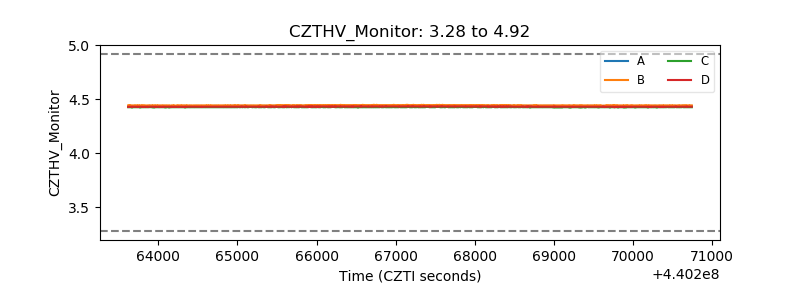 |
| D_VDD | 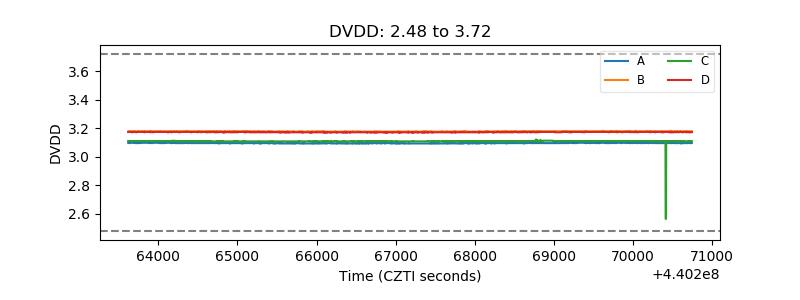 |
| Temperature 1 | 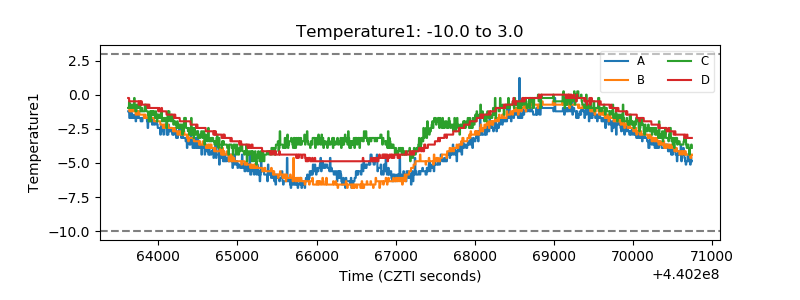 |
| Veto HV Monitor | 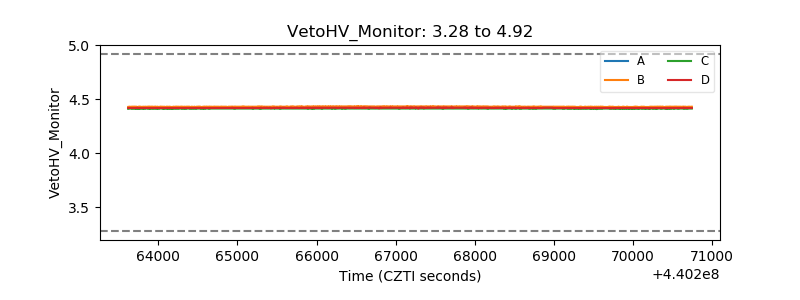 |
| Veto LLD | 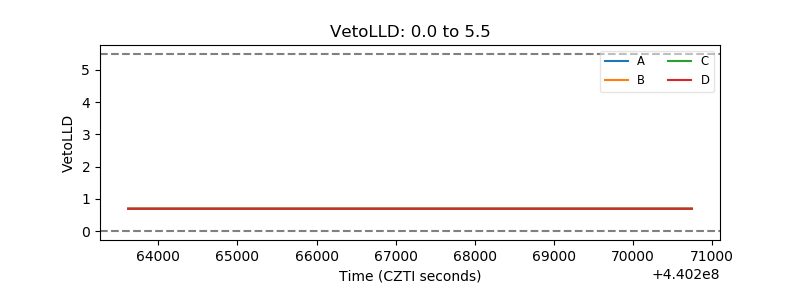 |
| Alpha Counter | 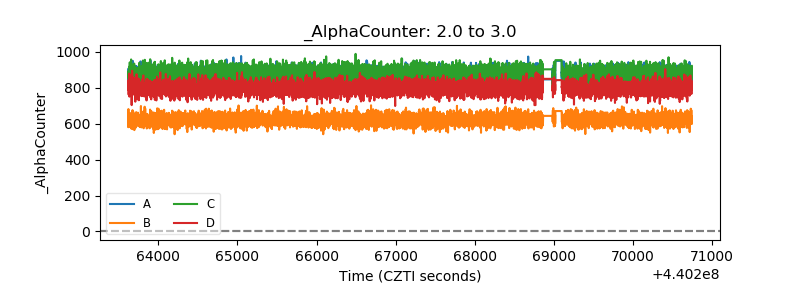 |
| _CPM_Rate | 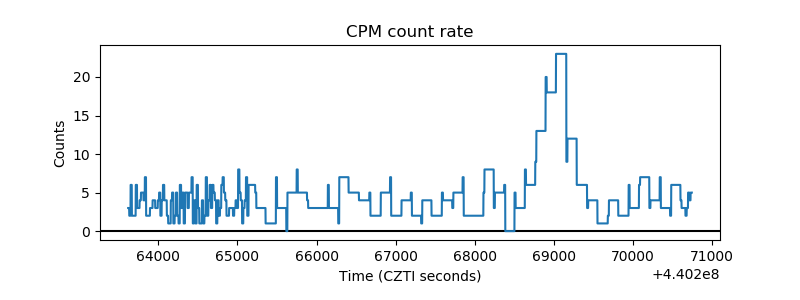 |
| CZT Counter | 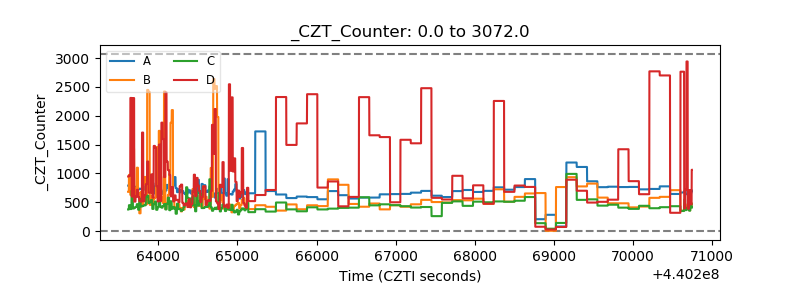 |
| +2.5 Volts monitor | 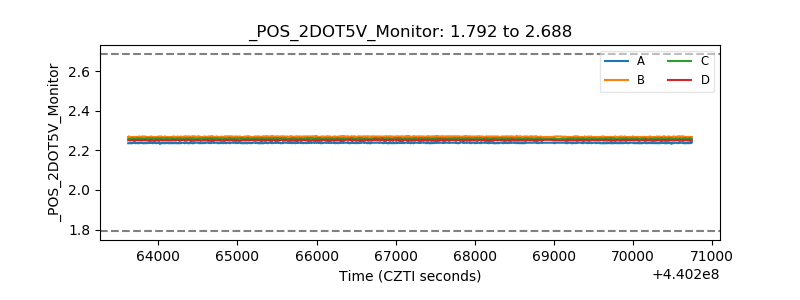 |
| +5 Volts monitor | 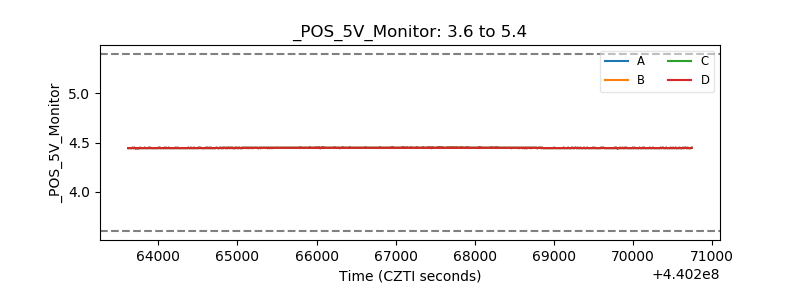 |
| _ROLL_ROT | 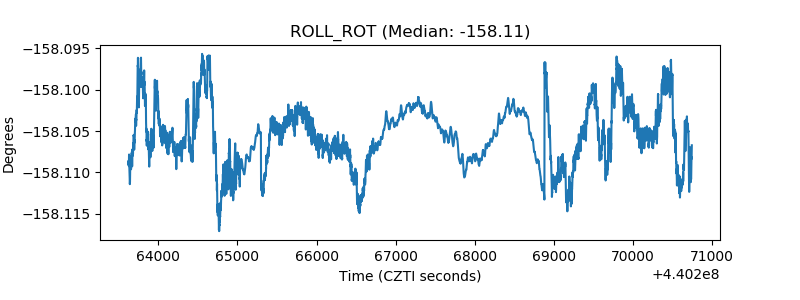 |
| _Roll_DEC |  |
| _Roll_RA | 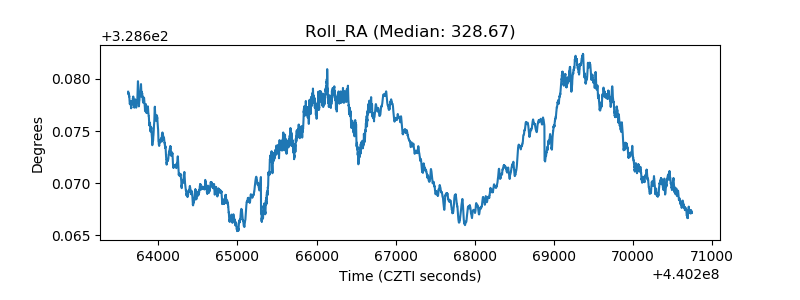 |
| Veto Counter | 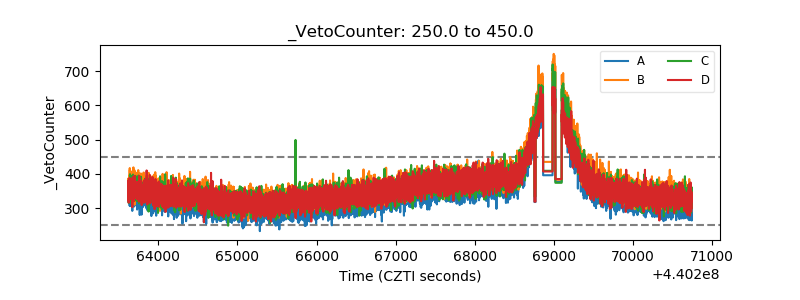 |