| Param | Original file | Final file |
|---|---|---|
| Filename | modeM0/AS1A13_008T08_9000005998_44406cztM0_level2.fits | modeM0/AS1A13_008T08_9000005998_44406cztM0_level2_quad_clean.evt |
| Size (bytes) | 617,808,960 | 116,668,800 |
| Size | 589.2 MB | 111.3 MB |
| Events in quadrant A | 5,264,492 | 807,853 |
| Events in quadrant B | 3,826,488 | 823,034 |
| Events in quadrant C | 4,124,569 | 780,337 |
| Events in quadrant D | 9,071,807 | 598,398 |
| Mode SS | |||
|---|---|---|---|
| Quadrant | BADHDUFLAG | Total packets | Discarded packets |
| A | 0 | 150 | 0 |
| B | 0 | 150 | 0 |
| C | 0 | 150 | 0 |
| D | 0 | 150 | 0 |
| Mode M0 | |||
|---|---|---|---|
| Quadrant | BADHDUFLAG | Total packets | Discarded packets |
| A | 0 | 21941 | 0 |
| B | 0 | 16490 | 0 |
| C | 0 | 17732 | 0 |
| D | 0 | 32131 | 0 |
| Quadrant | Total seconds | Saturated seconds | Saturation percentage |
|---|---|---|---|
| A | 7509 | 46 | 0.612598% |
| B | 7509 | 67 | 0.892263% |
| C | 7509 | 121 | 1.611400% |
| D | 7509 | 1549 | 20.628579% |
Noise dominated data is calculated using 1-second bins in cleaned event files. If a bin has >2000 counts, and if more than 50% of those come from <1% of pixels, then it is considered to be noise-dominated and hence unusable.
| Quadrant | # 1 sec bins | Bins with >0 counts | Bins with >2000 counts | High rate bins dominated by noise | Noise dominated (total time) | Noise dominated (detector-on time) | Marked lightcurve |
|---|---|---|---|---|---|---|---|
| A | 7509 | 7509 | 6 | 6 | 0.08% | 0.08% | 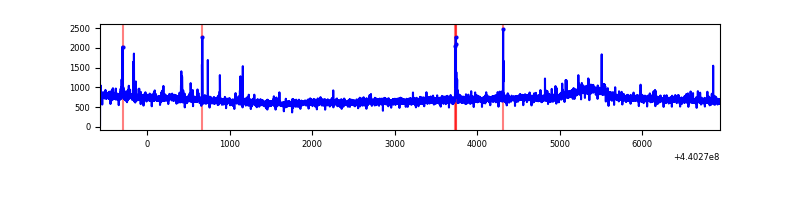 |
| B | 7509 | 7509 | 26 | 26 | 0.35% | 0.35% | 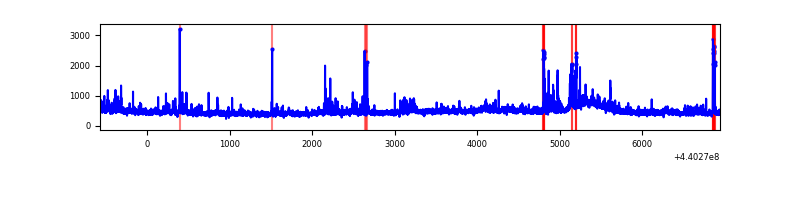 |
| C | 7509 | 7509 | 139 | 139 | 1.85% | 1.85% |  |
| D | 7509 | 7509 | 1480 | 1480 | 19.71% | 19.71% | 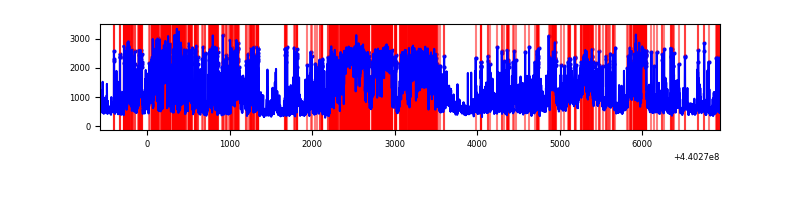 |
Top three noisy pixels from each quadrant. If the there are fewer than three noisy pixels in the level2.evt file, extra rows are filled as -1
| Pixel properties | Quadrant properties | ||||||
|---|---|---|---|---|---|---|---|
| Quadrant | DetID | PixID | Counts | Sigma | Mean | Median | Sigma |
| A | 10 | 83 | 1887324 | 10636.95 | 841 | 822 | 177.4 |
| A | 13 | 248 | 39015 | 215.35 | 841 | 822 | 177.4 |
| A | 0 | 243 | 26230 | 143.26 | 841 | 822 | 177.4 |
| B | 0 | 229 | 124149 | 749.44 | 840 | 816 | 164.6 |
| B | 5 | 235 | 57799 | 346.26 | 840 | 816 | 164.6 |
| B | 0 | 190 | 52859 | 316.24 | 840 | 816 | 164.6 |
| C | 15 | 158 | 635795 | 3294.72 | 815 | 820 | 192.7 |
| C | 14 | 254 | 180877 | 934.27 | 815 | 820 | 192.7 |
| C | 3 | 233 | 51974 | 265.43 | 815 | 820 | 192.7 |
| D | 5 | 235 | 1368868 | 7066.74 | 760 | 735 | 193.6 |
| D | 4 | 221 | 1089303 | 5622.72 | 760 | 735 | 193.6 |
| D | 5 | 222 | 872385 | 4502.28 | 760 | 735 | 193.6 |
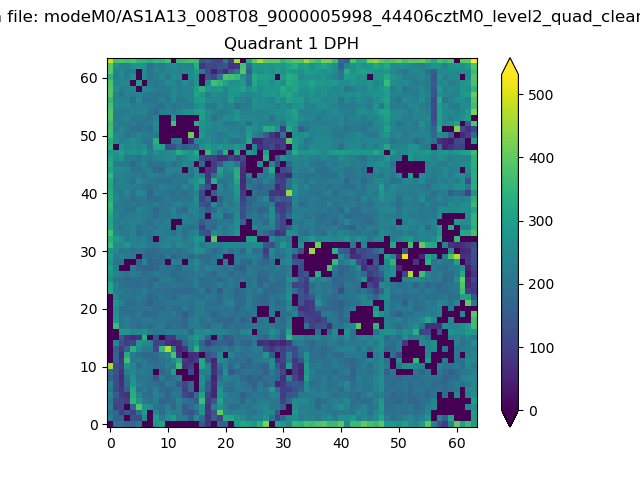
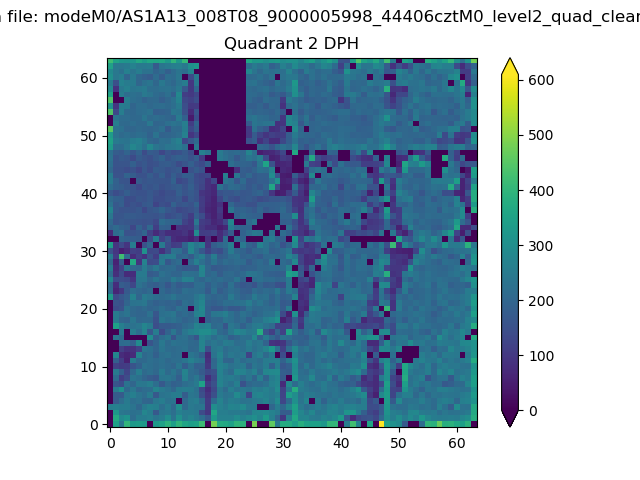
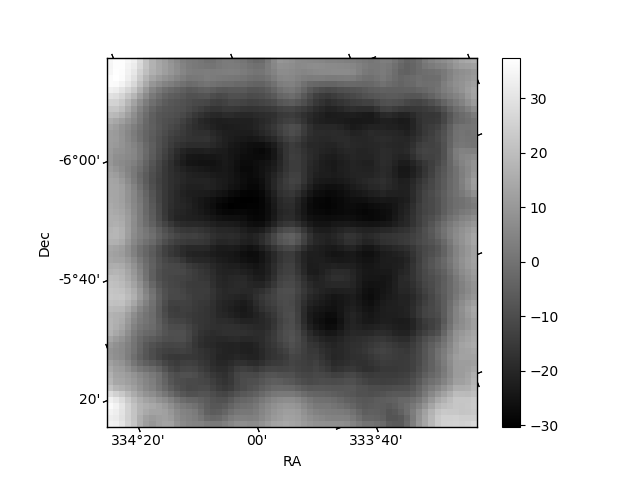
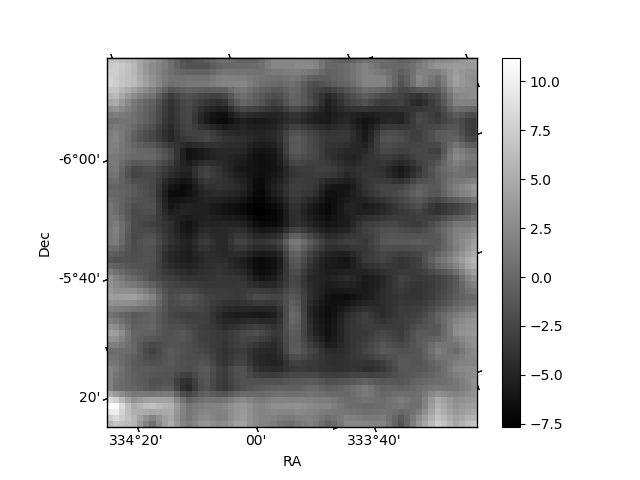
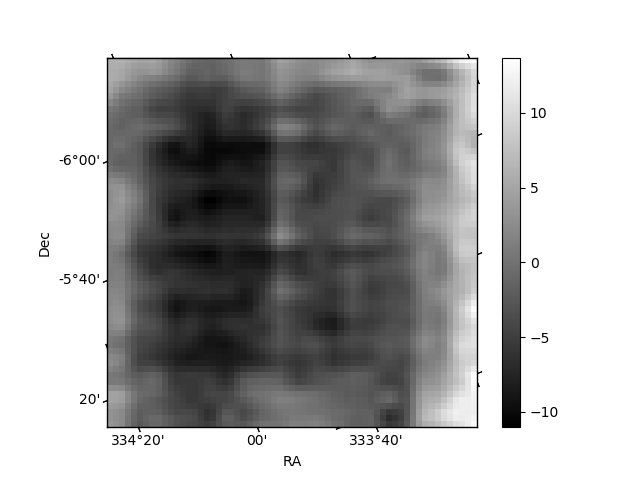
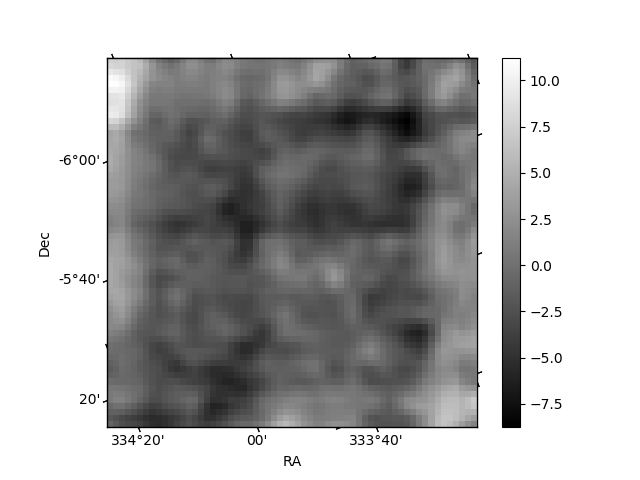
Histogram calculated using DETX and DETY for each event in the final _common_clean file
| Quadrant A | 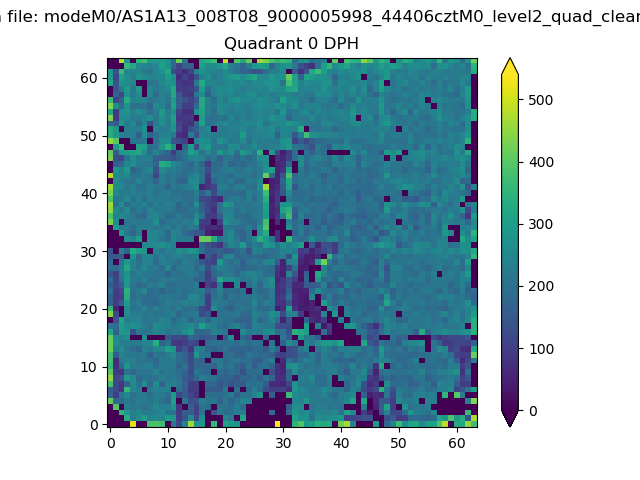 |
 |
Quadrant B |
|---|---|---|---|
| Quadrant D | 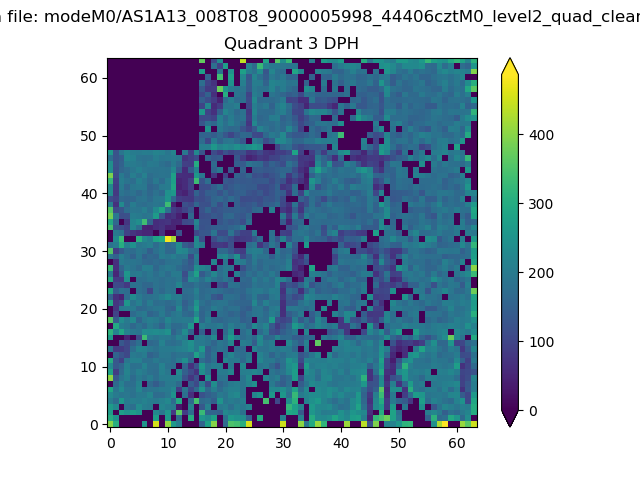 |
 |
Quadrant C |
| Plot type | Count rate plots | Images |
|---|---|---|
| Comparison with Poisson distribution Blue bars denote a histogram of data divided into 1 sec bins. Red curve is a Poisson curve with rate = median count rate of data. |
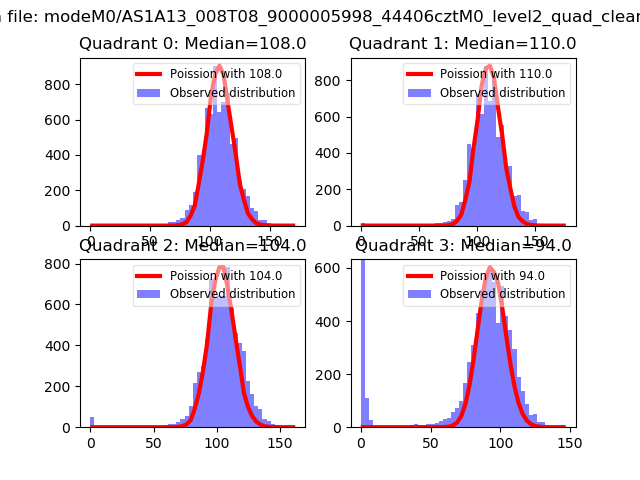 |
 |
| Quadrant-wise count rates Data is divided into 100 sec bins |
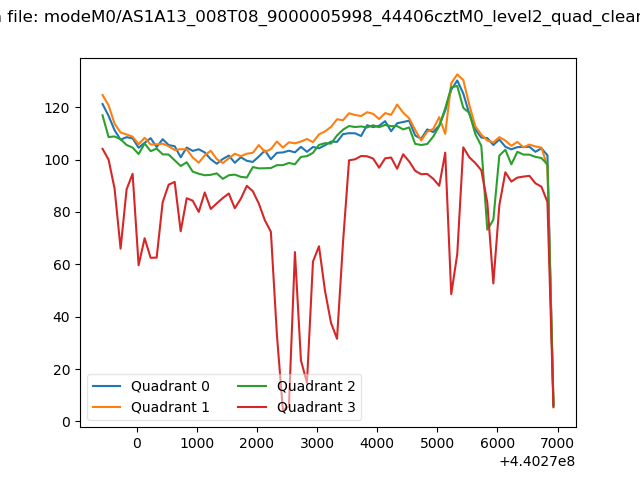 |
|
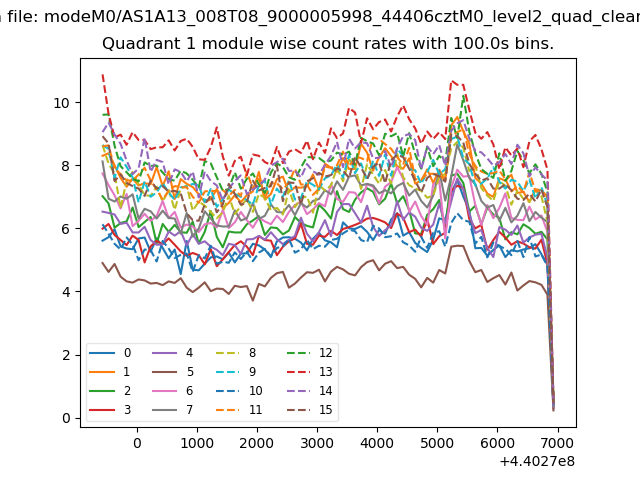
| Module-wise count rates for Quadrant A Data is divided into 100 sec bins |
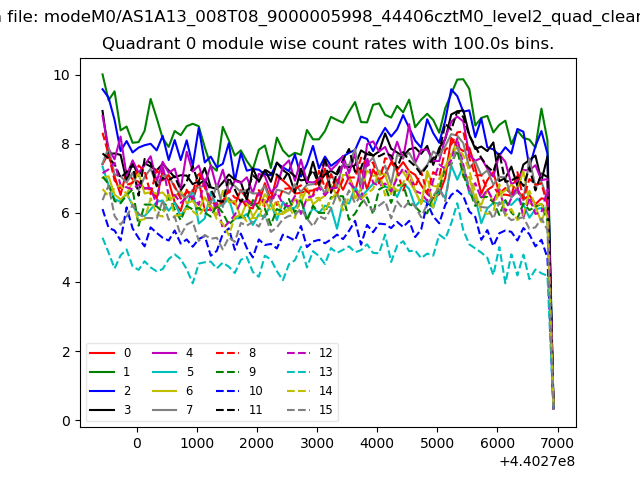 |
 |
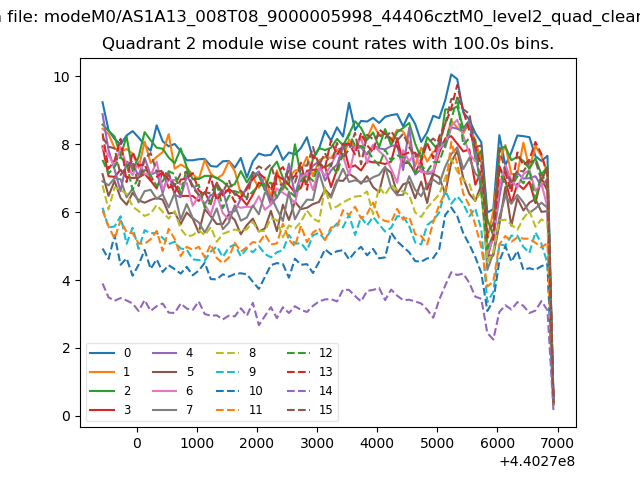
| Module-wise count rates for Quadrant B Data is divided into 100 sec bins |
 |
 |
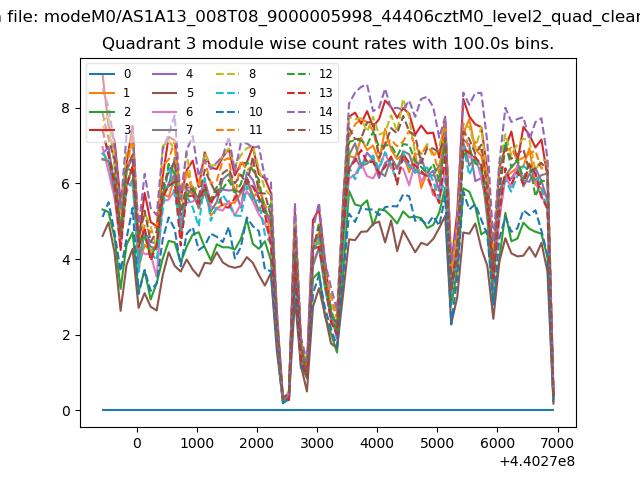
| Module-wise count rates for Quadrant C Data is divided into 100 sec bins |
 |
 |
| Module-wise count rates for Quadrant D Data is divided into 100 sec bins |
 |
 |
| Parameter | Plot |
|---|---|
| CZT HV Monitor | 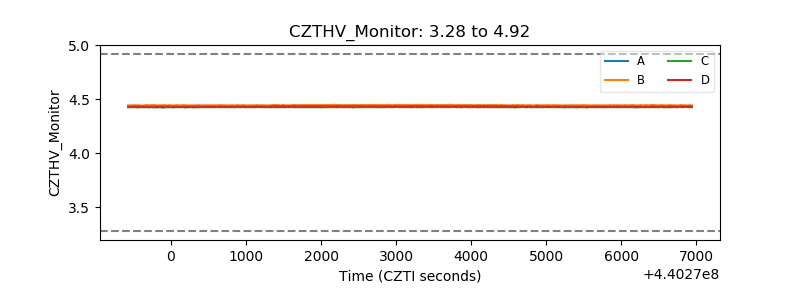 |
| D_VDD | 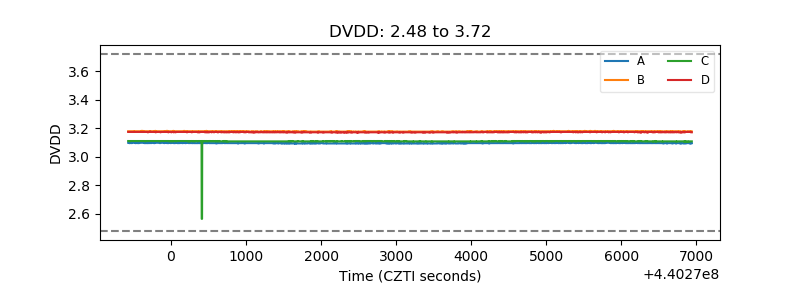 |
| Temperature 1 | 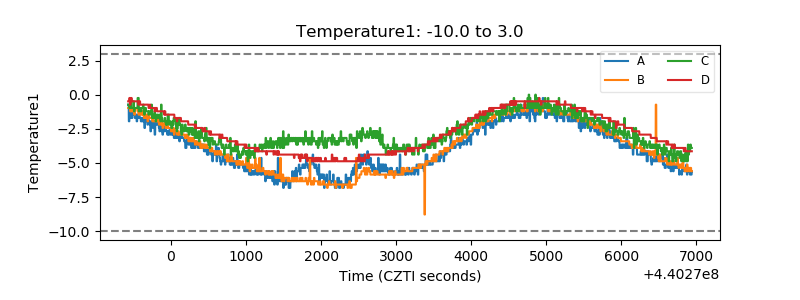 |
| Veto HV Monitor | 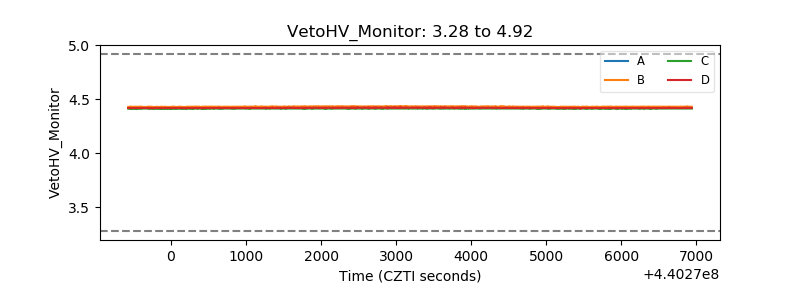 |
| Veto LLD | 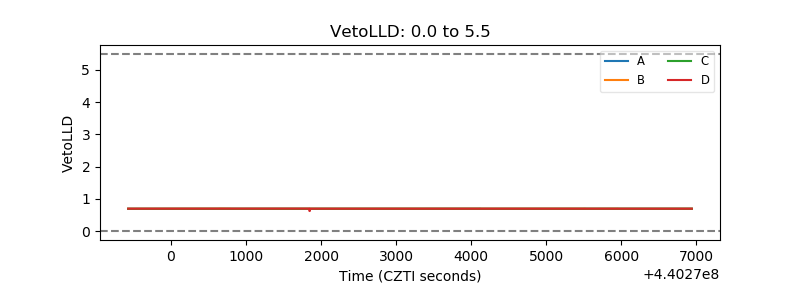 |
| Alpha Counter | 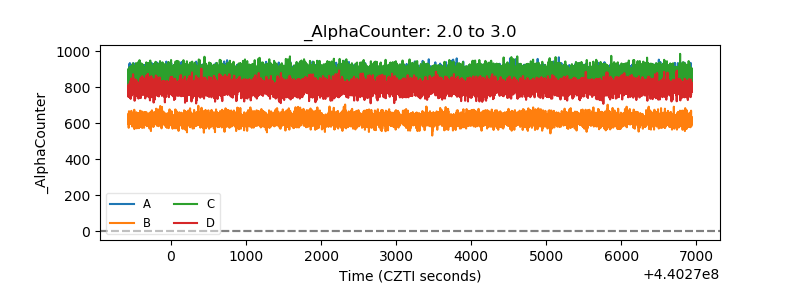 |
| _CPM_Rate | 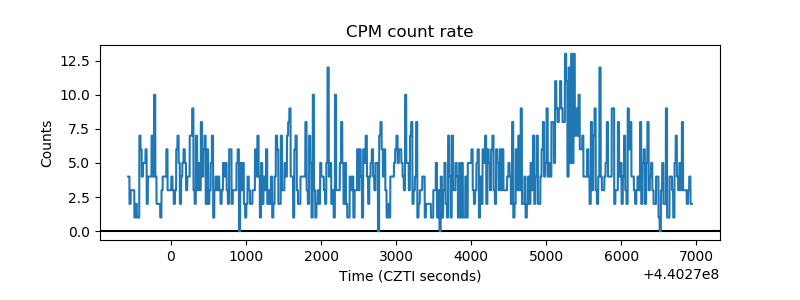 |
| CZT Counter | 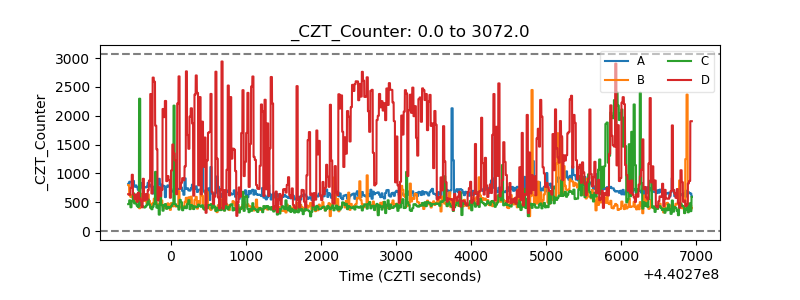 |
| +2.5 Volts monitor | 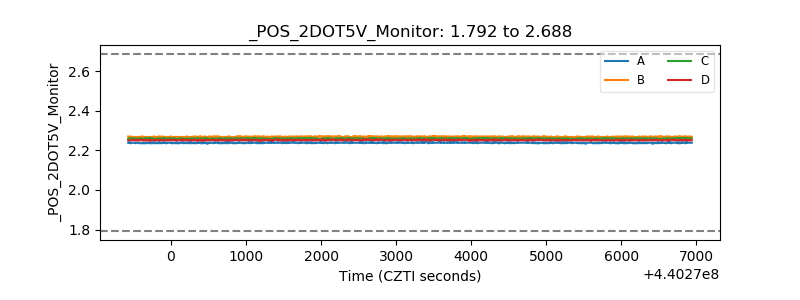 |
| +5 Volts monitor | 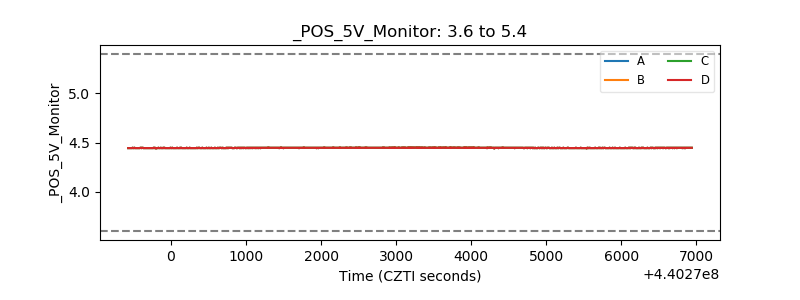 |
| _ROLL_ROT | 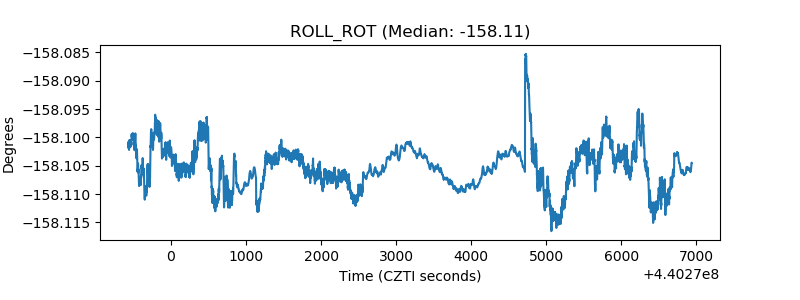 |
| _Roll_DEC | 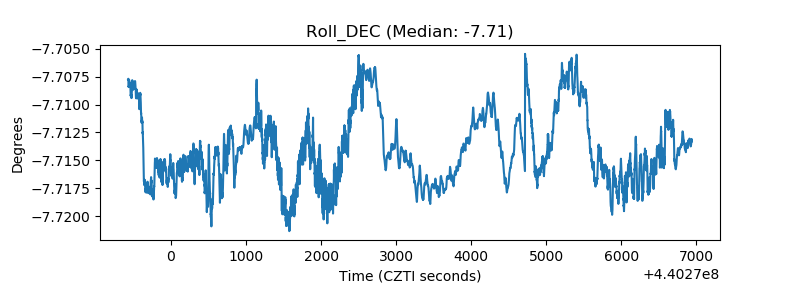 |
| _Roll_RA | 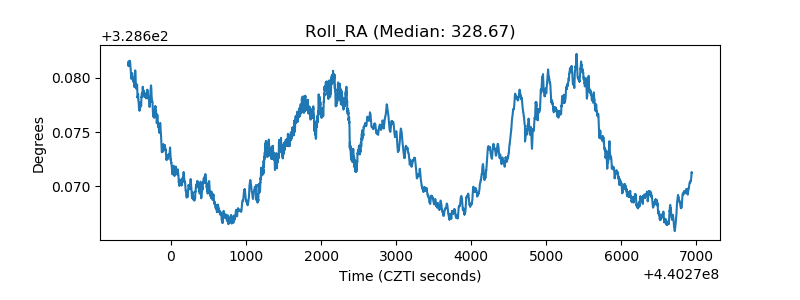 |
| Veto Counter | 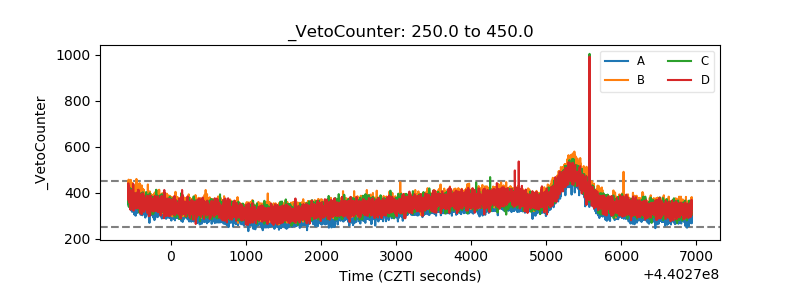 |