| Param | Original file | Final file |
|---|---|---|
| Filename | modeM0/AS1A13_008T08_9000005998_44407cztM0_level2.fits | modeM0/AS1A13_008T08_9000005998_44407cztM0_level2_quad_clean.evt |
| Size (bytes) | 657,118,080 | 114,603,840 |
| Size | 626.7 MB | 109.3 MB |
| Events in quadrant A | 5,223,414 | 811,084 |
| Events in quadrant B | 4,059,866 | 816,374 |
| Events in quadrant C | 6,551,365 | 663,692 |
| Events in quadrant D | 7,897,858 | 647,013 |
| Mode SS | |||
|---|---|---|---|
| Quadrant | BADHDUFLAG | Total packets | Discarded packets |
| A | 0 | 154 | 0 |
| B | 0 | 154 | 0 |
| C | 0 | 154 | 0 |
| D | 0 | 154 | 0 |
| Mode M0 | |||
|---|---|---|---|
| Quadrant | BADHDUFLAG | Total packets | Discarded packets |
| A | 0 | 22000 | 0 |
| B | 0 | 17303 | 0 |
| C | 0 | 25027 | 0 |
| D | 0 | 28726 | 0 |
| Quadrant | Total seconds | Saturated seconds | Saturation percentage |
|---|---|---|---|
| A | 7636 | 49 | 0.641697% |
| B | 7637 | 188 | 2.461700% |
| C | 7637 | 1215 | 15.909389% |
| D | 7637 | 1038 | 13.591724% |
Noise dominated data is calculated using 1-second bins in cleaned event files. If a bin has >2000 counts, and if more than 50% of those come from <1% of pixels, then it is considered to be noise-dominated and hence unusable.
| Quadrant | # 1 sec bins | Bins with >0 counts | Bins with >2000 counts | High rate bins dominated by noise | Noise dominated (total time) | Noise dominated (detector-on time) | Marked lightcurve |
|---|---|---|---|---|---|---|---|
| A | 7636 | 7636 | 0 | 0 | 0.00% | 0.00% | 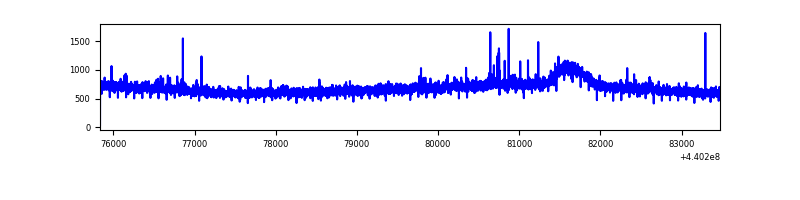 |
| B | 7637 | 7637 | 90 | 90 | 1.18% | 1.18% | 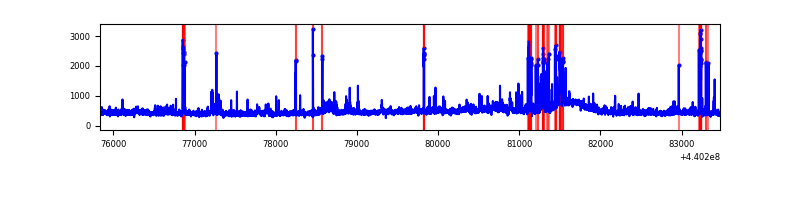 |
| C | 7637 | 7637 | 1160 | 1160 | 15.19% | 15.19% |  |
| D | 7637 | 7637 | 1043 | 1043 | 13.66% | 13.66% | 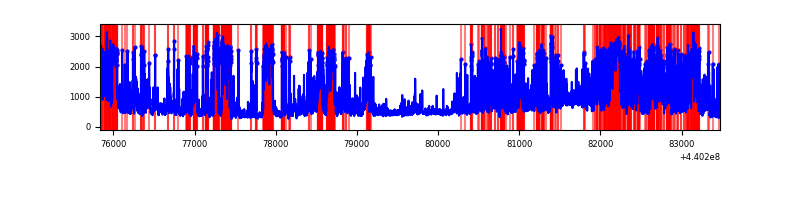 |
Top three noisy pixels from each quadrant. If the there are fewer than three noisy pixels in the level2.evt file, extra rows are filled as -1
| Pixel properties | Quadrant properties | ||||||
|---|---|---|---|---|---|---|---|
| Quadrant | DetID | PixID | Counts | Sigma | Mean | Median | Sigma |
| A | 10 | 83 | 1837148 | 10117.66 | 855 | 836 | 181.5 |
| A | 8 | 4 | 31317 | 167.94 | 855 | 836 | 181.5 |
| A | 13 | 248 | 18603 | 97.89 | 855 | 836 | 181.5 |
| B | 5 | 172 | 247624 | 1454.53 | 848 | 821 | 169.7 |
| B | 5 | 255 | 122115 | 714.84 | 848 | 821 | 169.7 |
| B | 0 | 190 | 71117 | 414.29 | 848 | 821 | 169.7 |
| C | 15 | 158 | 3210611 | 17709.04 | 769 | 774 | 181.3 |
| C | 14 | 254 | 153901 | 844.82 | 769 | 774 | 181.3 |
| C | 3 | 233 | 75236 | 410.82 | 769 | 774 | 181.3 |
| D | 4 | 221 | 1074871 | 5369.55 | 792 | 765 | 200.0 |
| D | 6 | 239 | 854527 | 4268.03 | 792 | 765 | 200.0 |
| D | 2 | 249 | 807482 | 4032.85 | 792 | 765 | 200.0 |
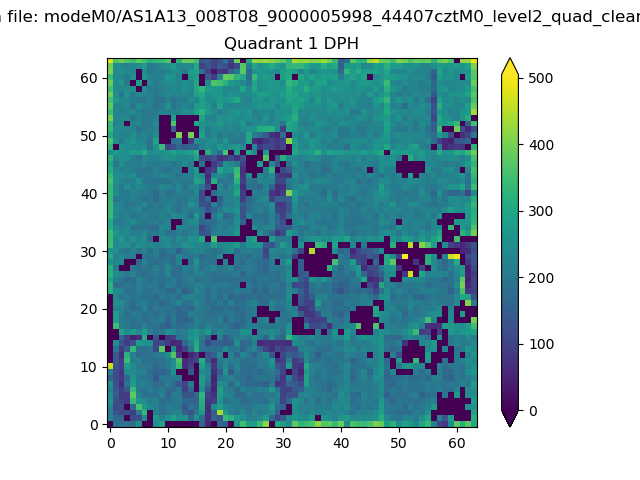
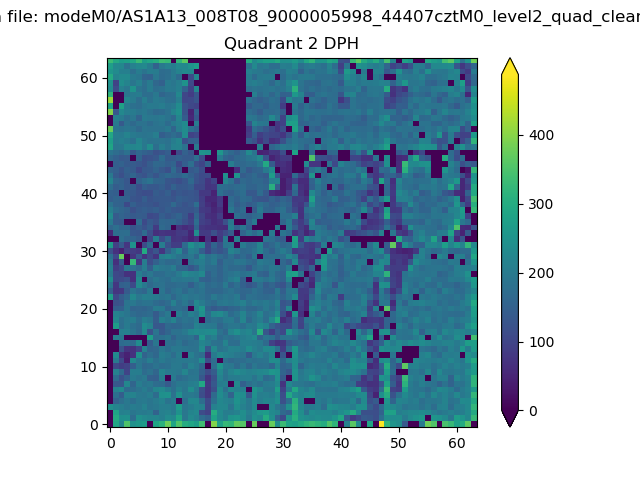
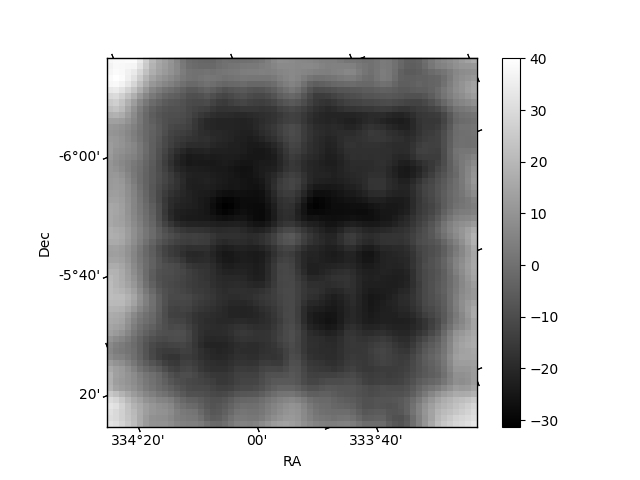
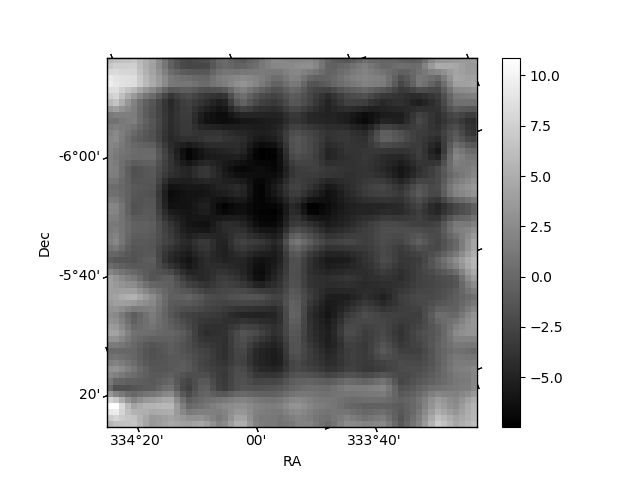
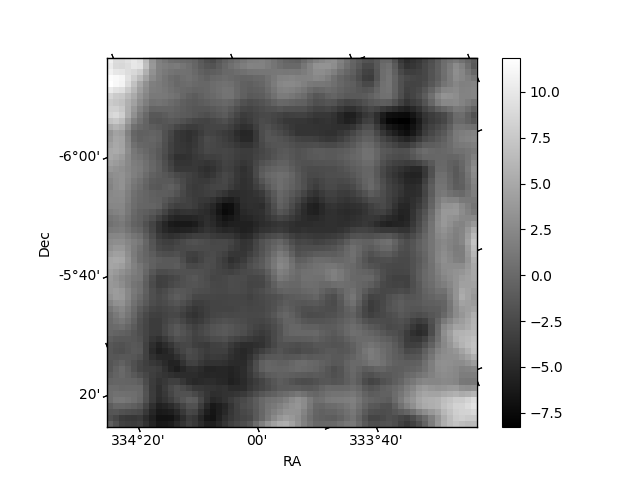
Histogram calculated using DETX and DETY for each event in the final _common_clean file
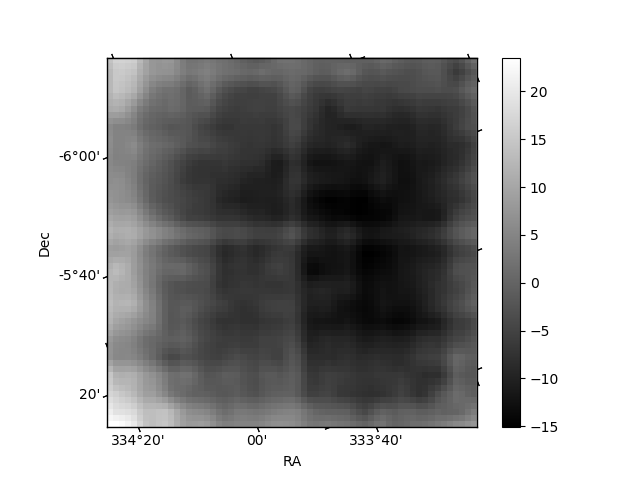
| Quadrant A | 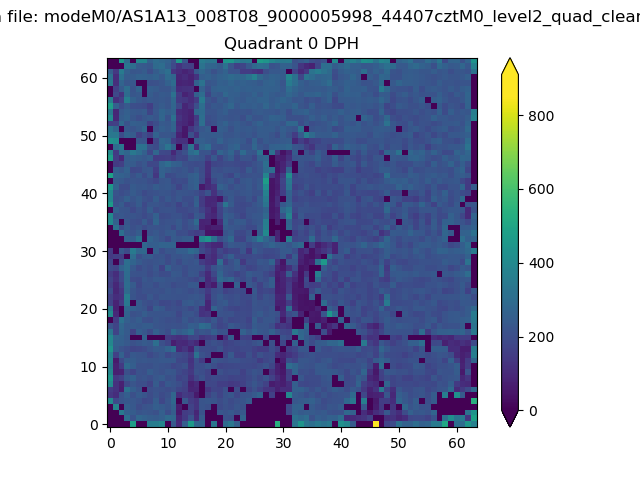 |
 |
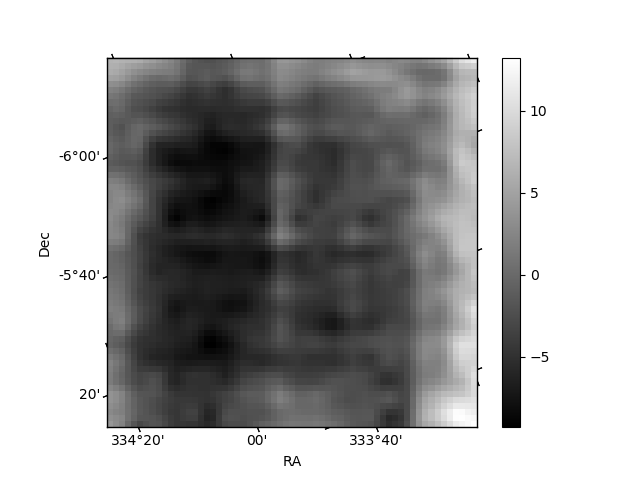
Quadrant B |
|---|---|---|---|
| Quadrant D | 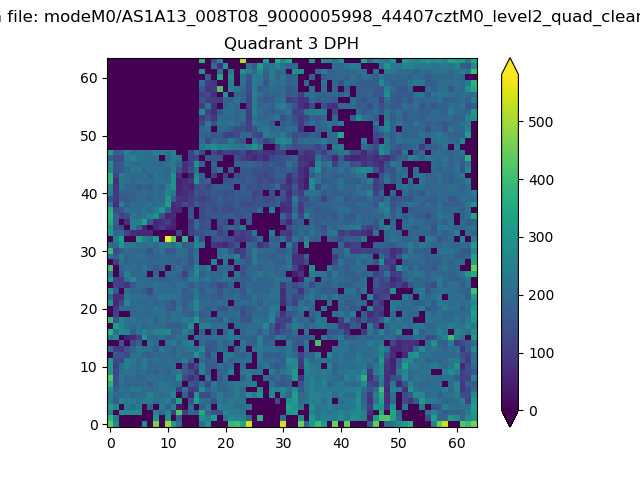 |
 |
Quadrant C |
| Plot type | Count rate plots | Images |
|---|---|---|
| Comparison with Poisson distribution Blue bars denote a histogram of data divided into 1 sec bins. Red curve is a Poisson curve with rate = median count rate of data. |
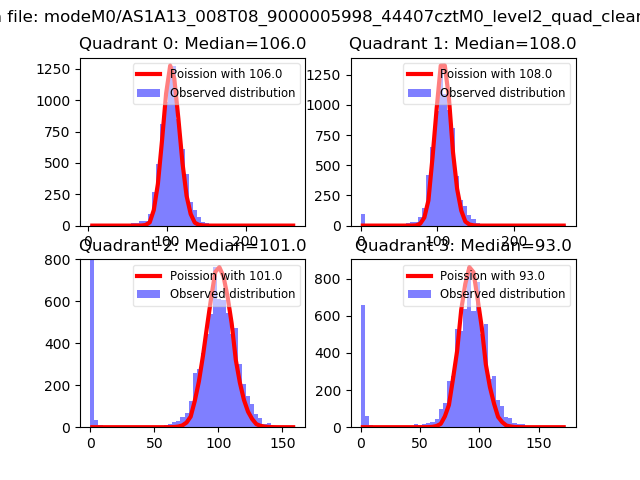 |
 |
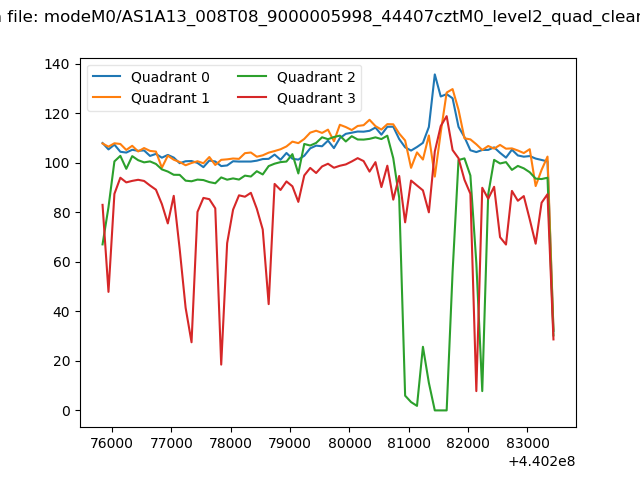
| Quadrant-wise count rates Data is divided into 100 sec bins |
 |
|
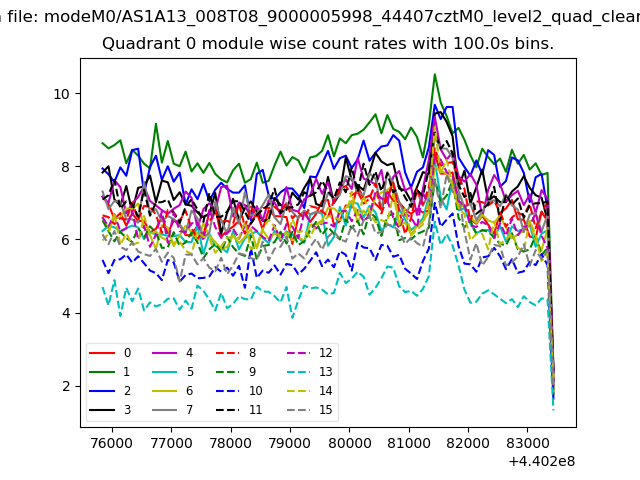
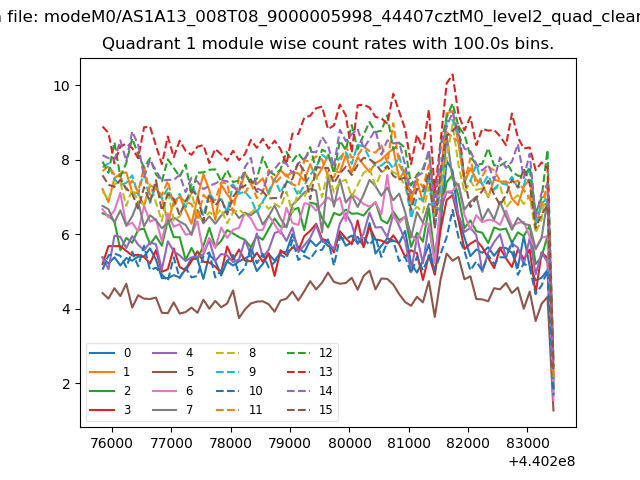
| Module-wise count rates for Quadrant A Data is divided into 100 sec bins |
 |
 |
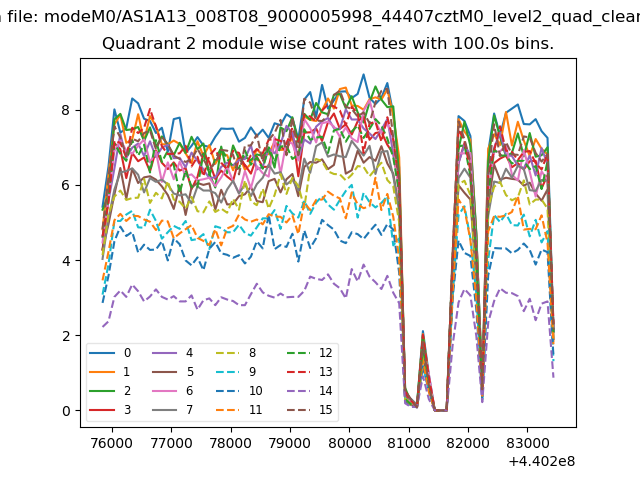
| Module-wise count rates for Quadrant B Data is divided into 100 sec bins |
 |
 |
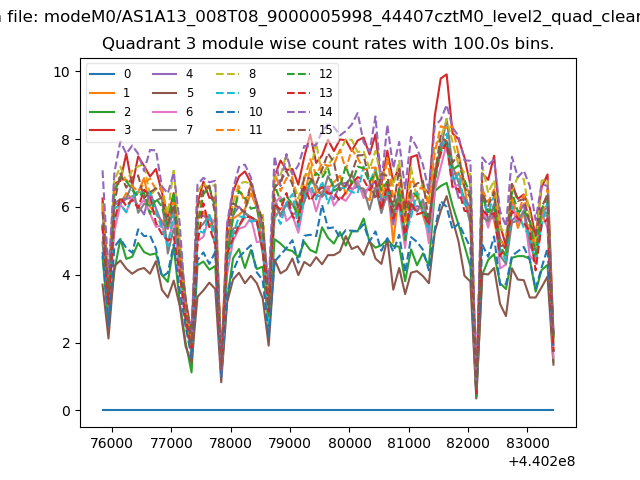
| Module-wise count rates for Quadrant C Data is divided into 100 sec bins |
 |
 |
| Module-wise count rates for Quadrant D Data is divided into 100 sec bins |
 |
 |
| Parameter | Plot |
|---|---|
| CZT HV Monitor | 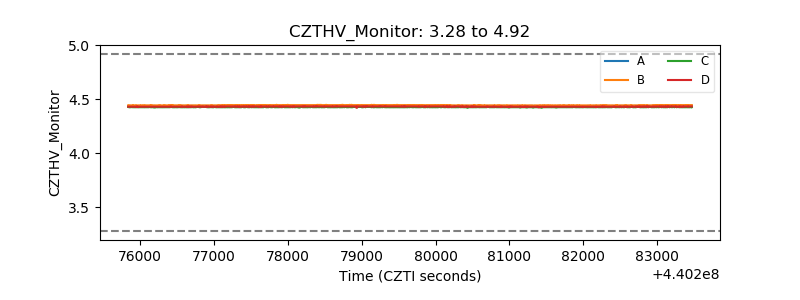 |
| D_VDD | 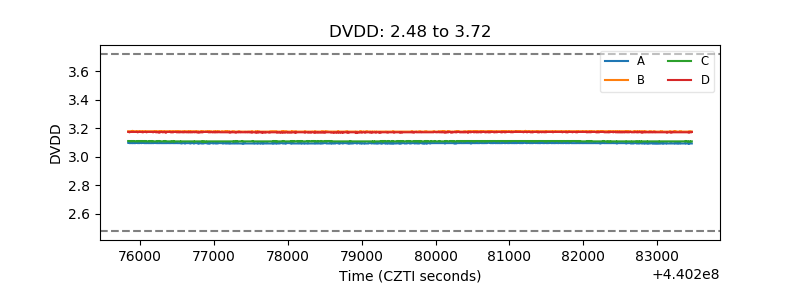 |
| Temperature 1 | 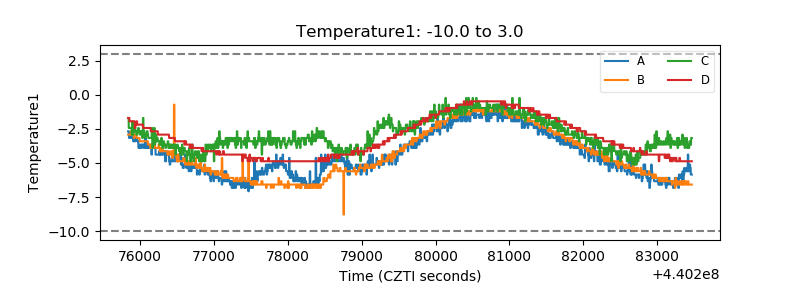 |
| Veto HV Monitor | 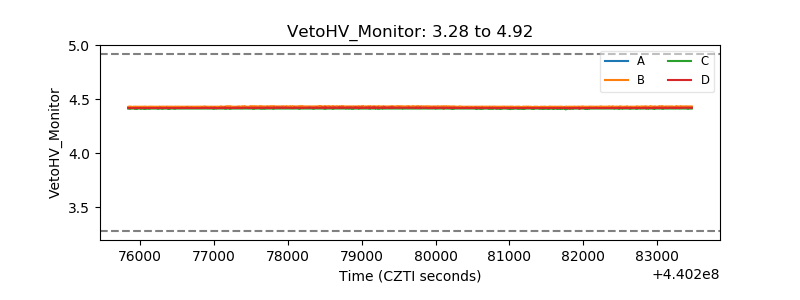 |
| Veto LLD | 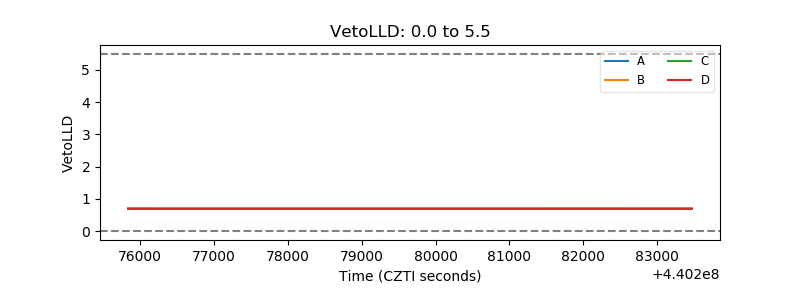 |
| Alpha Counter | 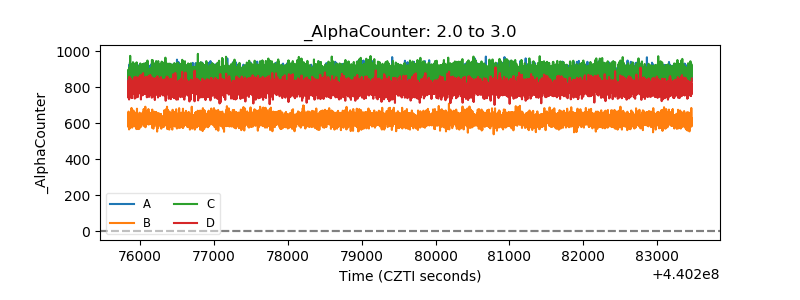 |
| _CPM_Rate | 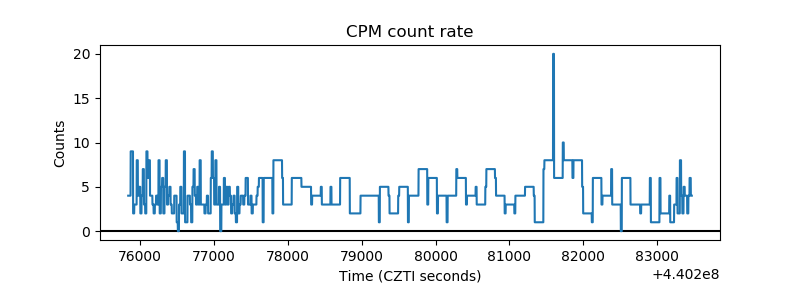 |
| CZT Counter | 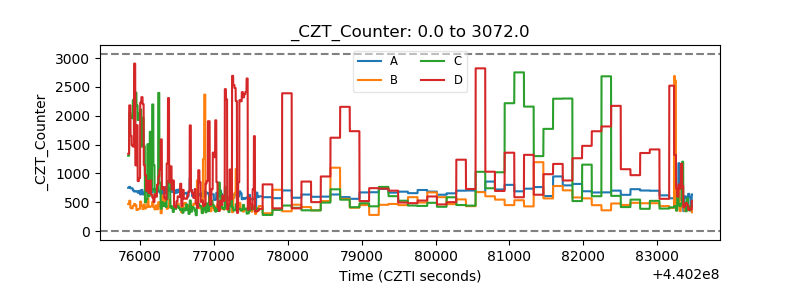 |
| +2.5 Volts monitor | 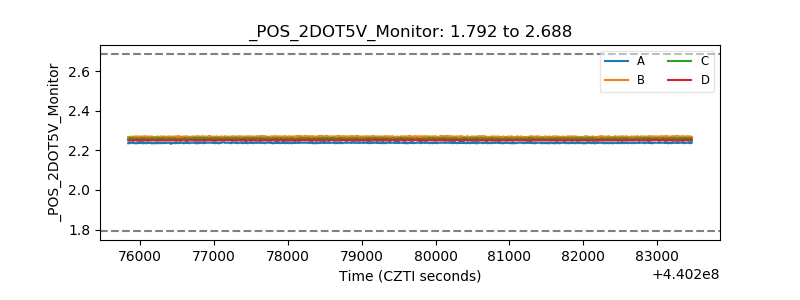 |
| +5 Volts monitor | 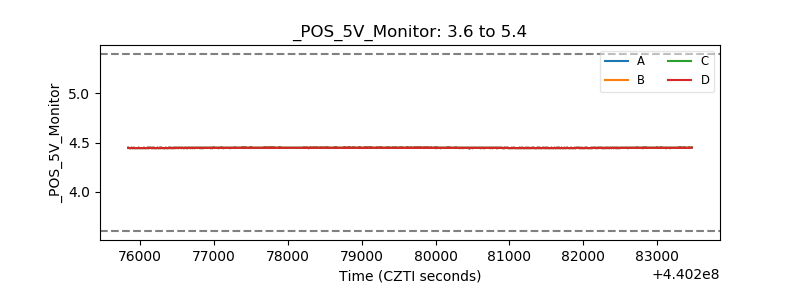 |
| _ROLL_ROT | 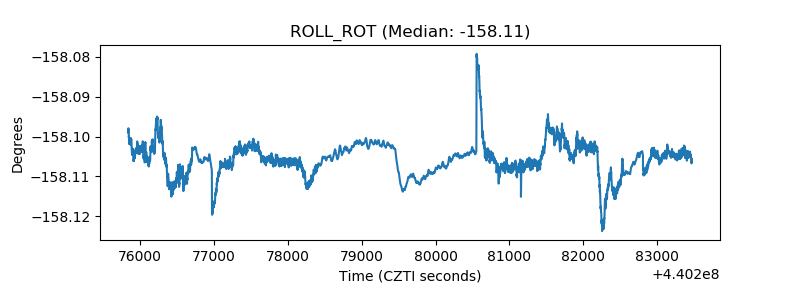 |
| _Roll_DEC | 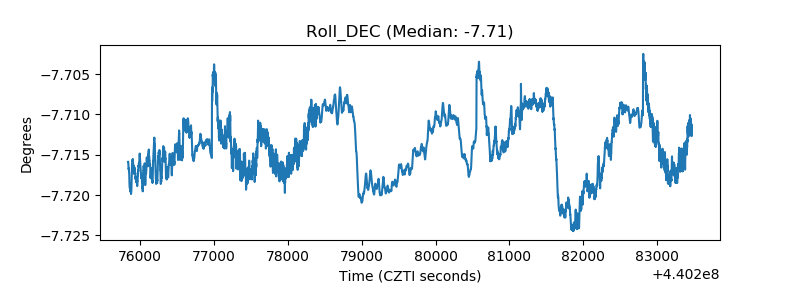 |
| _Roll_RA | 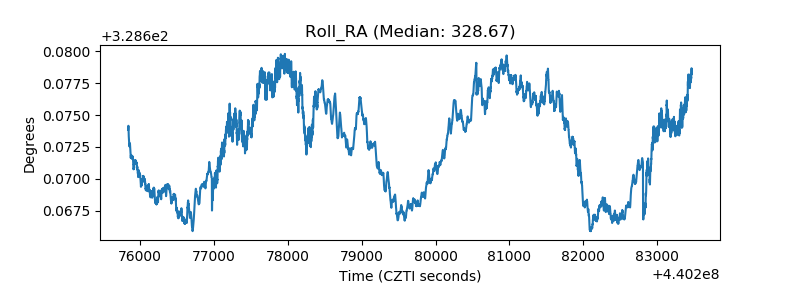 |
| Veto Counter | 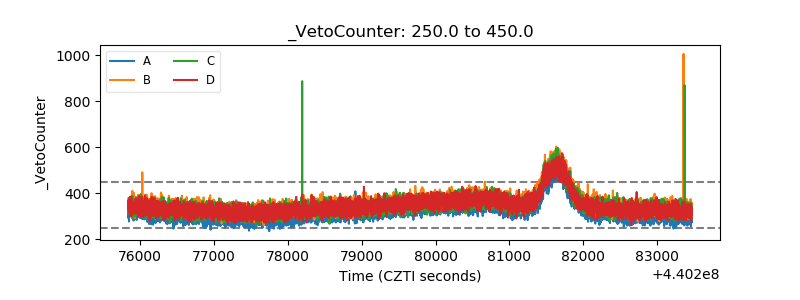 |