| Param | Original file | Final file |
|---|---|---|
| Filename | modeM0/AS1A13_008T08_9000005998_44410cztM0_level2.fits | modeM0/AS1A13_008T08_9000005998_44410cztM0_level2_quad_clean.evt |
| Size (bytes) | 1,832,316,480 | 268,240,320 |
| Size | 1.7 GB | 255.8 MB |
| Events in quadrant A | 13,187,186 | 1,963,963 |
| Events in quadrant B | 9,857,426 | 2,009,695 |
| Events in quadrant C | 10,490,122 | 1,873,918 |
| Events in quadrant D | 32,825,836 | 966,859 |
| Mode SS | |||
|---|---|---|---|
| Quadrant | BADHDUFLAG | Total packets | Discarded packets |
| A | 0 | 382 | 0 |
| B | 0 | 382 | 0 |
| C | 0 | 382 | 0 |
| D | 0 | 382 | 0 |
| Mode M0 | |||
|---|---|---|---|
| Quadrant | BADHDUFLAG | Total packets | Discarded packets |
| A | 0 | 55200 | 2 |
| B | 0 | 42054 | 2 |
| C | 0 | 44768 | 2 |
| D | 0 | 110614 | 2 |
| Mode M9 | |||
|---|---|---|---|
| Quadrant | BADHDUFLAG | Total packets | Discarded packets |
| A | 0 | 17 | 0 |
| B | 0 | 17 | 0 |
| C | 0 | 17 | 0 |
| D | 0 | 17 | 0 |
| Quadrant | Total seconds | Saturated seconds | Saturation percentage |
|---|---|---|---|
| A | 18970 | 329 | 1.734317% |
| B | 18969 | 446 | 2.351205% |
| C | 18969 | 777 | 4.096157% |
| D | 18970 | 9248 | 48.750659% |
Noise dominated data is calculated using 1-second bins in cleaned event files. If a bin has >2000 counts, and if more than 50% of those come from <1% of pixels, then it is considered to be noise-dominated and hence unusable.
| Quadrant | # 1 sec bins | Bins with >0 counts | Bins with >2000 counts | High rate bins dominated by noise | Noise dominated (total time) | Noise dominated (detector-on time) | Marked lightcurve |
|---|---|---|---|---|---|---|---|
| A | 20580 | 18974 | 23 | 23 | 0.11% | 0.12% | 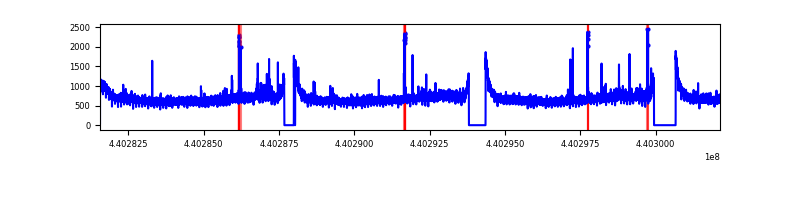 |
| B | 20579 | 18973 | 144 | 144 | 0.70% | 0.76% | 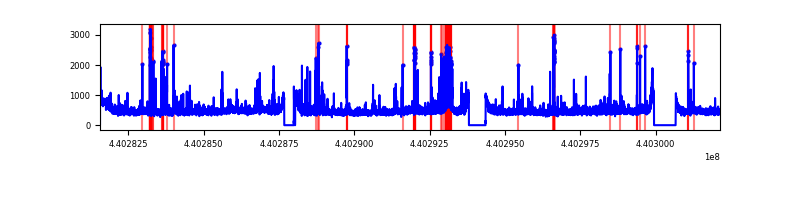 |
| C | 20579 | 18973 | 555 | 555 | 2.70% | 2.93% | 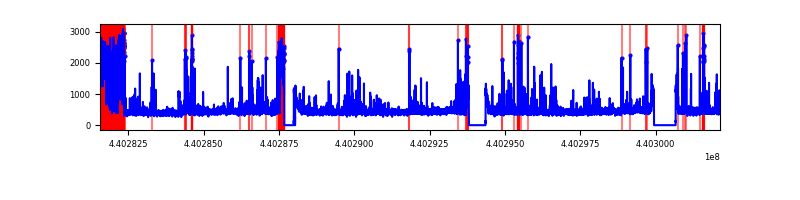 |
| D | 20580 | 18974 | 8975 | 8975 | 43.61% | 47.30% | 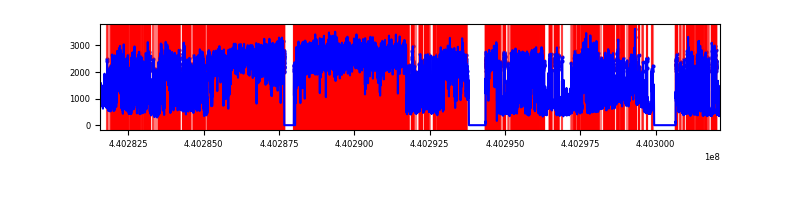 |
Top three noisy pixels from each quadrant. If the there are fewer than three noisy pixels in the level2.evt file, extra rows are filled as -1
| Pixel properties | Quadrant properties | ||||||
|---|---|---|---|---|---|---|---|
| Quadrant | DetID | PixID | Counts | Sigma | Mean | Median | Sigma |
| A | 10 | 83 | 4651276 | 10357.94 | 2140 | 2092 | 448.9 |
| A | 13 | 248 | 122312 | 267.84 | 2140 | 2092 | 448.9 |
| A | 8 | 4 | 66097 | 142.6 | 2140 | 2092 | 448.9 |
| B | 0 | 229 | 307677 | 726.12 | 2134 | 2069 | 420.9 |
| B | 5 | 255 | 279852 | 660.01 | 2134 | 2069 | 420.9 |
| B | 5 | 235 | 274636 | 647.61 | 2134 | 2069 | 420.9 |
| C | 15 | 158 | 1506309 | 3117.04 | 2057 | 2071 | 482.6 |
| C | 14 | 254 | 504931 | 1042.01 | 2057 | 2071 | 482.6 |
| C | 12 | 16 | 168166 | 344.18 | 2057 | 2071 | 482.6 |
| D | 12 | 17 | 19294771 | 50535.88 | 1490 | 1444 | 381.8 |
| D | 2 | 249 | 1336395 | 3496.7 | 1490 | 1444 | 381.8 |
| D | 4 | 221 | 1061956 | 2777.85 | 1490 | 1444 | 381.8 |
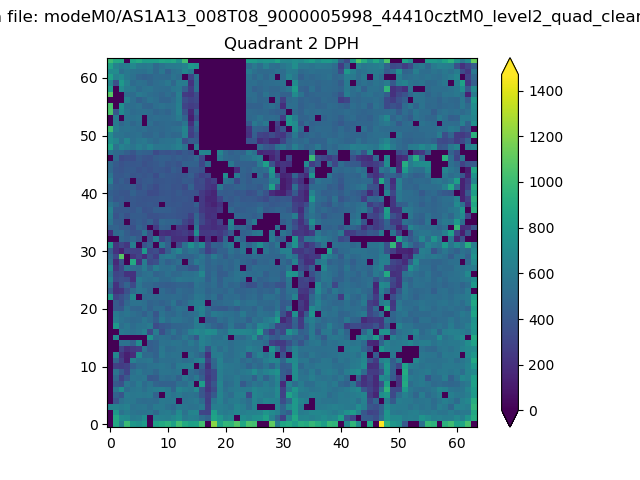
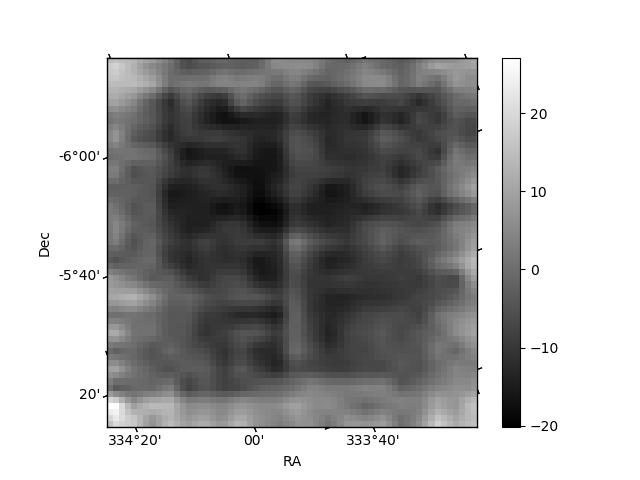
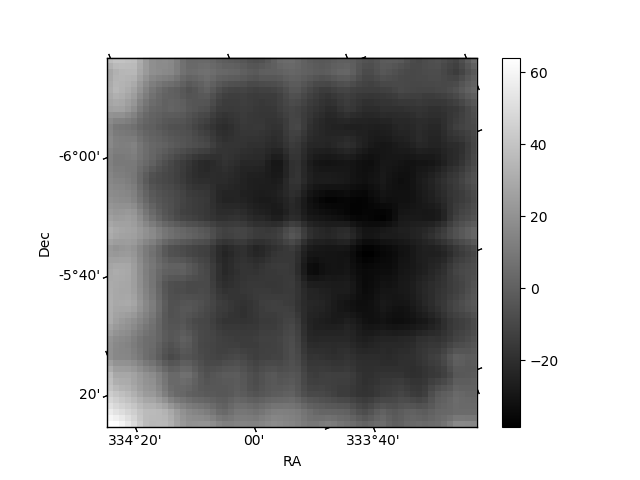
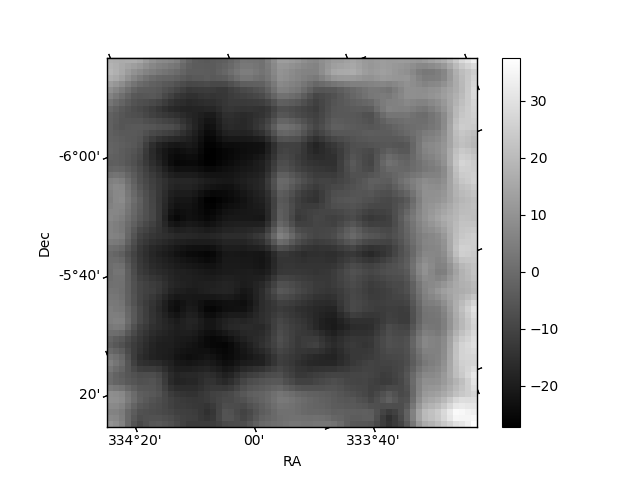
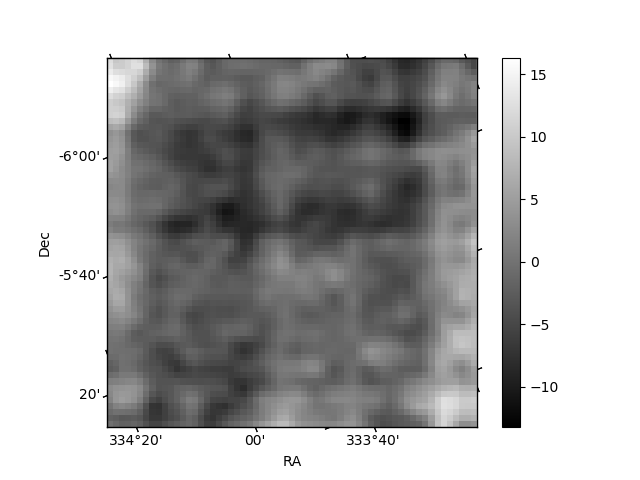
Histogram calculated using DETX and DETY for each event in the final _common_clean file
| Quadrant A |  |
 |
Quadrant B |
|---|---|---|---|
| Quadrant D | 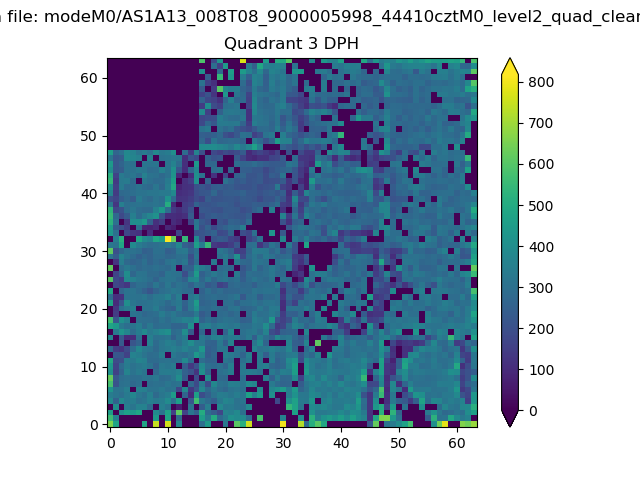 |
 |
Quadrant C |
| Plot type | Count rate plots | Images |
|---|---|---|
| Comparison with Poisson distribution Blue bars denote a histogram of data divided into 1 sec bins. Red curve is a Poisson curve with rate = median count rate of data. |
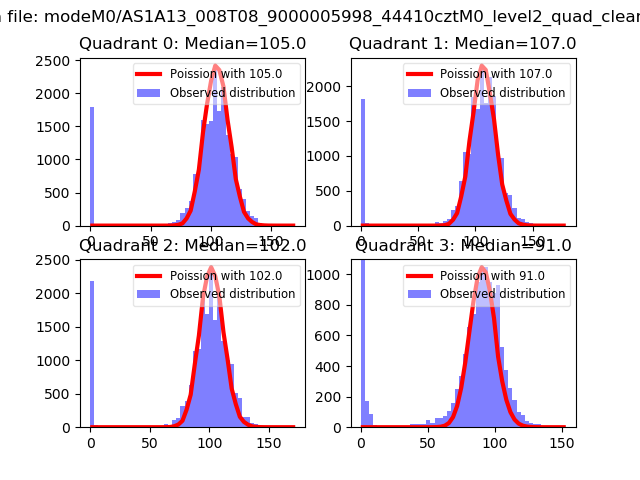 |
 |
| Quadrant-wise count rates Data is divided into 100 sec bins |
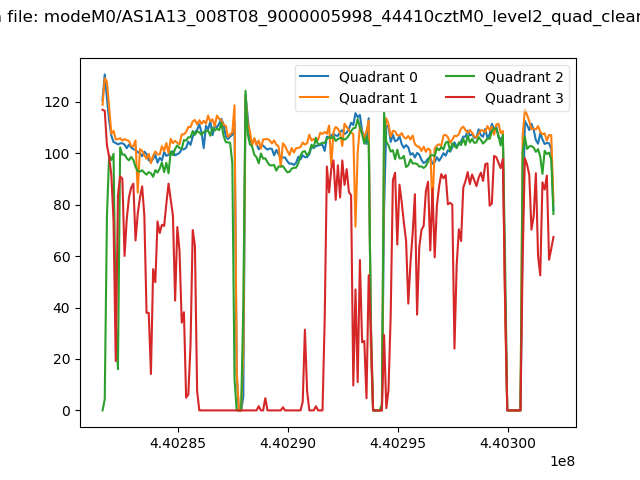 |
|
| Module-wise count rates for Quadrant A Data is divided into 100 sec bins |
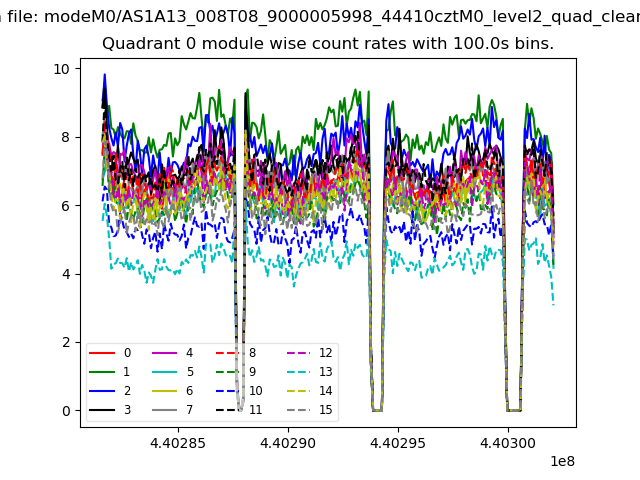 |
 |
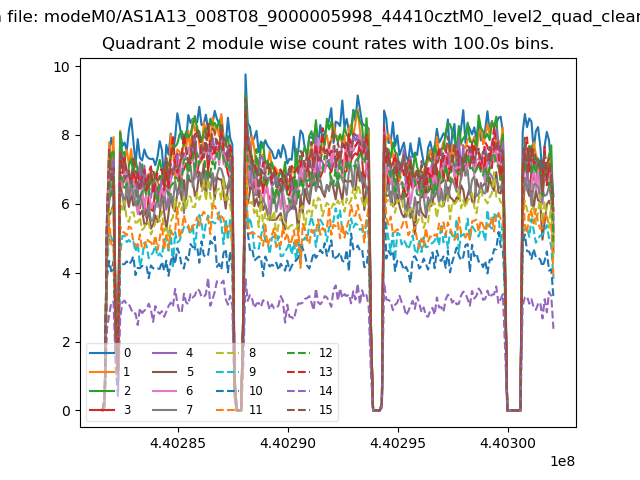
| Module-wise count rates for Quadrant B Data is divided into 100 sec bins |
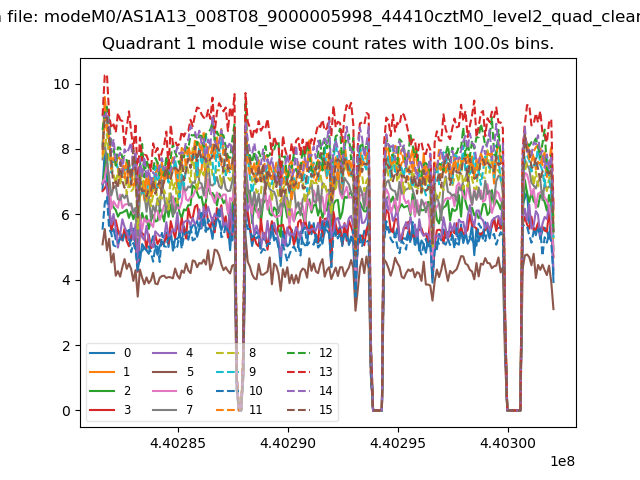 |
 |
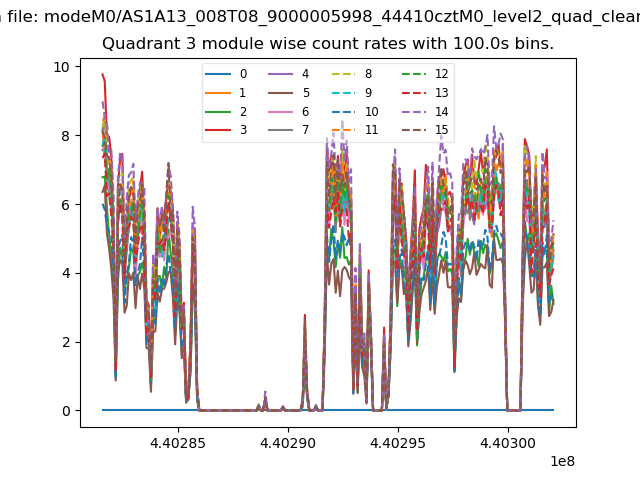
| Module-wise count rates for Quadrant C Data is divided into 100 sec bins |
 |
 |
| Module-wise count rates for Quadrant D Data is divided into 100 sec bins |
 |
 |
| Parameter | Plot |
|---|---|
| CZT HV Monitor | 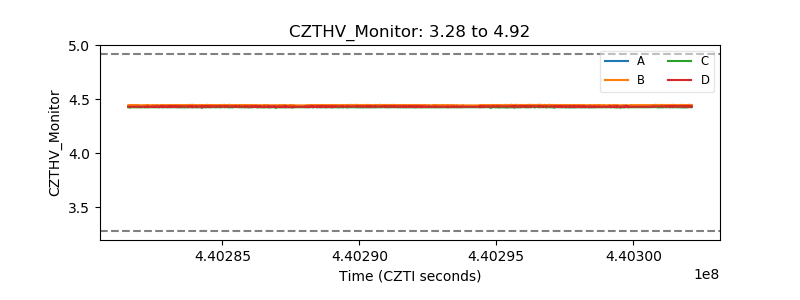 |
| D_VDD | 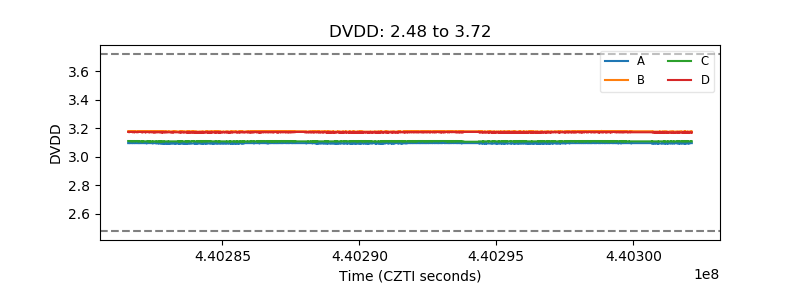 |
| Temperature 1 | 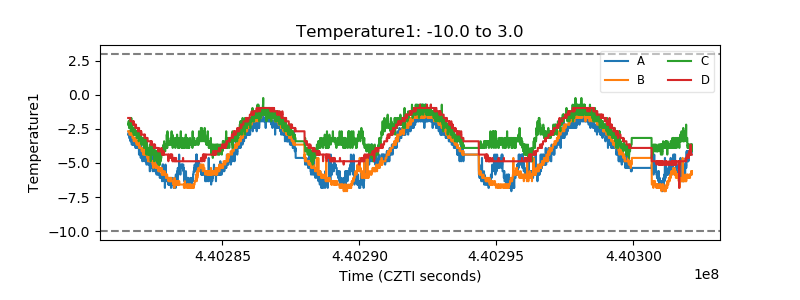 |
| Veto HV Monitor | 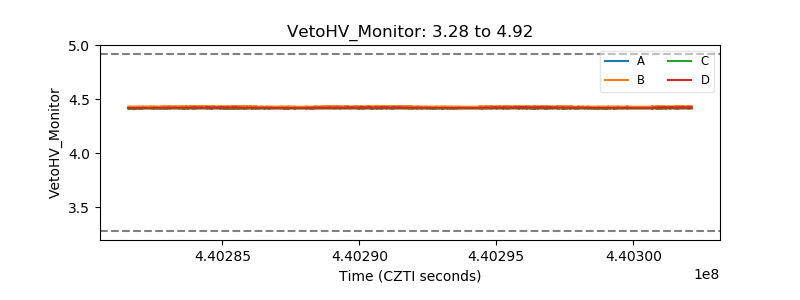 |
| Veto LLD | 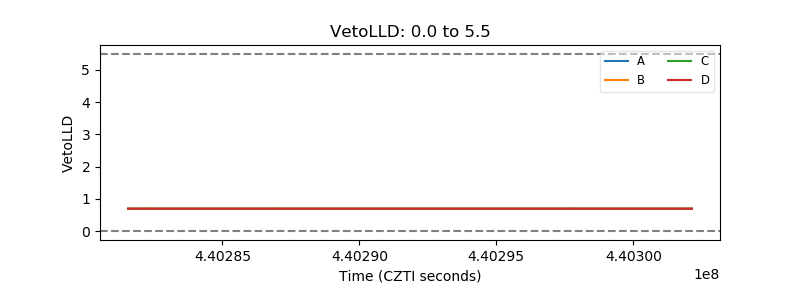 |
| Alpha Counter | 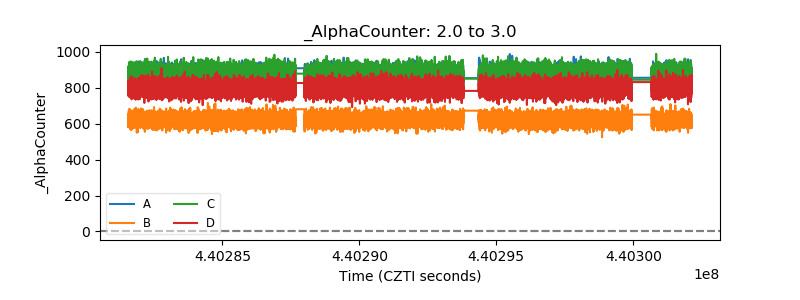 |
| _CPM_Rate | 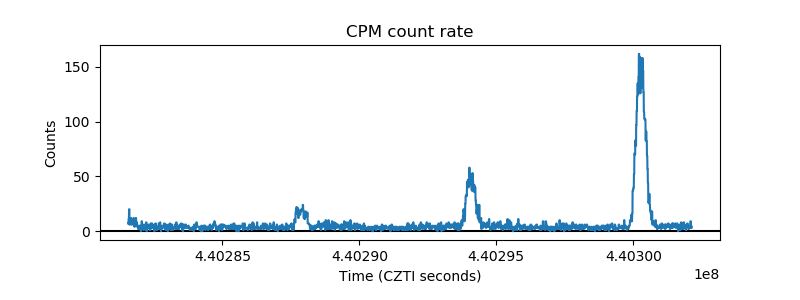 |
| CZT Counter | 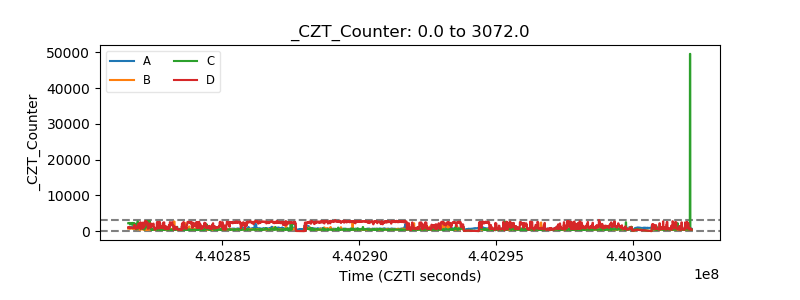 |
| +2.5 Volts monitor | 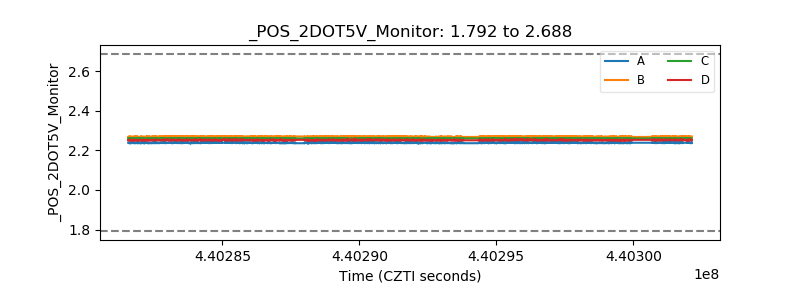 |
| +5 Volts monitor | 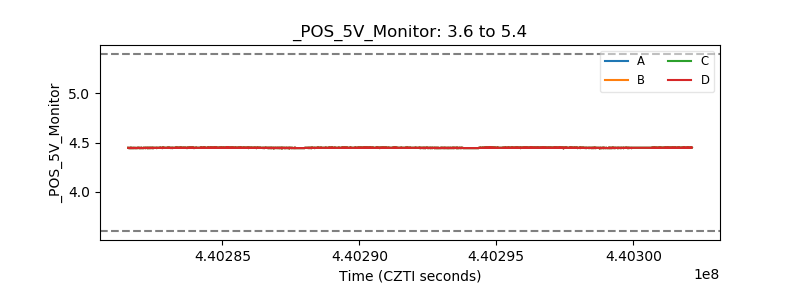 |
| _ROLL_ROT | 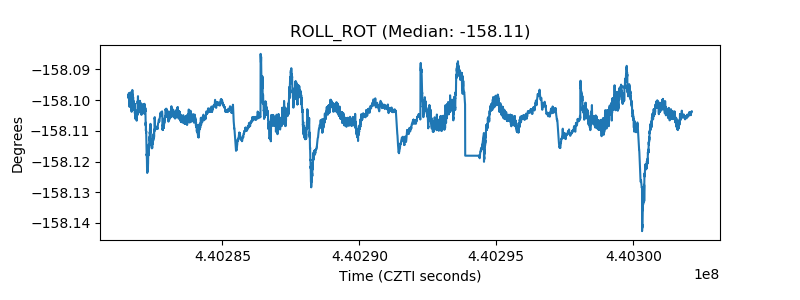 |
| _Roll_DEC | 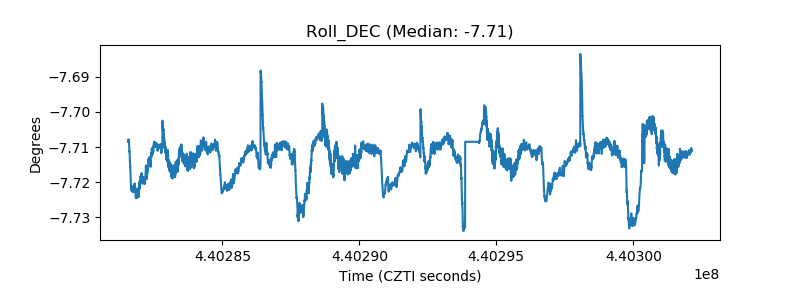 |
| _Roll_RA | 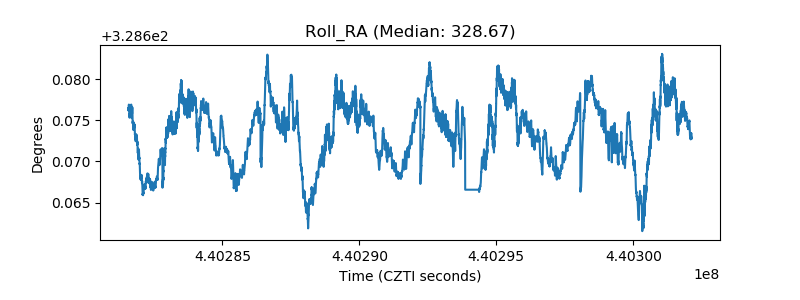 |
| Veto Counter | 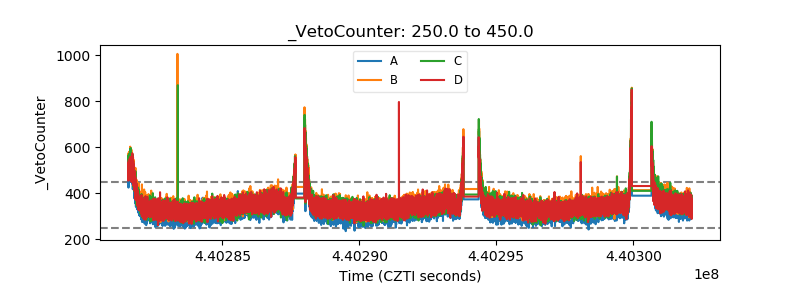 |