| Param | Original file | Final file |
|---|---|---|
| Filename | modeM0/AS1A13_008T08_9000005998_44411cztM0_level2.fits | modeM0/AS1A13_008T08_9000005998_44411cztM0_level2_quad_clean.evt |
| Size (bytes) | 508,363,200 | 105,269,760 |
| Size | 484.8 MB | 100.4 MB |
| Events in quadrant A | 4,879,990 | 707,150 |
| Events in quadrant B | 3,271,473 | 739,027 |
| Events in quadrant C | 3,463,345 | 702,072 |
| Events in quadrant D | 6,681,015 | 570,380 |
| Mode SS | |||
|---|---|---|---|
| Quadrant | BADHDUFLAG | Total packets | Discarded packets |
| A | 0 | 138 | 0 |
| B | 0 | 138 | 0 |
| C | 0 | 138 | 0 |
| D | 0 | 138 | 0 |
| Mode M0 | |||
|---|---|---|---|
| Quadrant | BADHDUFLAG | Total packets | Discarded packets |
| A | 0 | 20440 | 1 |
| B | 0 | 14177 | 2 |
| C | 0 | 15088 | 1 |
| D | 0 | 24455 | 1 |
| Mode M9 | |||
|---|---|---|---|
| Quadrant | BADHDUFLAG | Total packets | Discarded packets |
| A | 0 | 17 | 0 |
| B | 0 | 17 | 0 |
| C | 0 | 17 | 0 |
| D | 0 | 17 | 0 |
| Quadrant | Total seconds | Saturated seconds | Saturation percentage |
|---|---|---|---|
| A | 6723 | 155 | 2.305518% |
| B | 6723 | 95 | 1.413060% |
| C | 6723 | 161 | 2.394764% |
| D | 6723 | 1054 | 15.677525% |
Noise dominated data is calculated using 1-second bins in cleaned event files. If a bin has >2000 counts, and if more than 50% of those come from <1% of pixels, then it is considered to be noise-dominated and hence unusable.
| Quadrant | # 1 sec bins | Bins with >0 counts | Bins with >2000 counts | High rate bins dominated by noise | Noise dominated (total time) | Noise dominated (detector-on time) | Marked lightcurve |
|---|---|---|---|---|---|---|---|
| A | 8339 | 6726 | 4 | 4 | 0.05% | 0.06% | 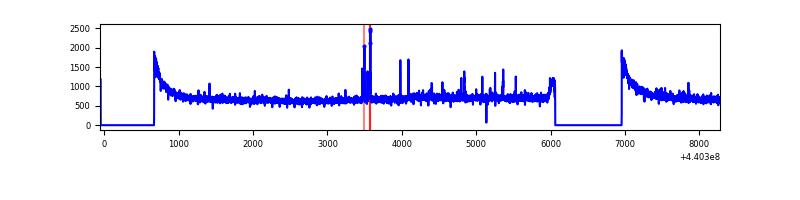 |
| B | 8339 | 6726 | 12 | 12 | 0.14% | 0.18% | 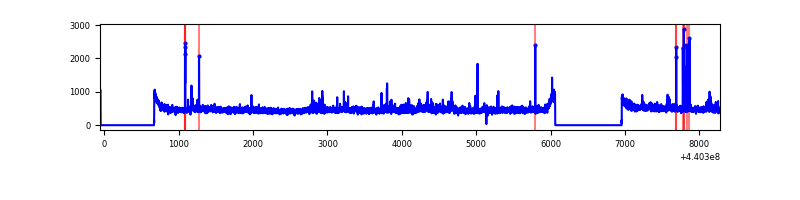 |
| C | 8339 | 6726 | 60 | 60 | 0.72% | 0.89% | 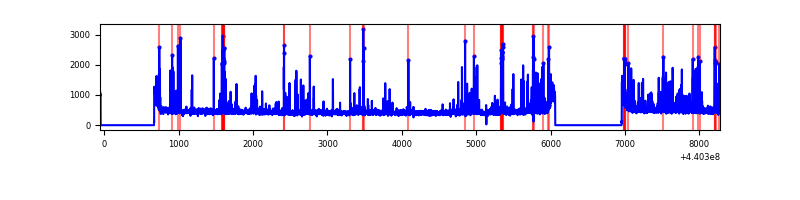 |
| D | 8339 | 6726 | 931 | 931 | 11.16% | 13.84% | 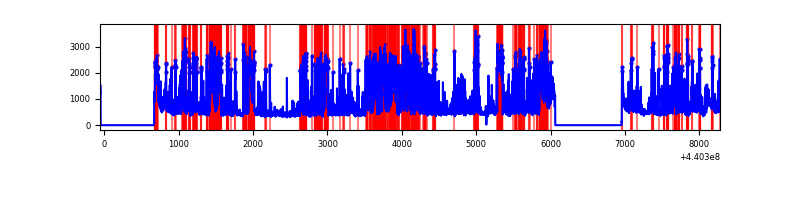 |
Top three noisy pixels from each quadrant. If the there are fewer than three noisy pixels in the level2.evt file, extra rows are filled as -1
| Pixel properties | Quadrant properties | ||||||
|---|---|---|---|---|---|---|---|
| Quadrant | DetID | PixID | Counts | Sigma | Mean | Median | Sigma |
| A | 10 | 83 | 1857652 | 11614.46 | 764 | 748 | 159.9 |
| A | 13 | 248 | 19231 | 115.61 | 764 | 748 | 159.9 |
| A | 0 | 243 | 19084 | 114.69 | 764 | 748 | 159.9 |
| B | 0 | 190 | 59247 | 379.33 | 767 | 744 | 154.2 |
| B | 5 | 255 | 49238 | 314.44 | 767 | 744 | 154.2 |
| B | 0 | 183 | 46142 | 294.36 | 767 | 744 | 154.2 |
| C | 12 | 16 | 278302 | 1565.0 | 749 | 754 | 177.3 |
| C | 14 | 254 | 231578 | 1301.54 | 749 | 754 | 177.3 |
| C | 3 | 233 | 16978 | 91.48 | 749 | 754 | 177.3 |
| D | 13 | 249 | 1252090 | 6963.86 | 706 | 686 | 179.7 |
| D | 2 | 249 | 761542 | 4234.04 | 706 | 686 | 179.7 |
| D | 8 | 240 | 534100 | 2968.36 | 706 | 686 | 179.7 |
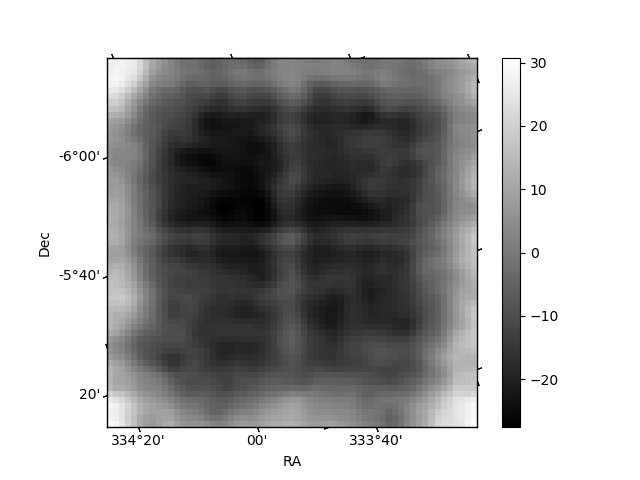
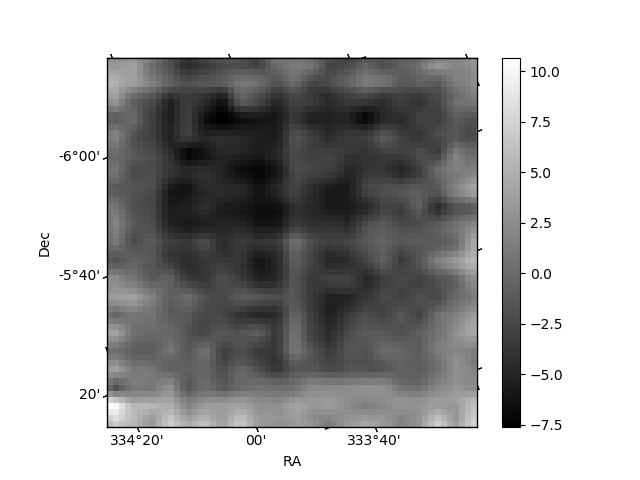
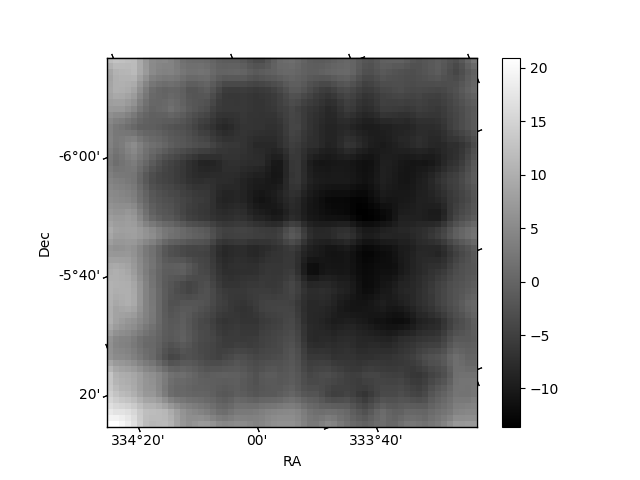
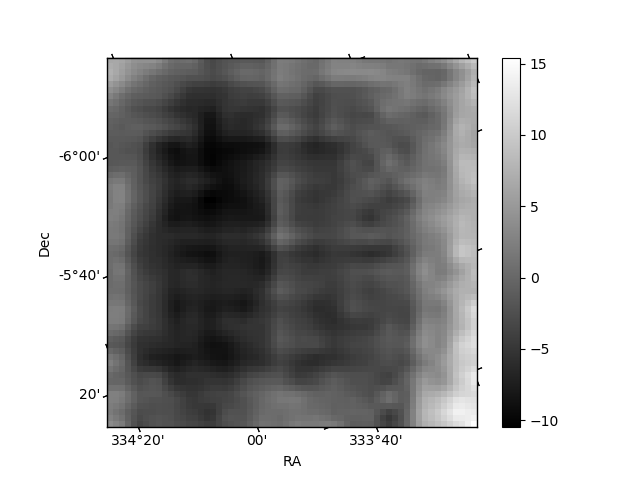
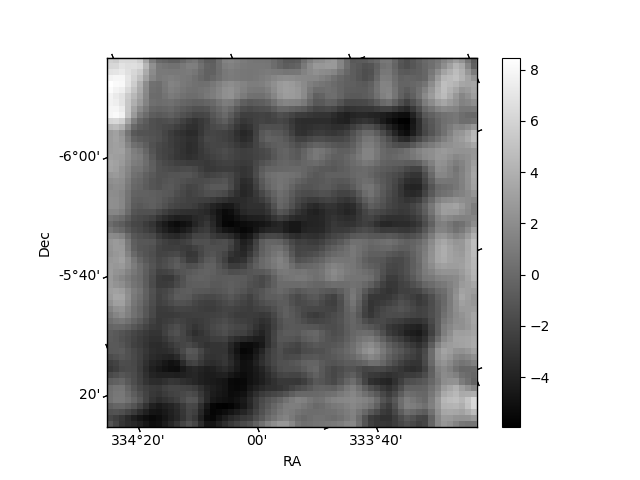
Histogram calculated using DETX and DETY for each event in the final _common_clean file
| Quadrant A | 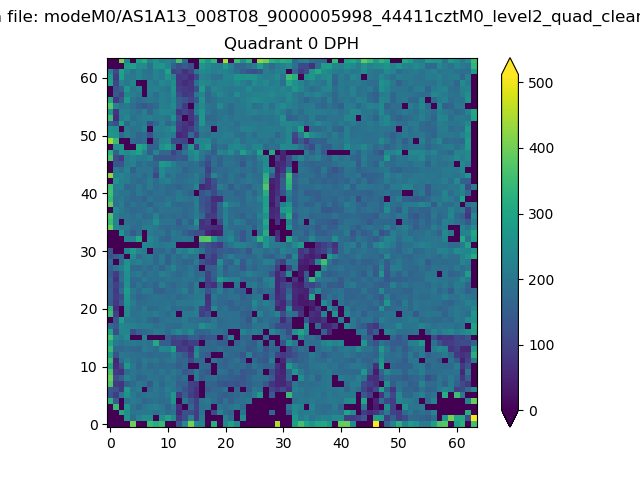 |
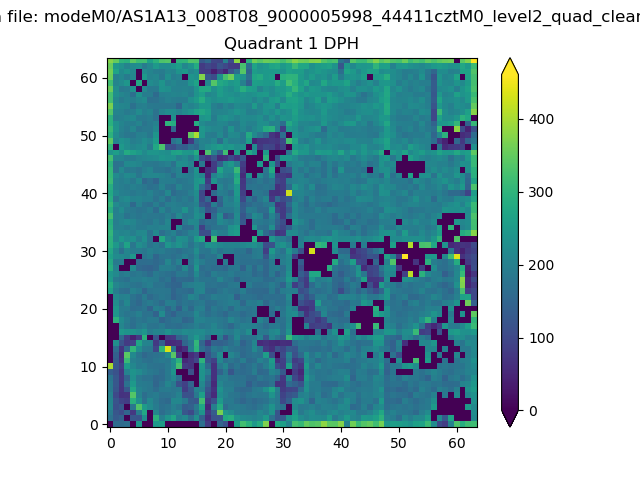 |
Quadrant B |
|---|---|---|---|
| Quadrant D |  |
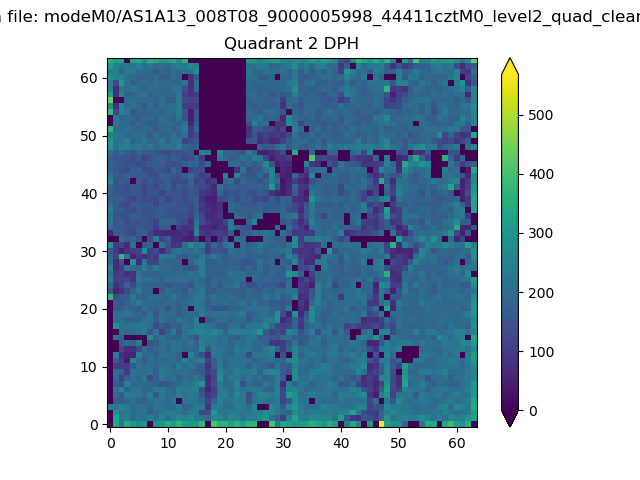 |
Quadrant C |
| Plot type | Count rate plots | Images |
|---|---|---|
| Comparison with Poisson distribution Blue bars denote a histogram of data divided into 1 sec bins. Red curve is a Poisson curve with rate = median count rate of data. |
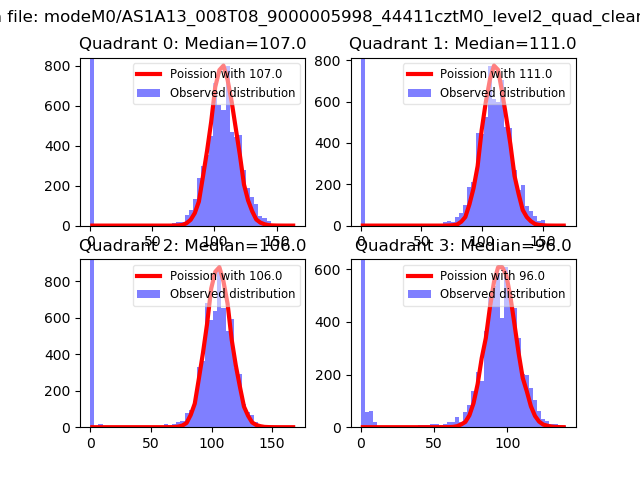 |
 |
| Quadrant-wise count rates Data is divided into 100 sec bins |
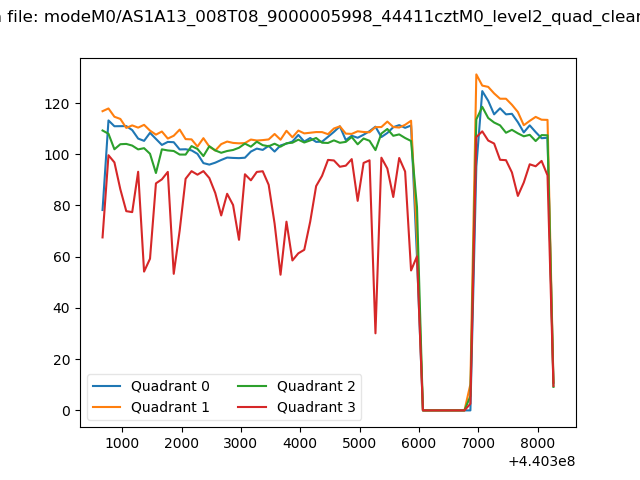 |
|
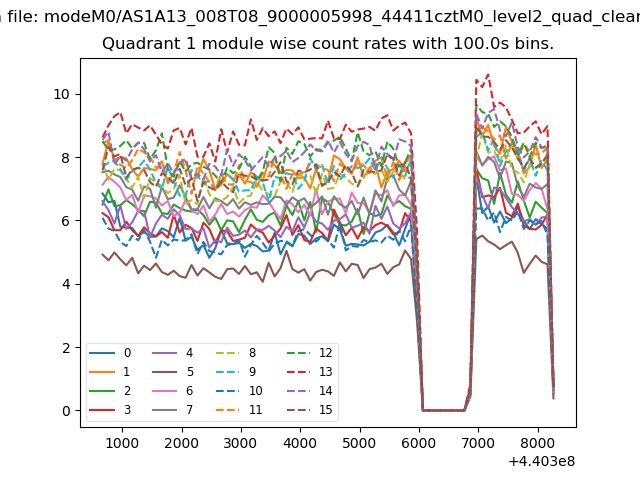
| Module-wise count rates for Quadrant A Data is divided into 100 sec bins |
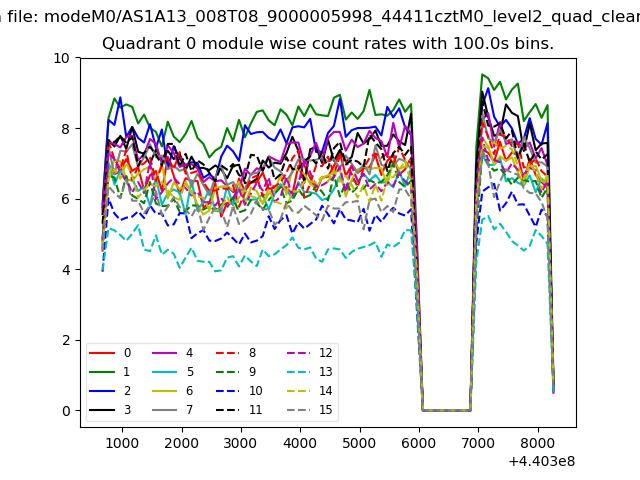 |
 |
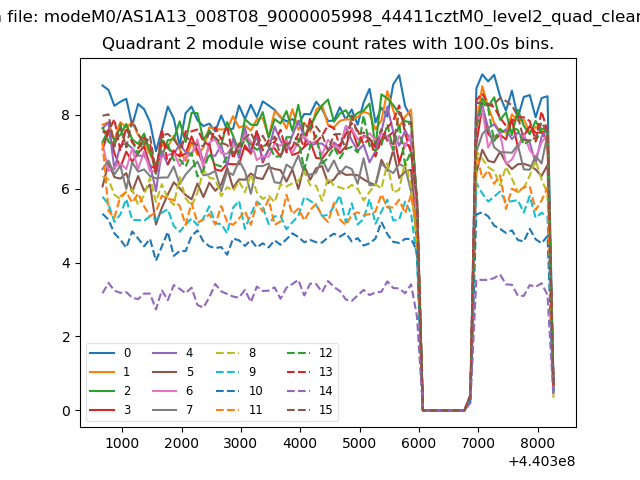
| Module-wise count rates for Quadrant B Data is divided into 100 sec bins |
 |
 |
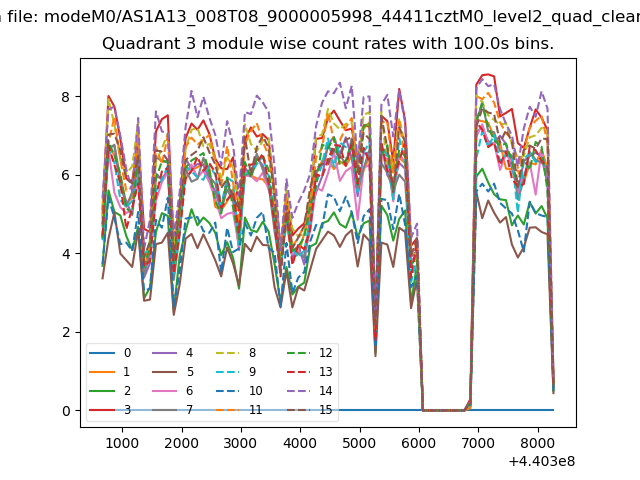
| Module-wise count rates for Quadrant C Data is divided into 100 sec bins |
 |
 |
| Module-wise count rates for Quadrant D Data is divided into 100 sec bins |
 |
 |
| Parameter | Plot |
|---|---|
| CZT HV Monitor |  |
| D_VDD | 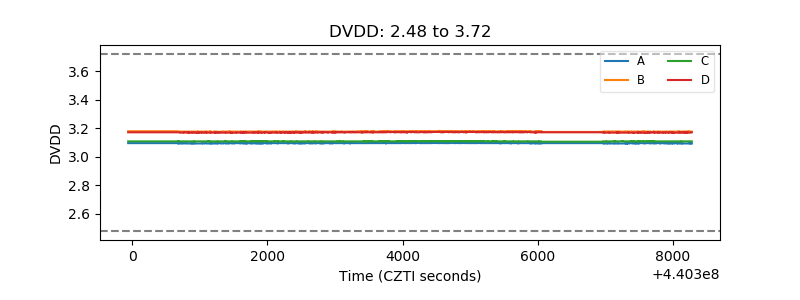 |
| Temperature 1 | 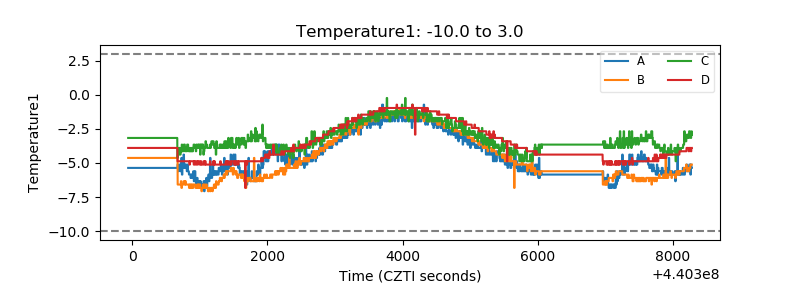 |
| Veto HV Monitor | 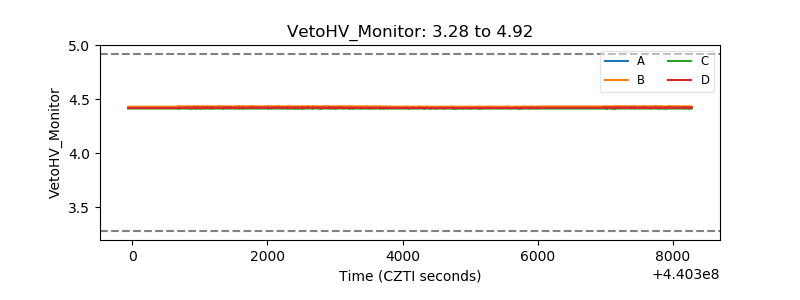 |
| Veto LLD | 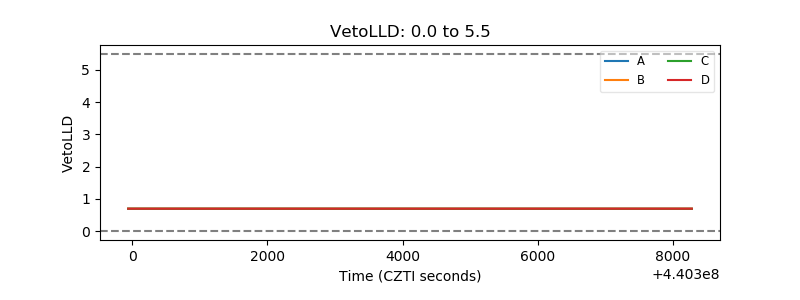 |
| Alpha Counter | 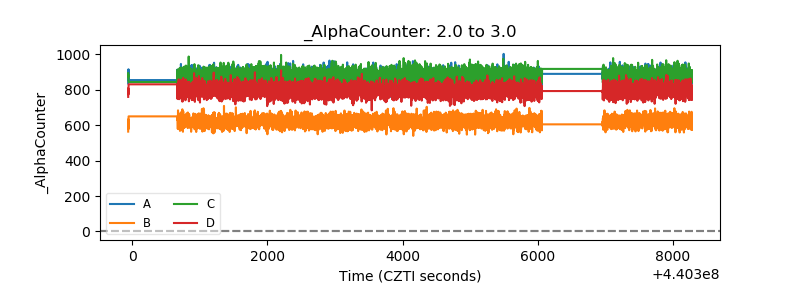 |
| _CPM_Rate | 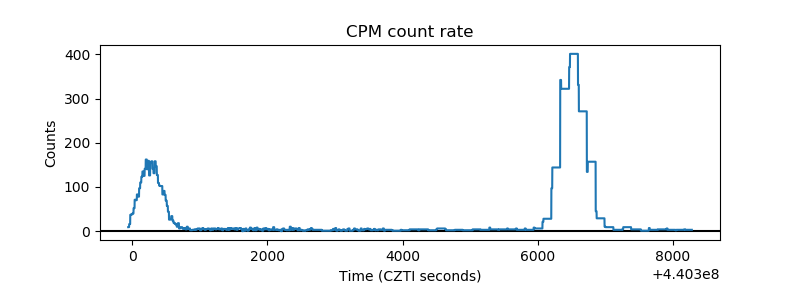 |
| CZT Counter | 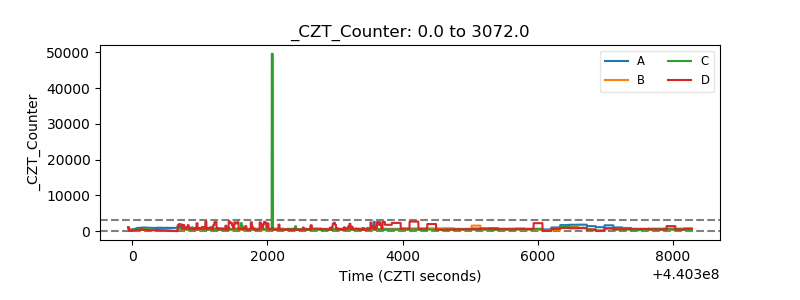 |
| +2.5 Volts monitor | 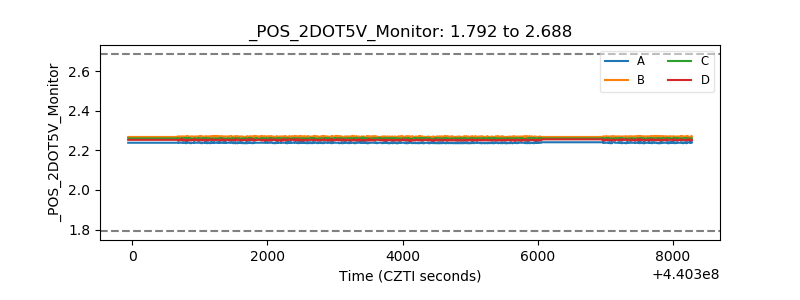 |
| +5 Volts monitor | 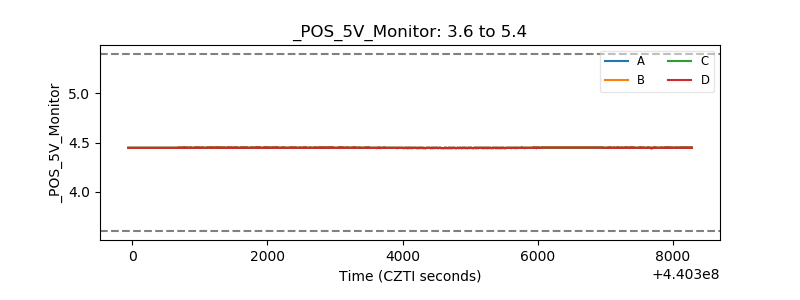 |
| _ROLL_ROT | 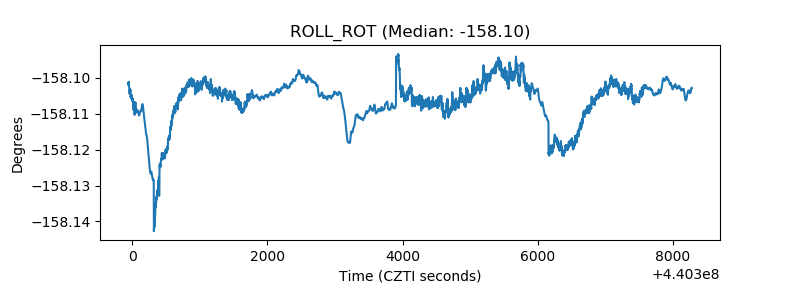 |
| _Roll_DEC | 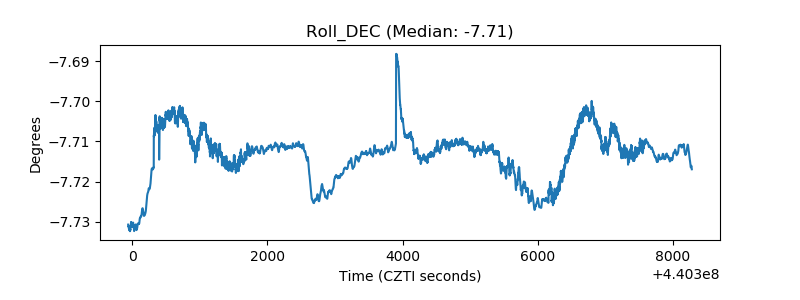 |
| _Roll_RA | 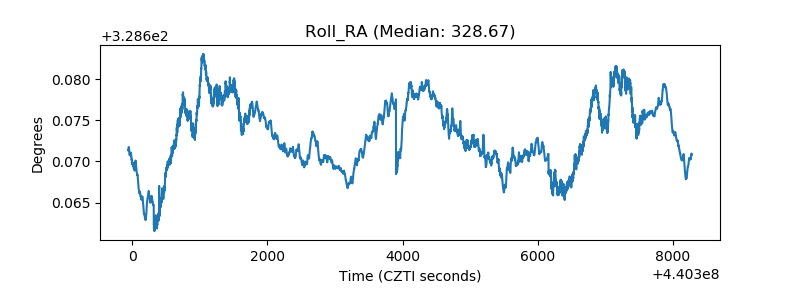 |
| Veto Counter | 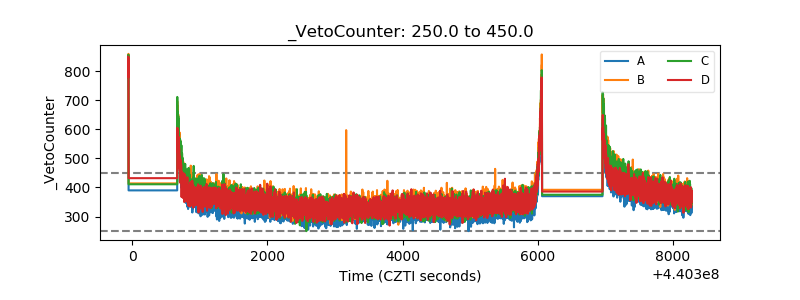 |