| Param | Original file | Final file |
|---|---|---|
| Filename | modeM0/AS1A13_008T08_9000005998_44413cztM0_level2.fits | modeM0/AS1A13_008T08_9000005998_44413cztM0_level2_quad_clean.evt |
| Size (bytes) | 517,760,640 | 107,369,280 |
| Size | 493.8 MB | 102.4 MB |
| Events in quadrant A | 4,885,315 | 727,090 |
| Events in quadrant B | 3,393,486 | 760,468 |
| Events in quadrant C | 3,604,488 | 721,900 |
| Events in quadrant D | 6,767,365 | 579,105 |
| Mode SS | |||
|---|---|---|---|
| Quadrant | BADHDUFLAG | Total packets | Discarded packets |
| A | 0 | 136 | 0 |
| B | 0 | 136 | 0 |
| C | 0 | 136 | 0 |
| D | 0 | 136 | 0 |
| Mode M0 | |||
|---|---|---|---|
| Quadrant | BADHDUFLAG | Total packets | Discarded packets |
| A | 0 | 20380 | 1 |
| B | 0 | 14337 | 1 |
| C | 0 | 15181 | 1 |
| D | 0 | 24668 | 1 |
| Mode M9 | |||
|---|---|---|---|
| Quadrant | BADHDUFLAG | Total packets | Discarded packets |
| A | 0 | 19 | 0 |
| B | 0 | 19 | 0 |
| C | 0 | 19 | 0 |
| D | 0 | 19 | 0 |
| Quadrant | Total seconds | Saturated seconds | Saturation percentage |
|---|---|---|---|
| A | 6636 | 192 | 2.893309% |
| B | 6636 | 121 | 1.823388% |
| C | 6637 | 146 | 2.199789% |
| D | 6637 | 1059 | 15.956004% |
Noise dominated data is calculated using 1-second bins in cleaned event files. If a bin has >2000 counts, and if more than 50% of those come from <1% of pixels, then it is considered to be noise-dominated and hence unusable.
| Quadrant | # 1 sec bins | Bins with >0 counts | Bins with >2000 counts | High rate bins dominated by noise | Noise dominated (total time) | Noise dominated (detector-on time) | Marked lightcurve |
|---|---|---|---|---|---|---|---|
| A | 8531 | 6638 | 3 | 3 | 0.04% | 0.05% | 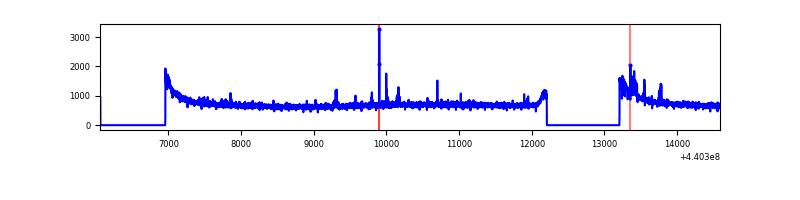 |
| B | 8531 | 6638 | 12 | 12 | 0.14% | 0.18% | 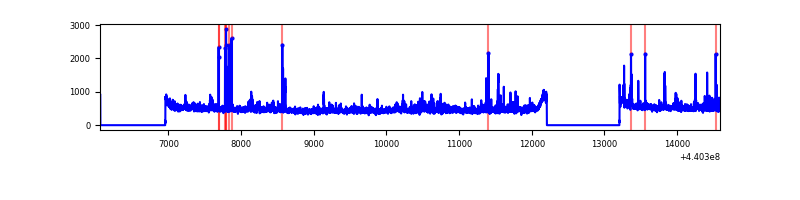 |
| C | 8532 | 6639 | 45 | 45 | 0.53% | 0.68% | 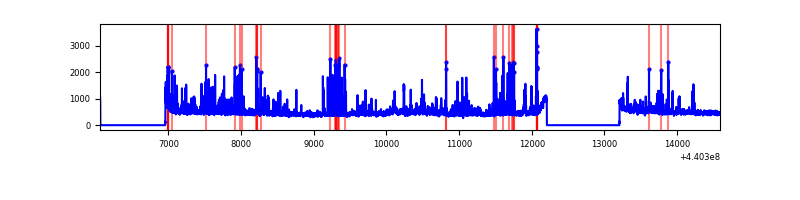 |
| D | 8532 | 6639 | 904 | 904 | 10.60% | 13.62% | 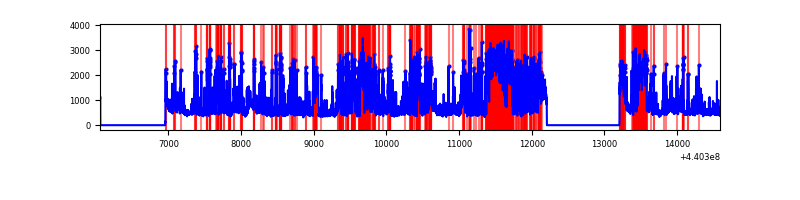 |
Top three noisy pixels from each quadrant. If the there are fewer than three noisy pixels in the level2.evt file, extra rows are filled as -1
| Pixel properties | Quadrant properties | ||||||
|---|---|---|---|---|---|---|---|
| Quadrant | DetID | PixID | Counts | Sigma | Mean | Median | Sigma |
| A | 10 | 83 | 1822884 | 11381.48 | 774 | 758 | 160.1 |
| A | 13 | 248 | 58427 | 360.22 | 774 | 758 | 160.1 |
| A | 0 | 243 | 8929 | 51.04 | 774 | 758 | 160.1 |
| B | 0 | 190 | 103853 | 666.9 | 775 | 751 | 154.6 |
| B | 5 | 255 | 98756 | 633.93 | 775 | 751 | 154.6 |
| B | 0 | 183 | 46625 | 296.73 | 775 | 751 | 154.6 |
| C | 14 | 254 | 293708 | 1636.31 | 757 | 760 | 179.0 |
| C | 12 | 16 | 207560 | 1155.11 | 757 | 760 | 179.0 |
| C | 3 | 233 | 125849 | 698.7 | 757 | 760 | 179.0 |
| D | 5 | 235 | 1419200 | 7956.49 | 706 | 685 | 178.3 |
| D | 2 | 249 | 808921 | 4533.42 | 706 | 685 | 178.3 |
| D | 13 | 249 | 643957 | 3608.13 | 706 | 685 | 178.3 |
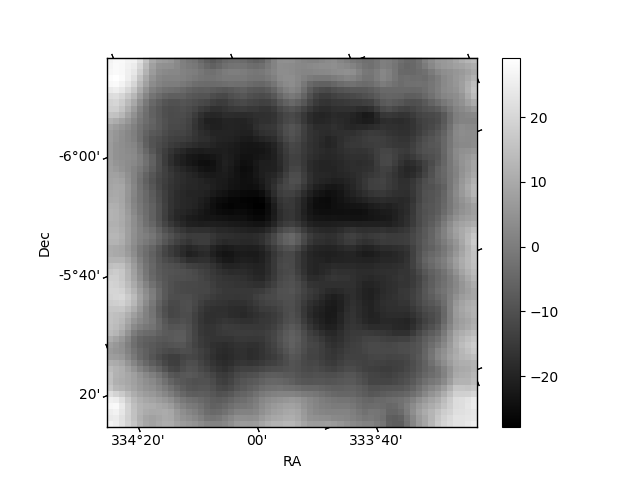
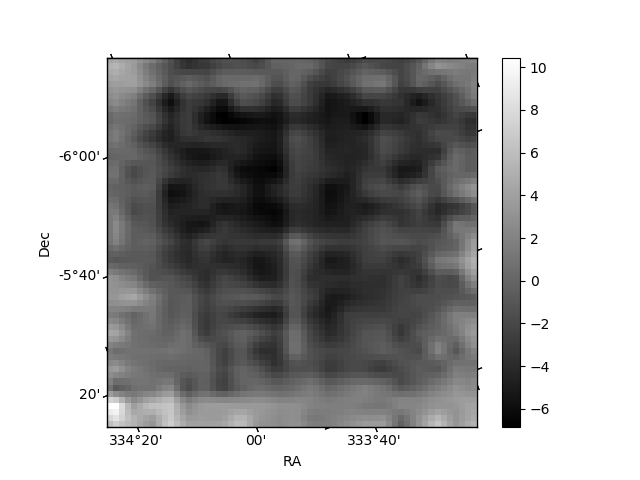
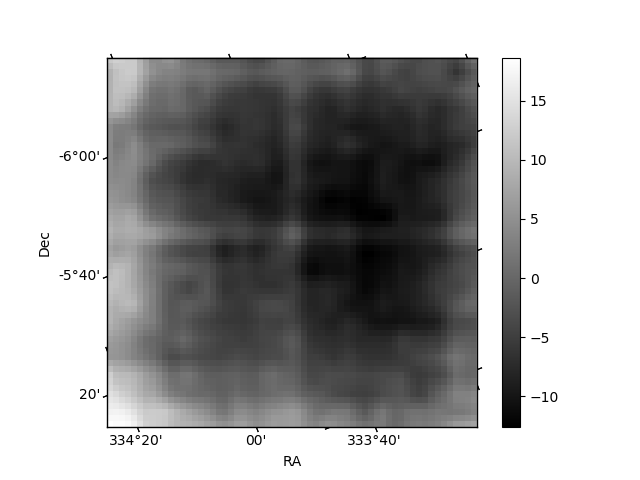
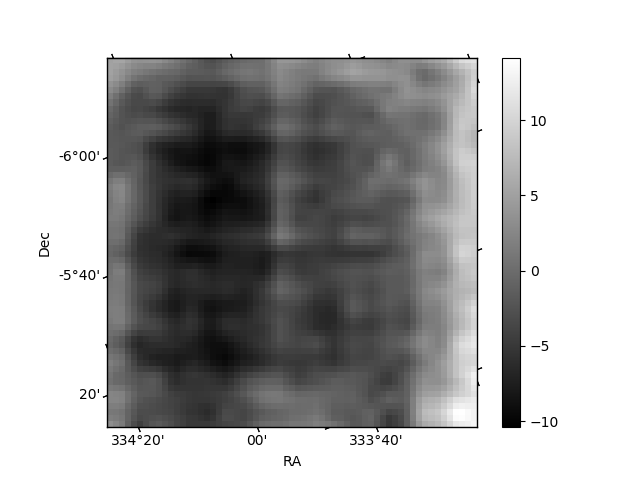
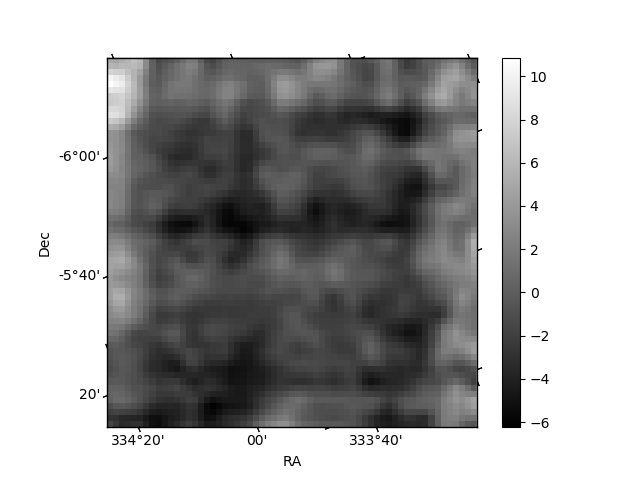
Histogram calculated using DETX and DETY for each event in the final _common_clean file
| Quadrant A | 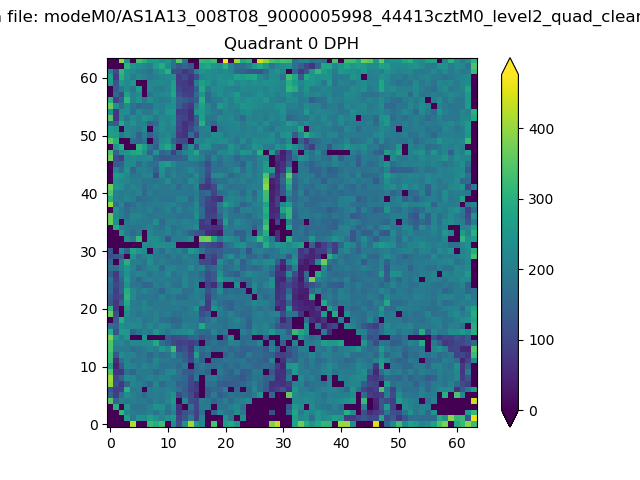 |
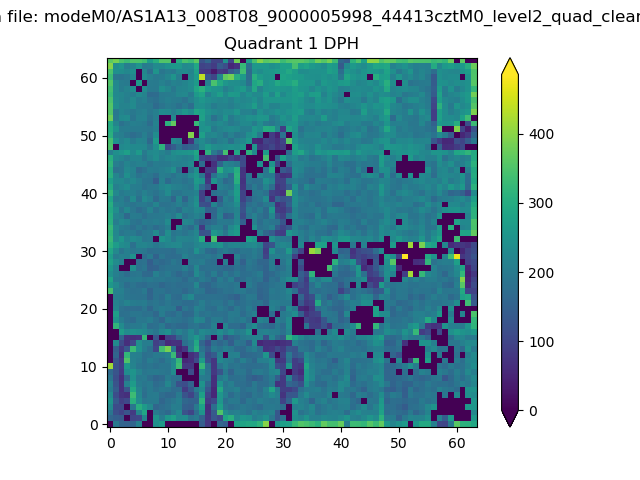 |
Quadrant B |
|---|---|---|---|
| Quadrant D | 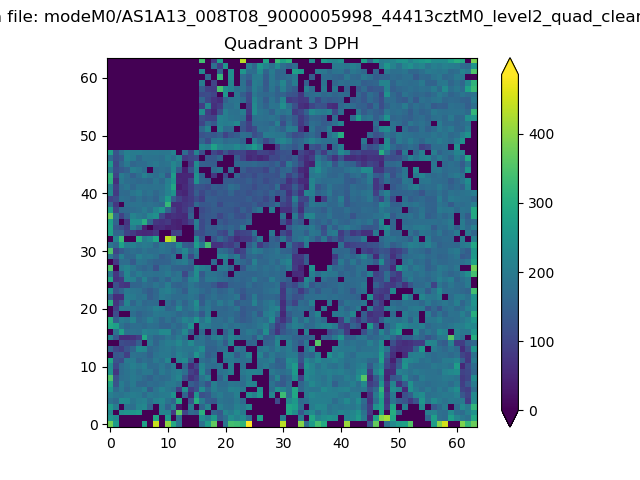 |
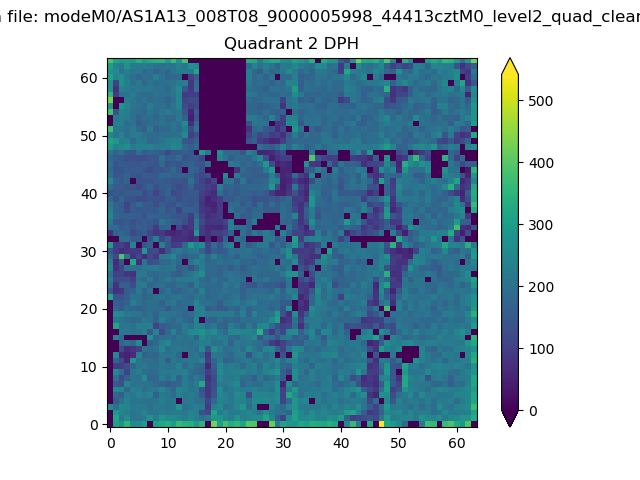 |
Quadrant C |
| Plot type | Count rate plots | Images |
|---|---|---|
| Comparison with Poisson distribution Blue bars denote a histogram of data divided into 1 sec bins. Red curve is a Poisson curve with rate = median count rate of data. |
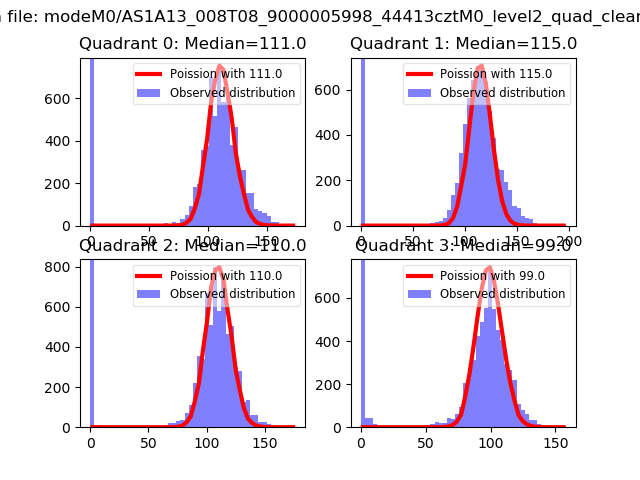 |
 |
| Quadrant-wise count rates Data is divided into 100 sec bins |
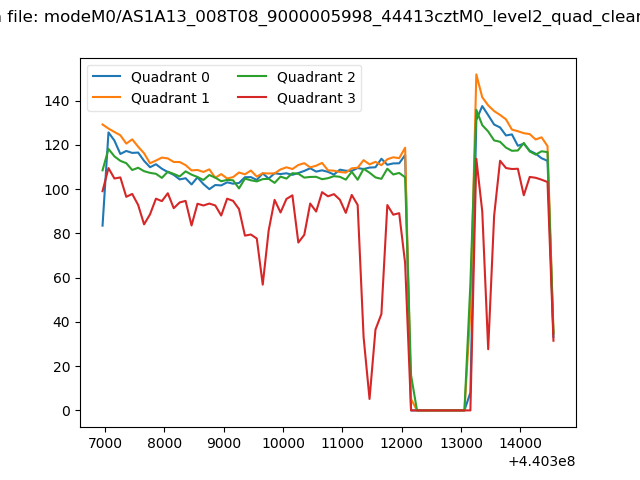 |
|
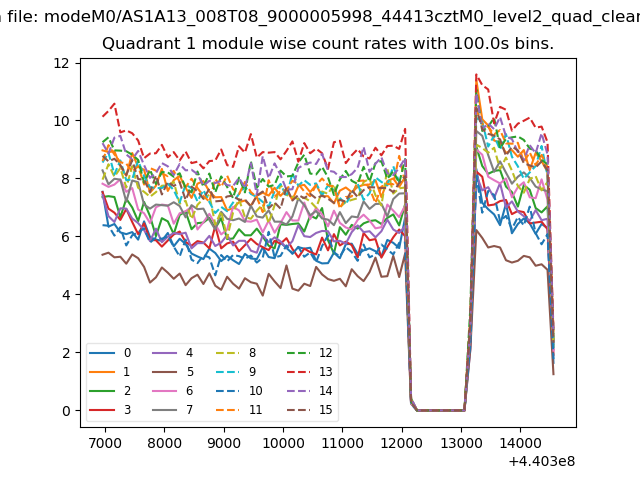
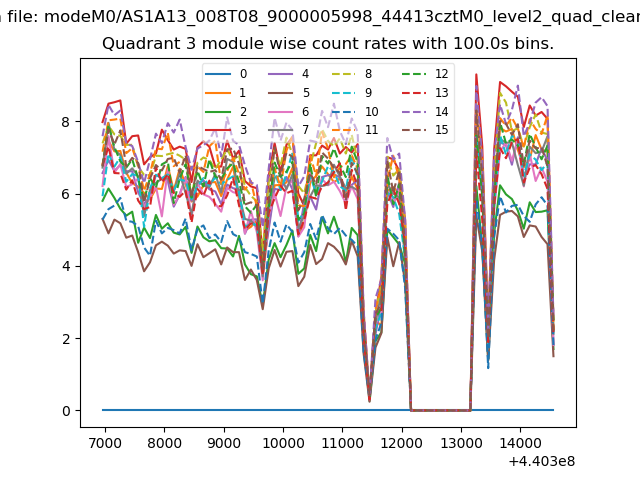
| Module-wise count rates for Quadrant A Data is divided into 100 sec bins |
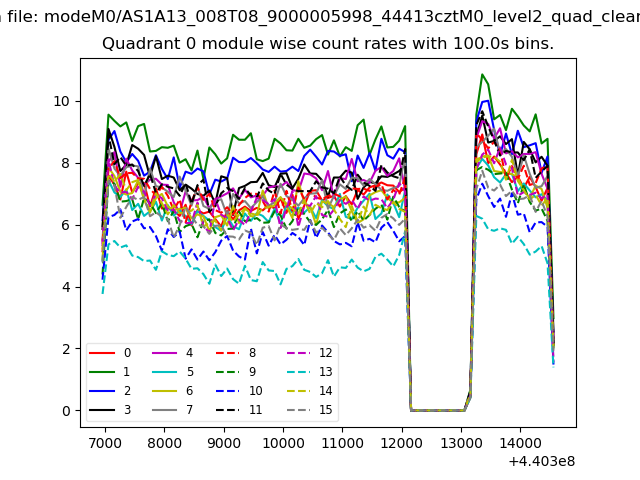 |
 |
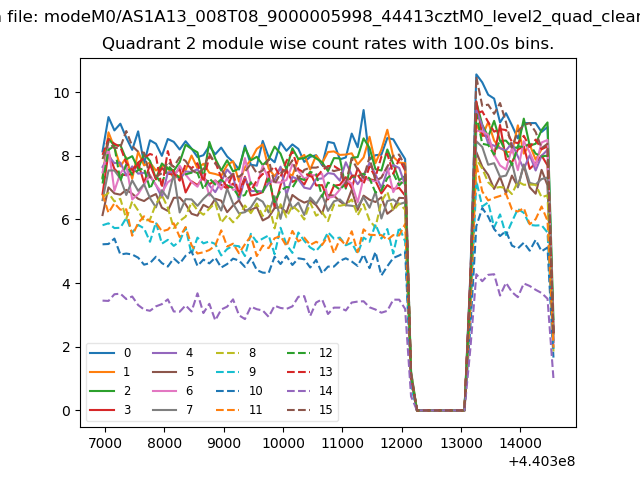
| Module-wise count rates for Quadrant B Data is divided into 100 sec bins |
 |
 |
| Module-wise count rates for Quadrant C Data is divided into 100 sec bins |
 |
 |
| Module-wise count rates for Quadrant D Data is divided into 100 sec bins |
 |
 |
| Parameter | Plot |
|---|---|
| CZT HV Monitor | 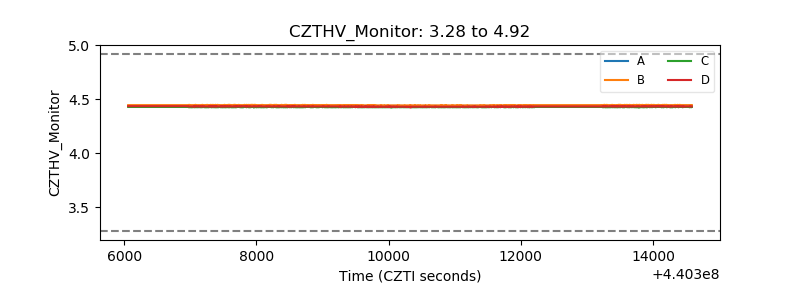 |
| D_VDD | 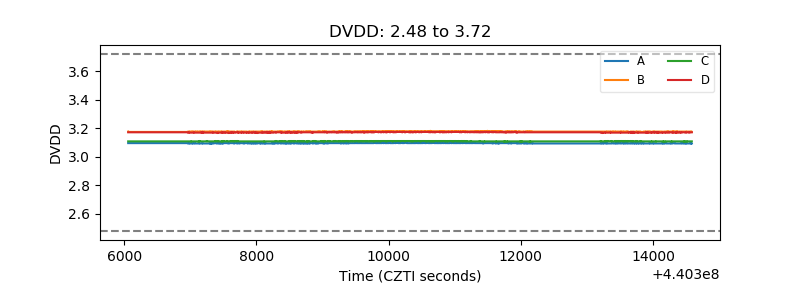 |
| Temperature 1 | 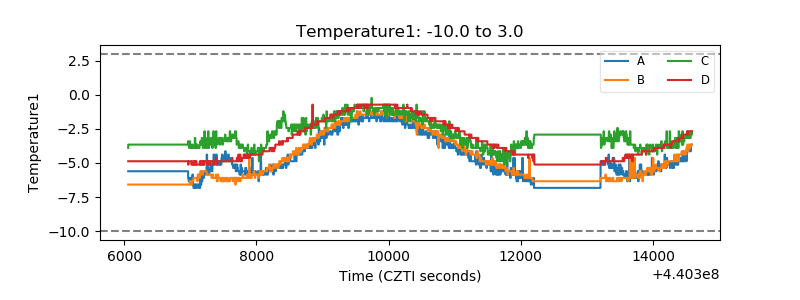 |
| Veto HV Monitor | 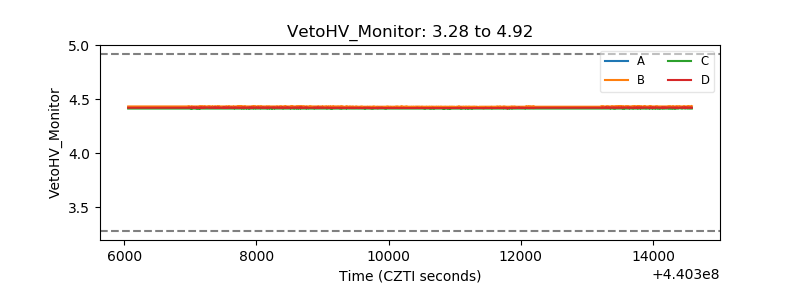 |
| Veto LLD | 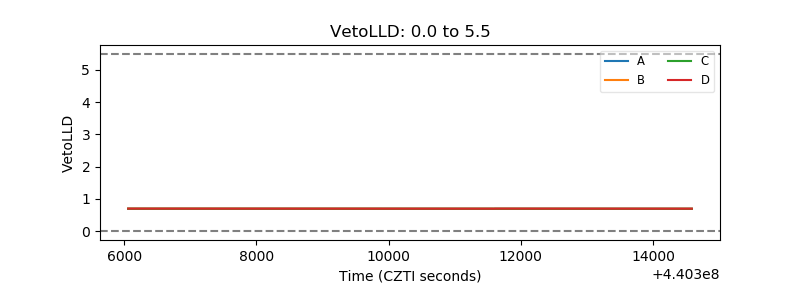 |
| Alpha Counter | 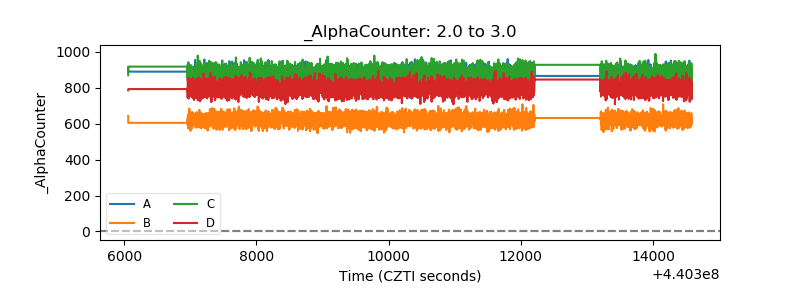 |
| _CPM_Rate | 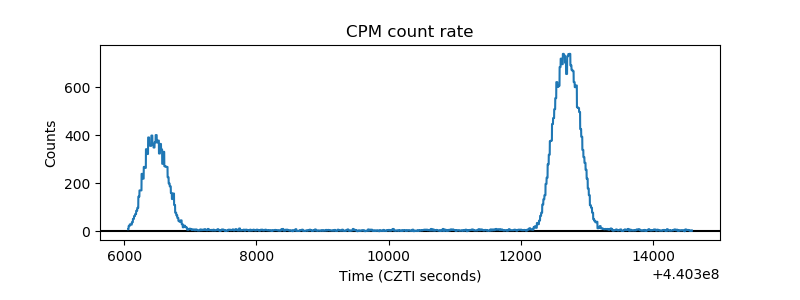 |
| CZT Counter |  |
| +2.5 Volts monitor | 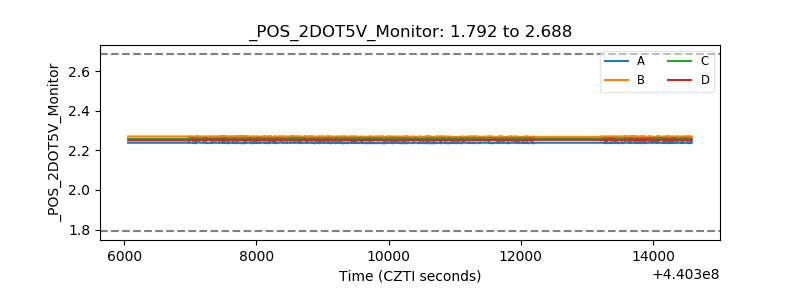 |
| +5 Volts monitor | 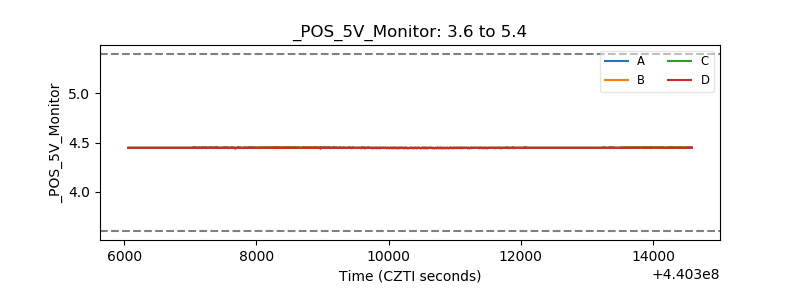 |
| _ROLL_ROT | 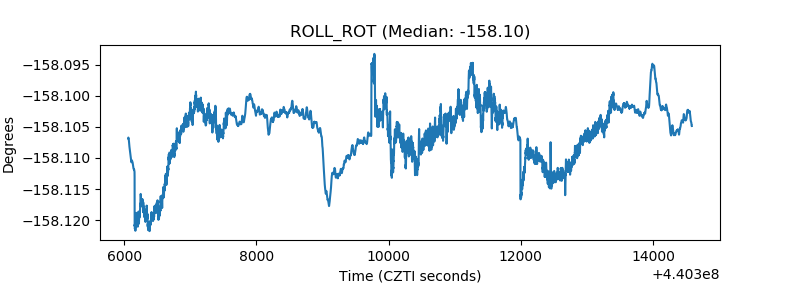 |
| _Roll_DEC | 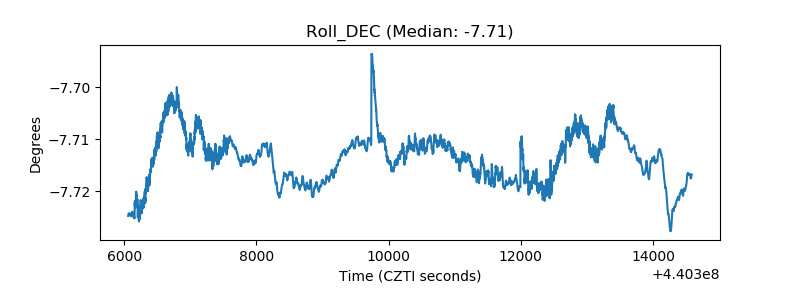 |
| _Roll_RA | 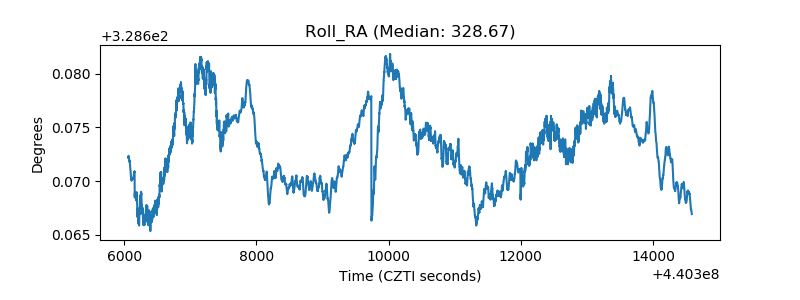 |
| Veto Counter | 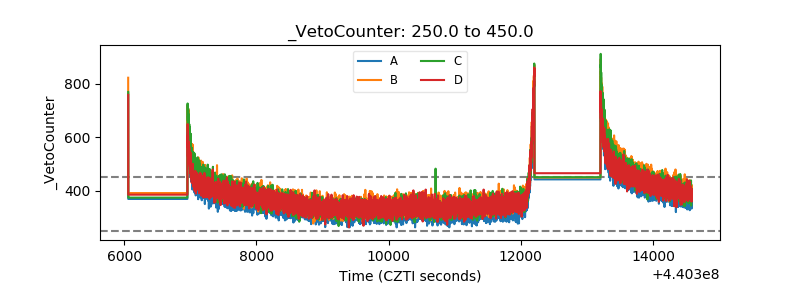 |