| Param | Original file | Final file |
|---|---|---|
| Filename | modeM0/AS1A13_008T08_9000005998_44414cztM0_level2.fits | modeM0/AS1A13_008T08_9000005998_44414cztM0_level2_quad_clean.evt |
| Size (bytes) | 497,335,680 | 107,357,760 |
| Size | 474.3 MB | 102.4 MB |
| Events in quadrant A | 4,743,420 | 741,591 |
| Events in quadrant B | 3,319,543 | 769,518 |
| Events in quadrant C | 3,263,111 | 729,344 |
| Events in quadrant D | 6,591,357 | 568,499 |
| Mode SS | |||
|---|---|---|---|
| Quadrant | BADHDUFLAG | Total packets | Discarded packets |
| A | 0 | 126 | 0 |
| B | 0 | 126 | 0 |
| C | 0 | 126 | 0 |
| D | 0 | 126 | 0 |
| Mode M0 | |||
|---|---|---|---|
| Quadrant | BADHDUFLAG | Total packets | Discarded packets |
| A | 0 | 19645 | 1 |
| B | 0 | 13832 | 1 |
| C | 0 | 13981 | 1 |
| D | 0 | 23925 | 1 |
| Mode M9 | |||
|---|---|---|---|
| Quadrant | BADHDUFLAG | Total packets | Discarded packets |
| A | 0 | 12 | 0 |
| B | 0 | 12 | 0 |
| C | 0 | 12 | 0 |
| D | 0 | 12 | 0 |
| Quadrant | Total seconds | Saturated seconds | Saturation percentage |
|---|---|---|---|
| A | 6341 | 143 | 2.255165% |
| B | 6342 | 110 | 1.734469% |
| C | 6342 | 87 | 1.371807% |
| D | 6342 | 1146 | 18.070009% |
Noise dominated data is calculated using 1-second bins in cleaned event files. If a bin has >2000 counts, and if more than 50% of those come from <1% of pixels, then it is considered to be noise-dominated and hence unusable.
| Quadrant | # 1 sec bins | Bins with >0 counts | Bins with >2000 counts | High rate bins dominated by noise | Noise dominated (total time) | Noise dominated (detector-on time) | Marked lightcurve |
|---|---|---|---|---|---|---|---|
| A | 7461 | 6342 | 4 | 4 | 0.05% | 0.06% | 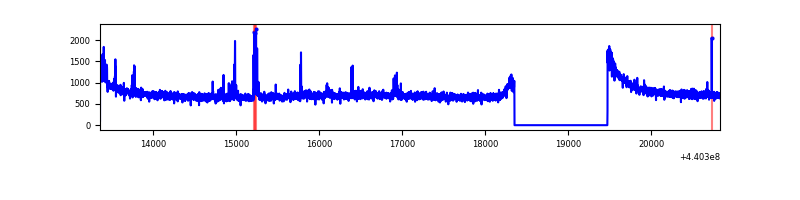 |
| B | 7462 | 6343 | 24 | 24 | 0.32% | 0.38% | 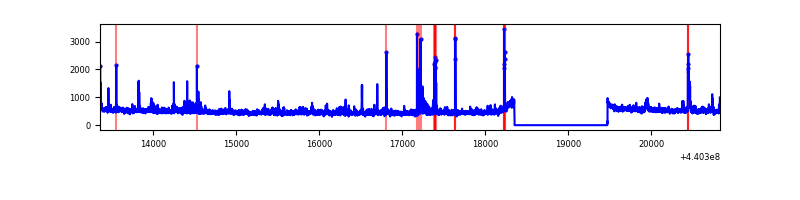 |
| C | 7462 | 6343 | 38 | 38 | 0.51% | 0.60% | 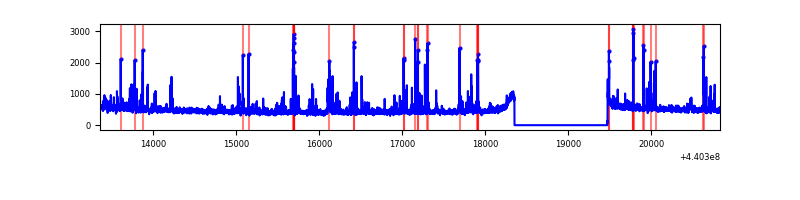 |
| D | 7462 | 6343 | 1016 | 1016 | 13.62% | 16.02% | 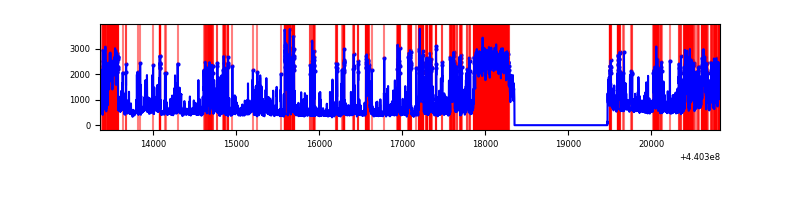 |
Top three noisy pixels from each quadrant. If the there are fewer than three noisy pixels in the level2.evt file, extra rows are filled as -1
| Pixel properties | Quadrant properties | ||||||
|---|---|---|---|---|---|---|---|
| Quadrant | DetID | PixID | Counts | Sigma | Mean | Median | Sigma |
| A | 10 | 83 | 1674479 | 10679.54 | 761 | 746 | 156.7 |
| A | 13 | 248 | 74868 | 472.95 | 761 | 746 | 156.7 |
| A | 10 | 248 | 23072 | 142.45 | 761 | 746 | 156.7 |
| B | 0 | 190 | 90851 | 603.18 | 756 | 737 | 149.4 |
| B | 5 | 255 | 87041 | 577.67 | 756 | 737 | 149.4 |
| B | 4 | 170 | 59900 | 396.01 | 756 | 737 | 149.4 |
| C | 14 | 254 | 335932 | 1937.37 | 736 | 741 | 173.0 |
| C | 12 | 16 | 30600 | 172.58 | 736 | 741 | 173.0 |
| C | 3 | 233 | 19447 | 108.12 | 736 | 741 | 173.0 |
| D | 12 | 17 | 1740780 | 10318.46 | 675 | 656 | 168.6 |
| D | 5 | 235 | 566953 | 3357.99 | 675 | 656 | 168.6 |
| D | 2 | 249 | 547724 | 3243.96 | 675 | 656 | 168.6 |
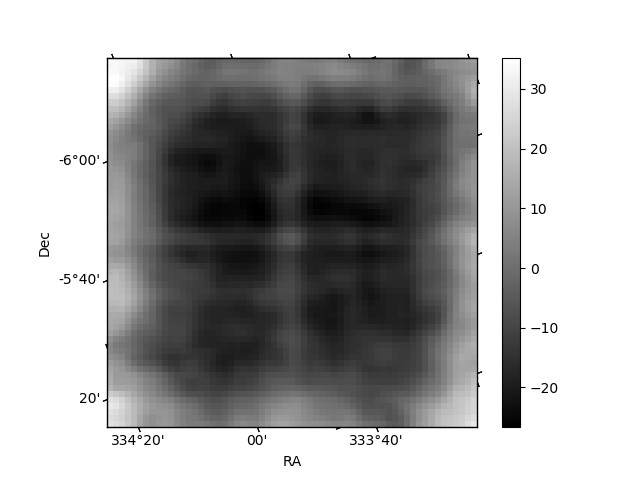
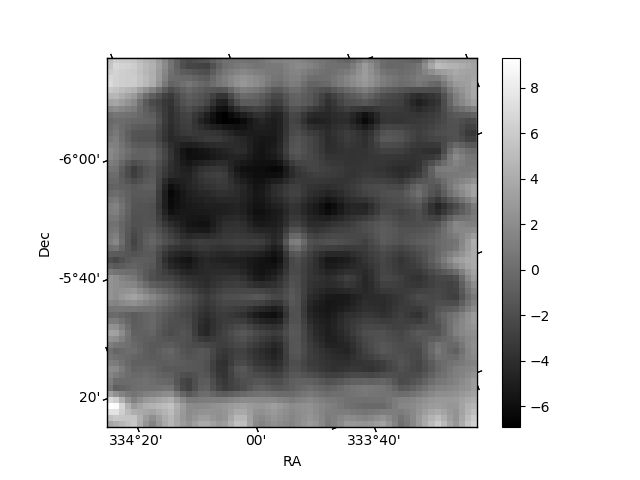
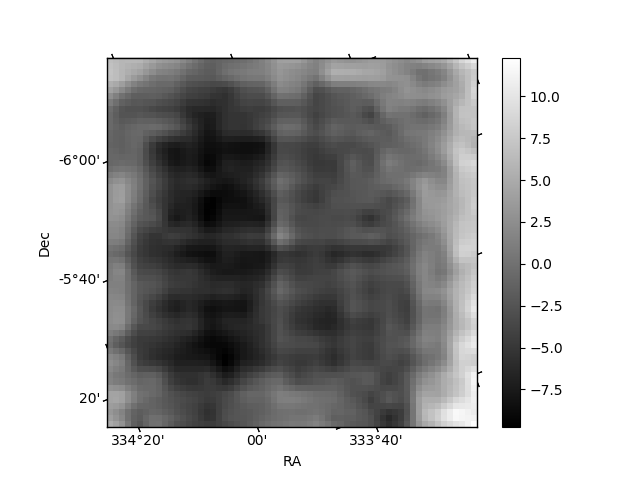
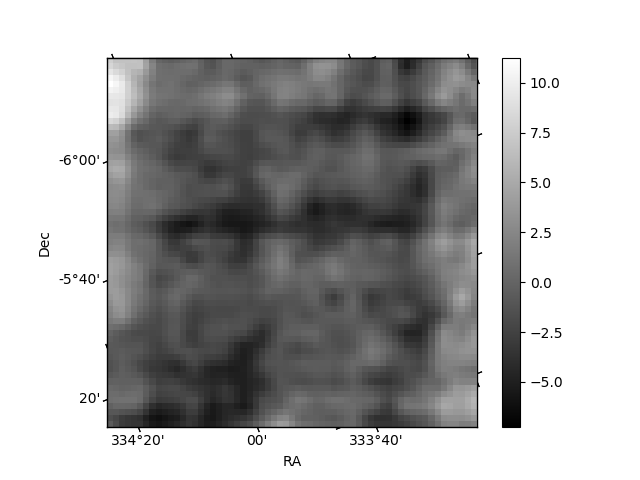
Histogram calculated using DETX and DETY for each event in the final _common_clean file
| Quadrant A | 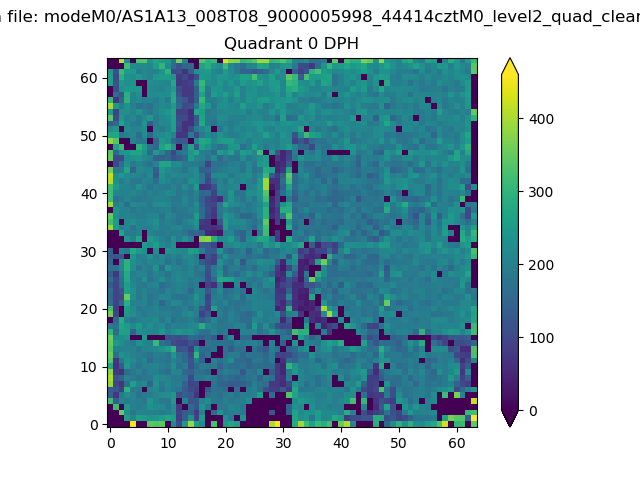 |
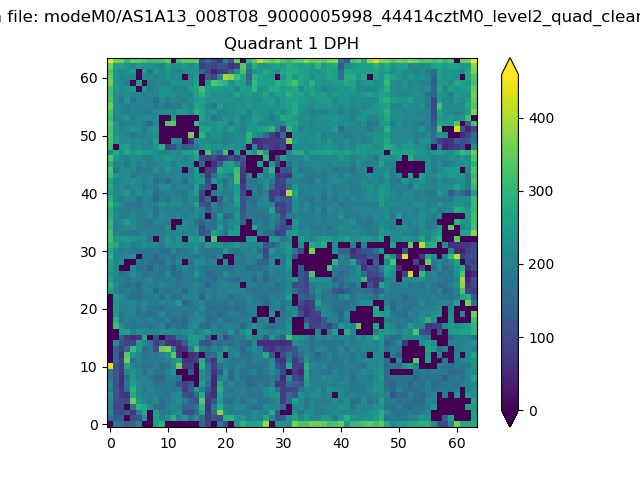 |
Quadrant B |
|---|---|---|---|
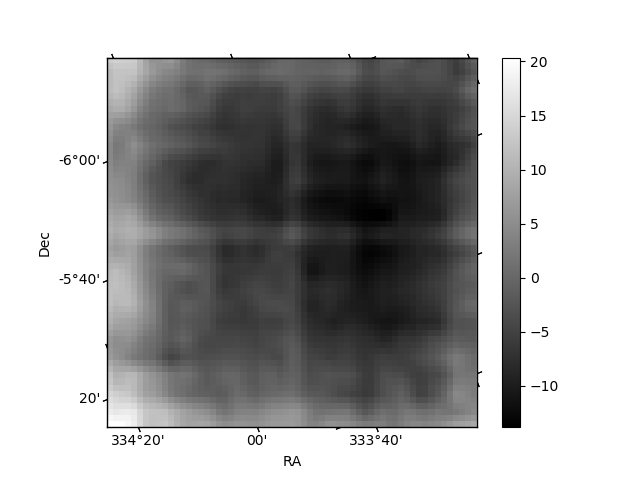
| Quadrant D | 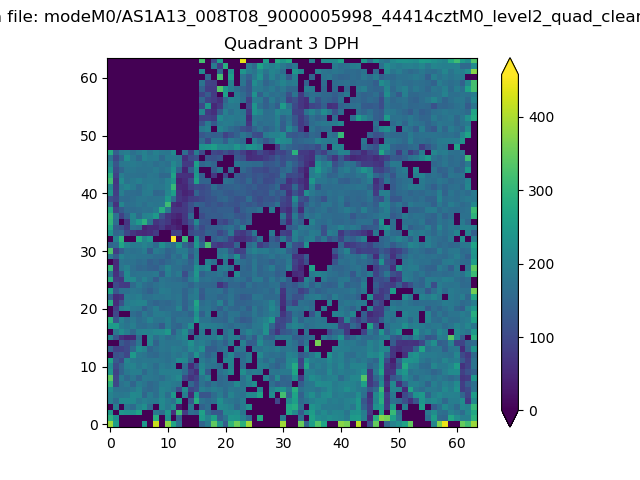 |
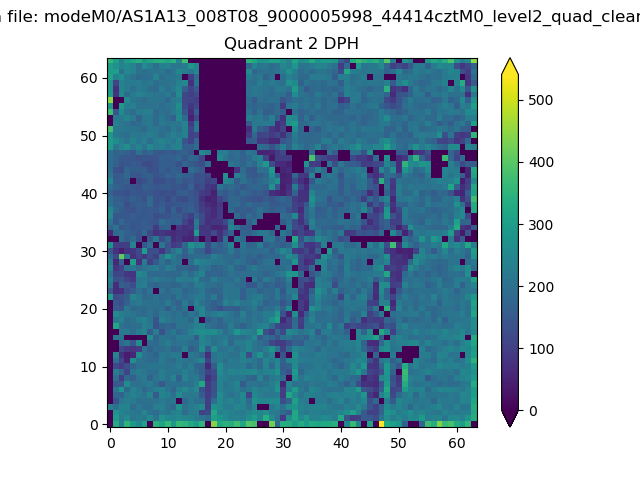 |
Quadrant C |
| Plot type | Count rate plots | Images |
|---|---|---|
| Comparison with Poisson distribution Blue bars denote a histogram of data divided into 1 sec bins. Red curve is a Poisson curve with rate = median count rate of data. |
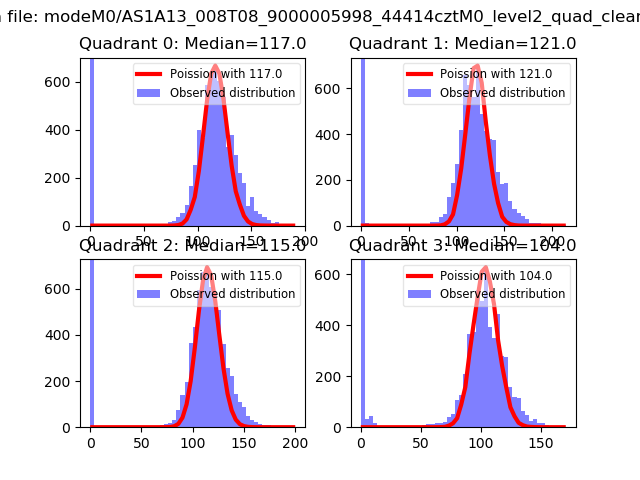 |
 |
| Quadrant-wise count rates Data is divided into 100 sec bins |
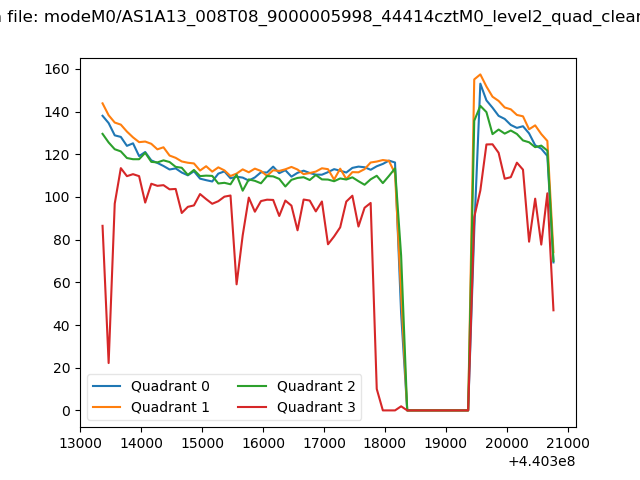 |
|
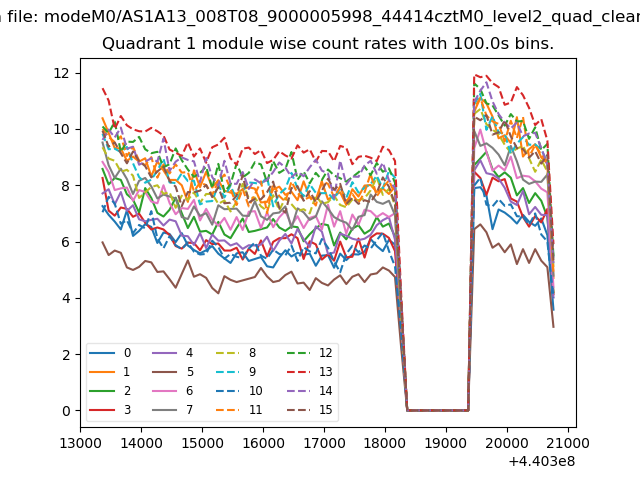
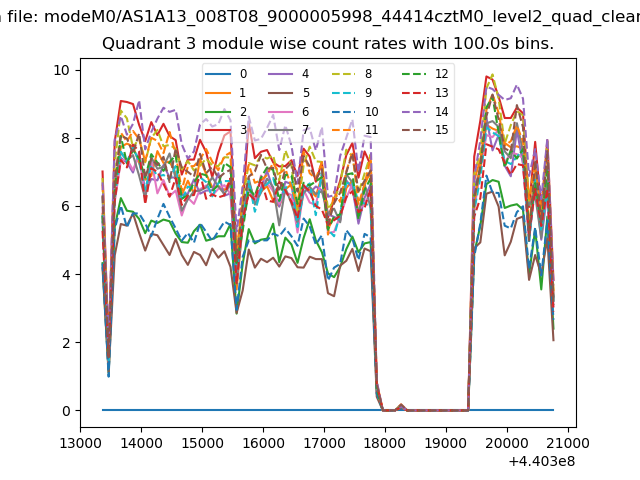
| Module-wise count rates for Quadrant A Data is divided into 100 sec bins |
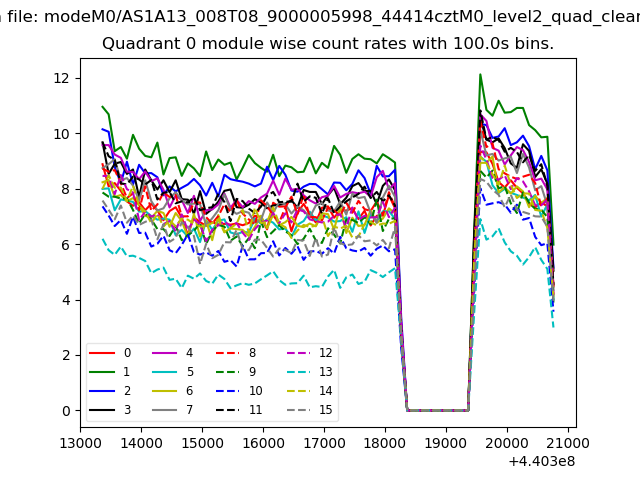 |
 |
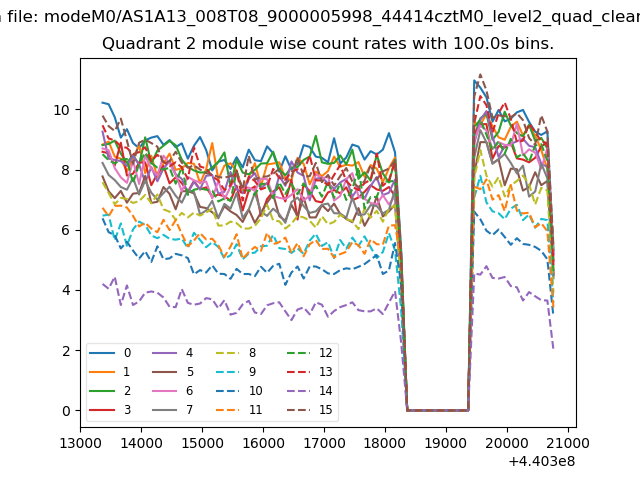
| Module-wise count rates for Quadrant B Data is divided into 100 sec bins |
 |
 |
| Module-wise count rates for Quadrant C Data is divided into 100 sec bins |
 |
 |
| Module-wise count rates for Quadrant D Data is divided into 100 sec bins |
 |
 |
| Parameter | Plot |
|---|---|
| CZT HV Monitor | 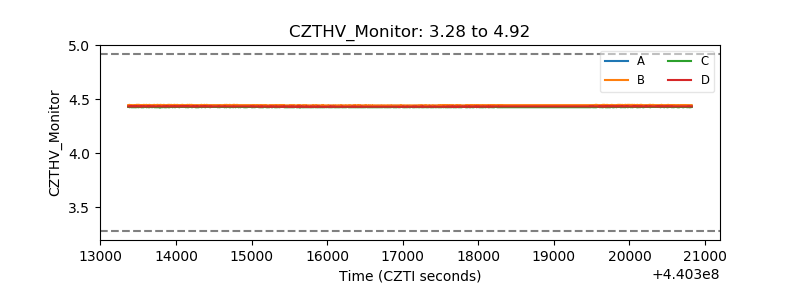 |
| D_VDD | 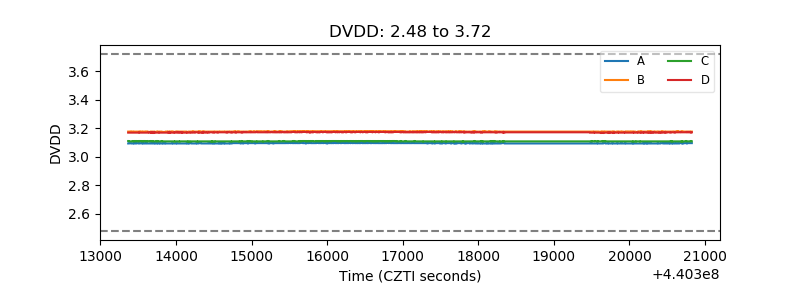 |
| Temperature 1 | 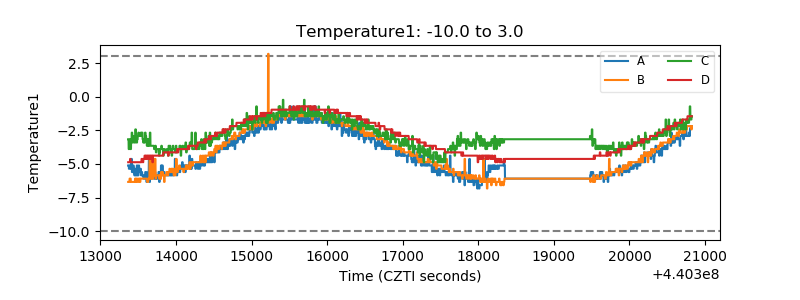 |
| Veto HV Monitor | 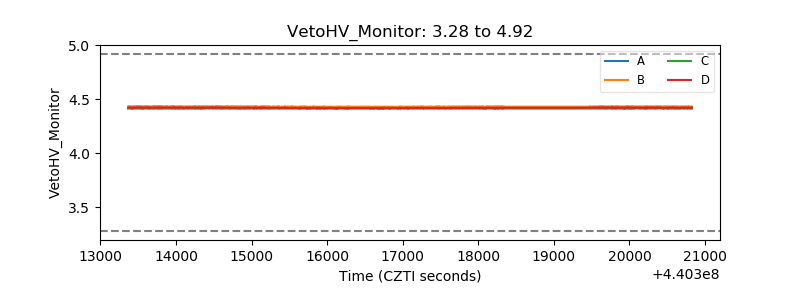 |
| Veto LLD | 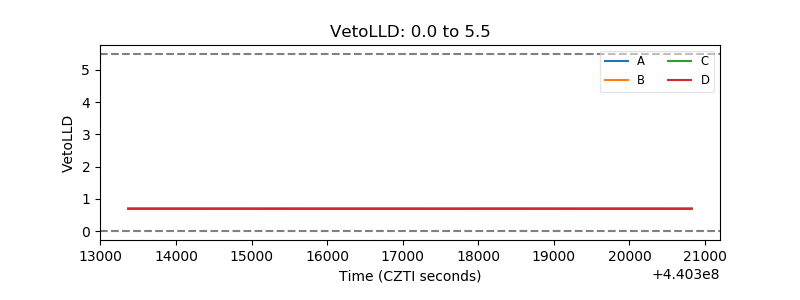 |
| Alpha Counter | 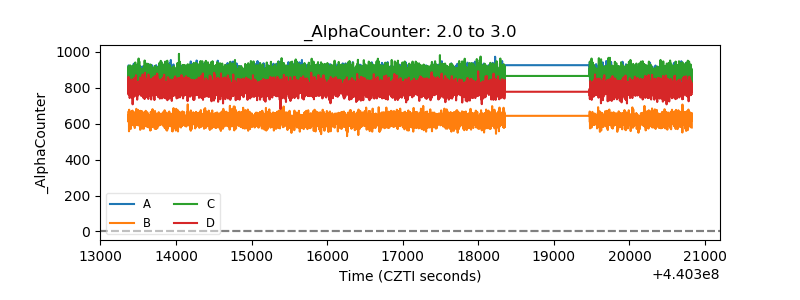 |
| _CPM_Rate | 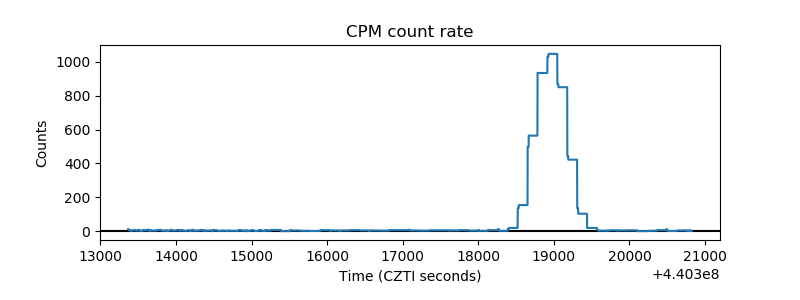 |
| CZT Counter | 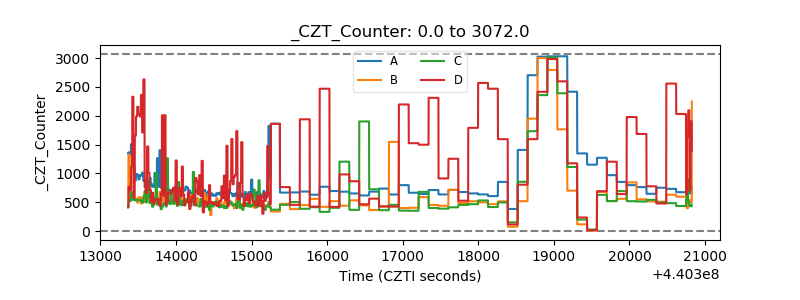 |
| +2.5 Volts monitor | 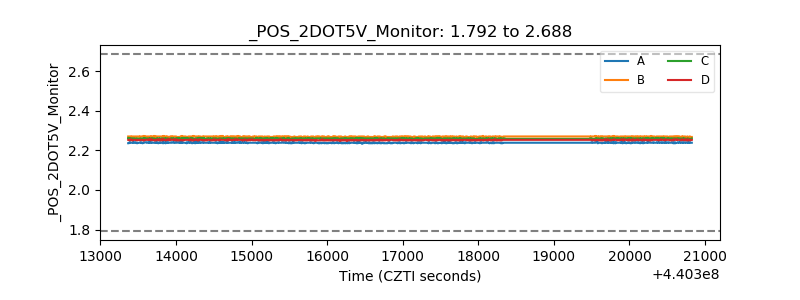 |
| +5 Volts monitor | 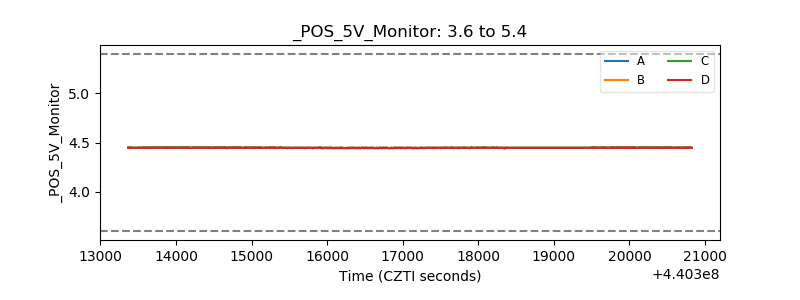 |
| _ROLL_ROT | 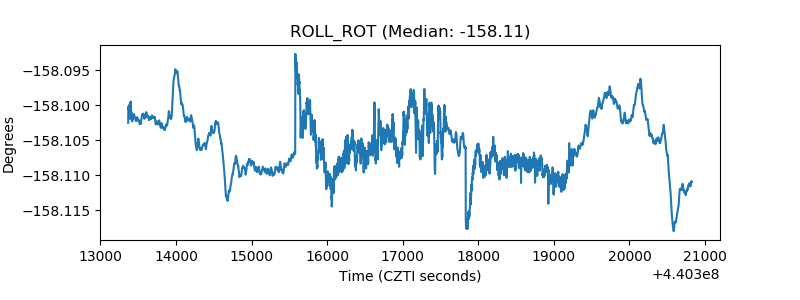 |
| _Roll_DEC | 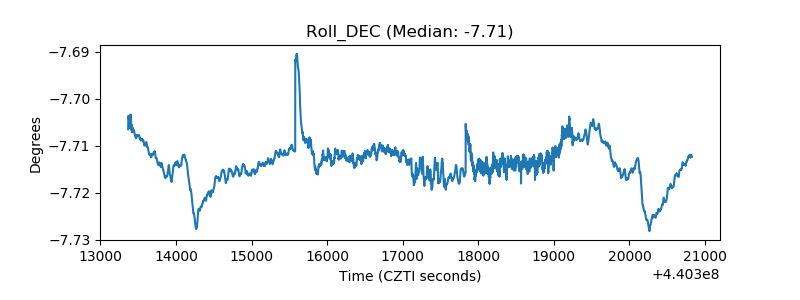 |
| _Roll_RA | 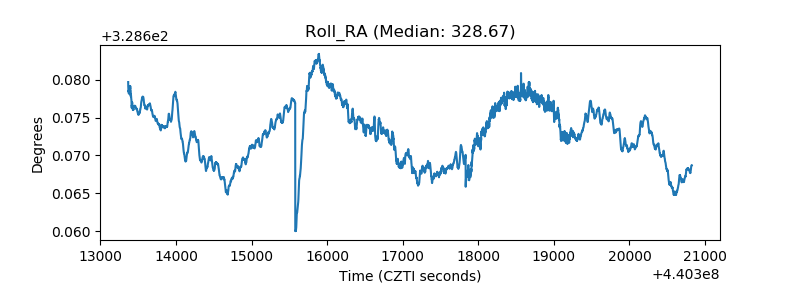 |
| Veto Counter | 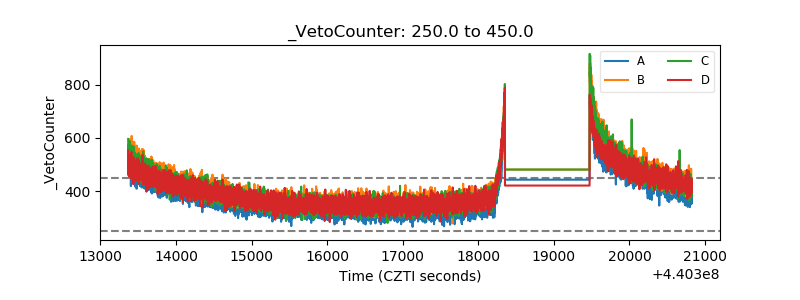 |