| Param | Original file | Final file |
|---|---|---|
| Filename | modeM0/AS1A13_008T08_9000005998_44415cztM0_level2.fits | modeM0/AS1A13_008T08_9000005998_44415cztM0_level2_quad_clean.evt |
| Size (bytes) | 561,824,640 | 113,356,800 |
| Size | 535.8 MB | 108.1 MB |
| Events in quadrant A | 5,108,105 | 781,338 |
| Events in quadrant B | 3,484,076 | 823,754 |
| Events in quadrant C | 3,778,595 | 763,220 |
| Events in quadrant D | 7,922,420 | 611,333 |
| Mode SS | |||
|---|---|---|---|
| Quadrant | BADHDUFLAG | Total packets | Discarded packets |
| A | 0 | 130 | 0 |
| B | 0 | 130 | 0 |
| C | 0 | 130 | 0 |
| D | 0 | 130 | 0 |
| Mode M0 | |||
|---|---|---|---|
| Quadrant | BADHDUFLAG | Total packets | Discarded packets |
| A | 0 | 20581 | 4 |
| B | 0 | 14451 | 2 |
| C | 0 | 15570 | 2 |
| D | 0 | 28052 | 2 |
| Mode M9 | |||
|---|---|---|---|
| Quadrant | BADHDUFLAG | Total packets | Discarded packets |
| A | 0 | 14 | 0 |
| B | 0 | 15 | 0 |
| C | 0 | 15 | 0 |
| D | 0 | 15 | 0 |
| Quadrant | Total seconds | Saturated seconds | Saturation percentage |
|---|---|---|---|
| A | 6499 | 266 | 4.092937% |
| B | 6499 | 134 | 2.061856% |
| C | 6499 | 216 | 3.323588% |
| D | 6499 | 1204 | 18.525927% |
Noise dominated data is calculated using 1-second bins in cleaned event files. If a bin has >2000 counts, and if more than 50% of those come from <1% of pixels, then it is considered to be noise-dominated and hence unusable.
| Quadrant | # 1 sec bins | Bins with >0 counts | Bins with >2000 counts | High rate bins dominated by noise | Noise dominated (total time) | Noise dominated (detector-on time) | Marked lightcurve |
|---|---|---|---|---|---|---|---|
| A | 7649 | 6500 | 26 | 26 | 0.34% | 0.40% | 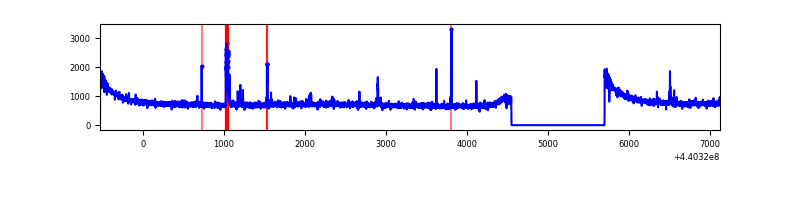 |
| B | 7649 | 6500 | 20 | 20 | 0.26% | 0.31% | 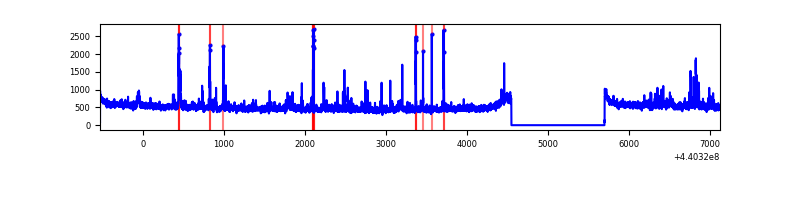 |
| C | 7649 | 6500 | 122 | 122 | 1.59% | 1.88% | 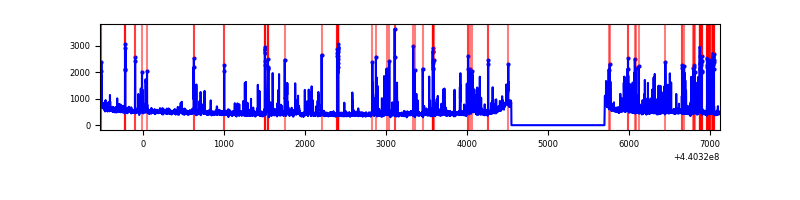 |
| D | 7649 | 6500 | 1202 | 1202 | 15.71% | 18.49% | 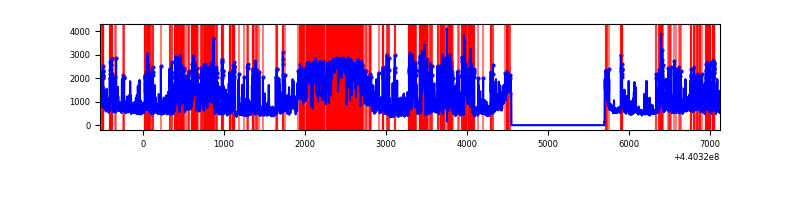 |
Top three noisy pixels from each quadrant. If the there are fewer than three noisy pixels in the level2.evt file, extra rows are filled as -1
| Pixel properties | Quadrant properties | ||||||
|---|---|---|---|---|---|---|---|
| Quadrant | DetID | PixID | Counts | Sigma | Mean | Median | Sigma |
| A | 10 | 83 | 1843771 | 11118.31 | 805 | 791 | 165.8 |
| A | 13 | 248 | 82483 | 492.83 | 805 | 791 | 165.8 |
| A | 8 | 4 | 33231 | 195.7 | 805 | 791 | 165.8 |
| B | 0 | 229 | 71330 | 449.69 | 801 | 779 | 156.9 |
| B | 5 | 255 | 57932 | 364.29 | 801 | 779 | 156.9 |
| B | 4 | 170 | 51832 | 325.41 | 801 | 779 | 156.9 |
| C | 12 | 16 | 489178 | 2710.23 | 771 | 776 | 180.2 |
| C | 14 | 254 | 249708 | 1381.37 | 771 | 776 | 180.2 |
| C | 3 | 233 | 25957 | 139.73 | 771 | 776 | 180.2 |
| D | 5 | 171 | 1423190 | 7621.45 | 738 | 715 | 186.6 |
| D | 2 | 249 | 992571 | 5314.24 | 738 | 715 | 186.6 |
| D | 12 | 17 | 912956 | 4887.68 | 738 | 715 | 186.6 |
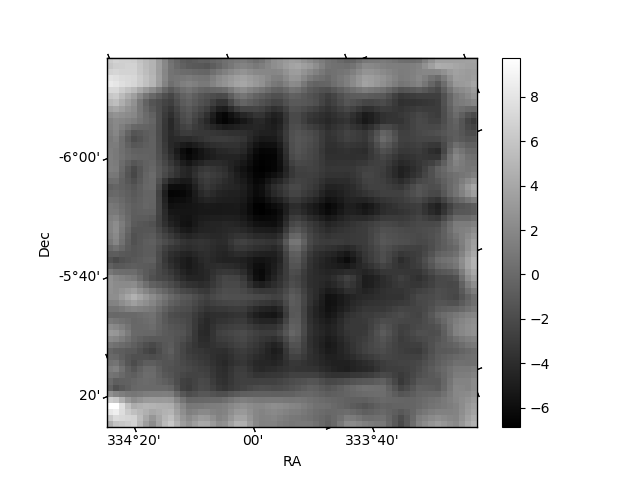
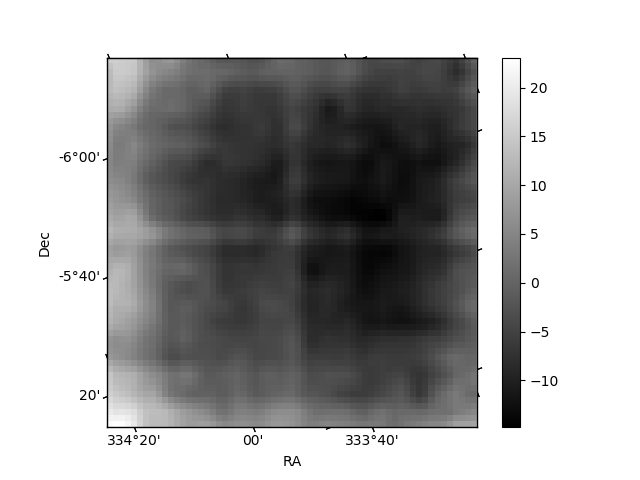
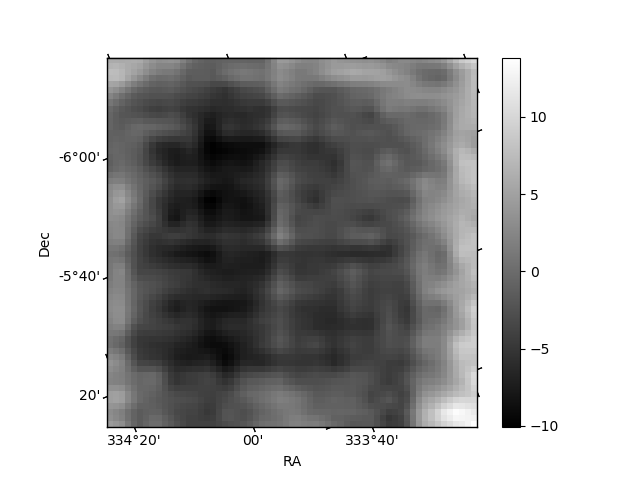
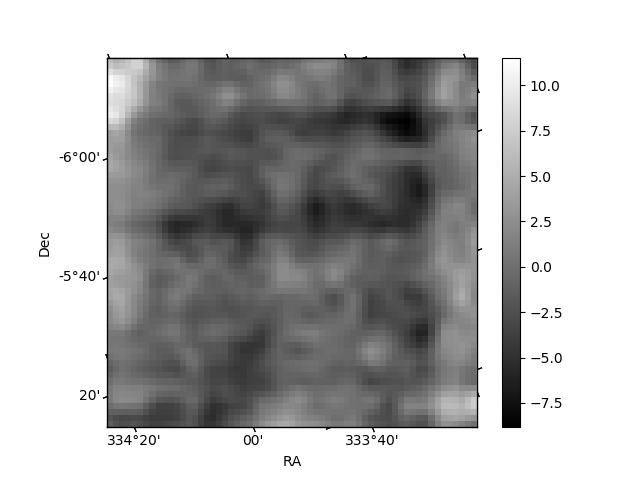
Histogram calculated using DETX and DETY for each event in the final _common_clean file
| Quadrant A | 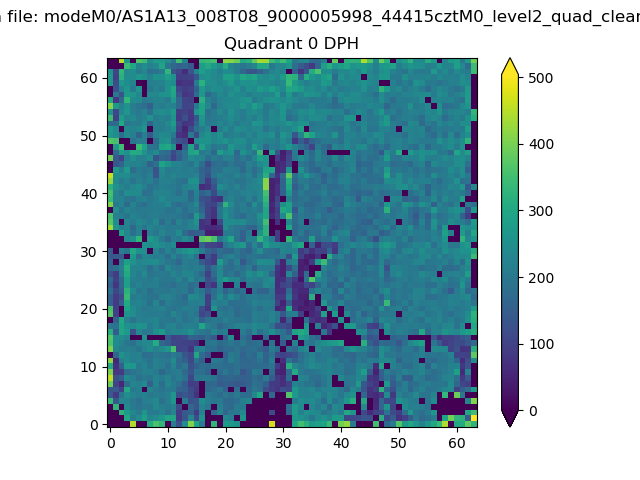 |
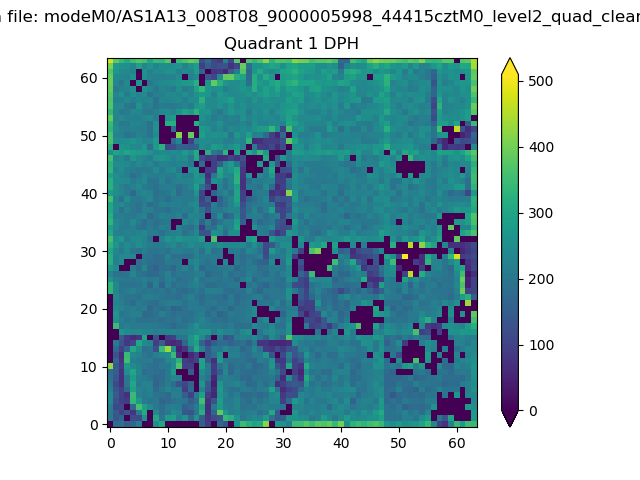 |
Quadrant B |
|---|---|---|---|
| Quadrant D | 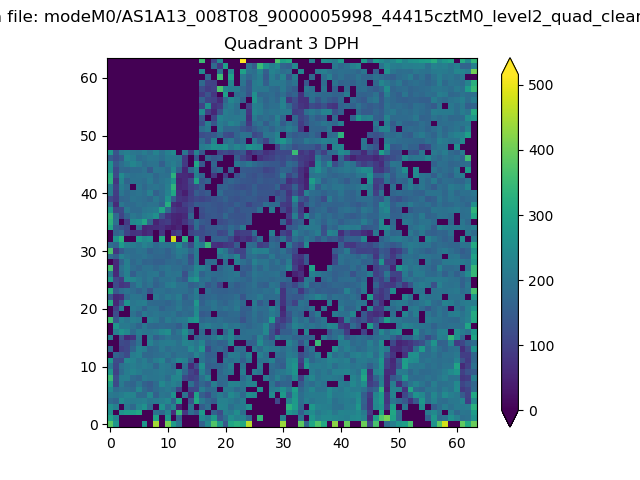 |
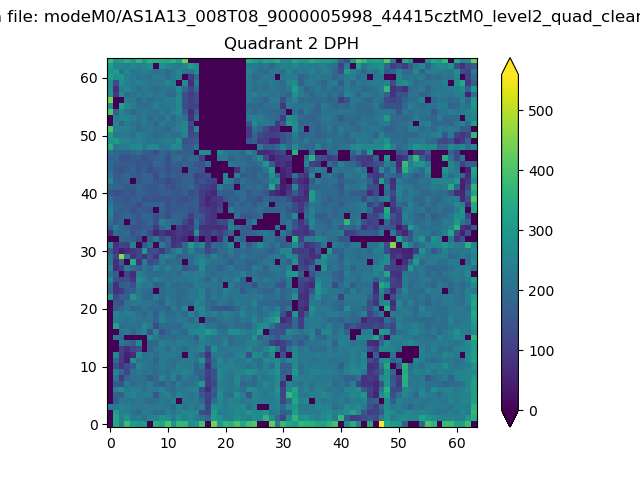 |
Quadrant C |
| Plot type | Count rate plots | Images |
|---|---|---|
| Comparison with Poisson distribution Blue bars denote a histogram of data divided into 1 sec bins. Red curve is a Poisson curve with rate = median count rate of data. |
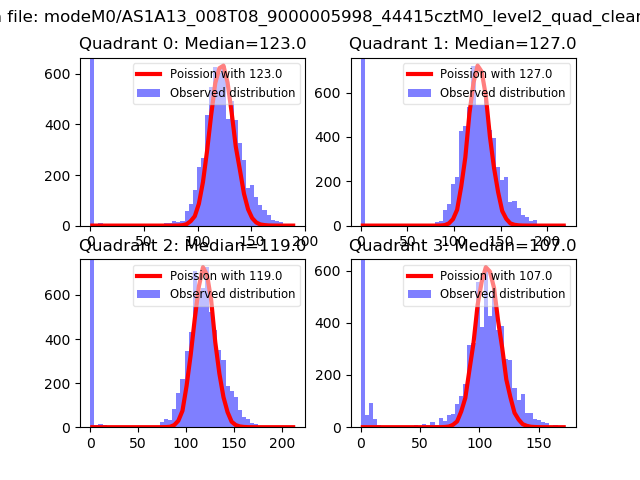 |
 |
| Quadrant-wise count rates Data is divided into 100 sec bins |
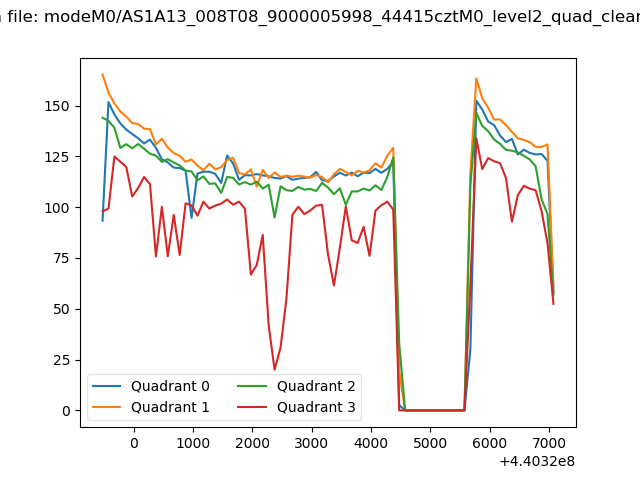 |
|
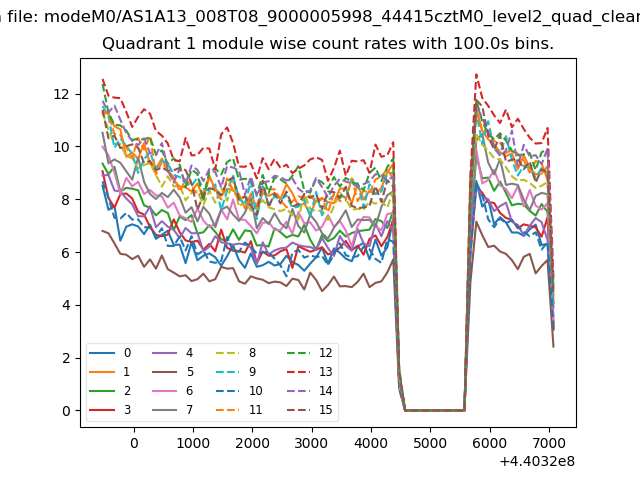
| Module-wise count rates for Quadrant A Data is divided into 100 sec bins |
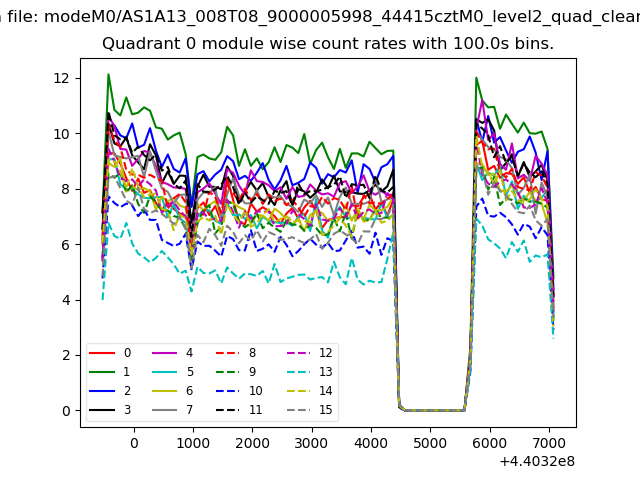 |
 |
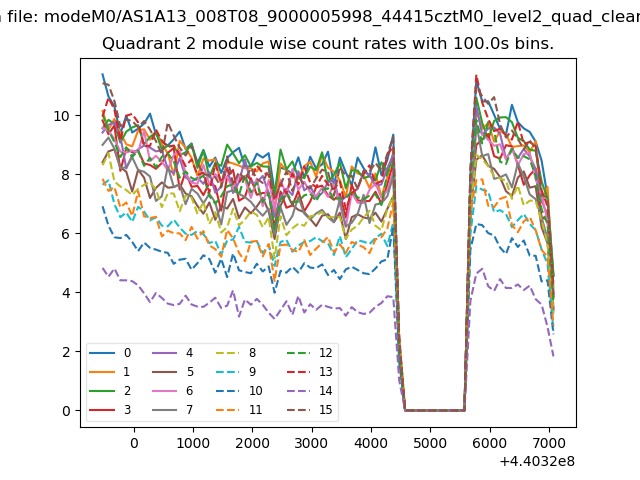
| Module-wise count rates for Quadrant B Data is divided into 100 sec bins |
 |
 |
| Module-wise count rates for Quadrant C Data is divided into 100 sec bins |
 |
 |
| Module-wise count rates for Quadrant D Data is divided into 100 sec bins |
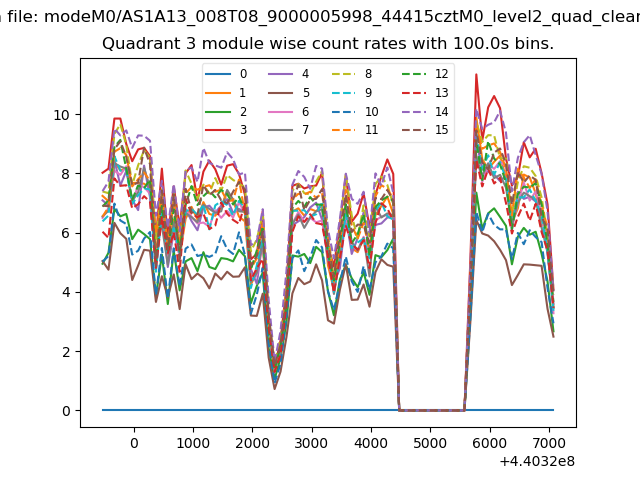 |
 |
| Parameter | Plot |
|---|---|
| CZT HV Monitor | 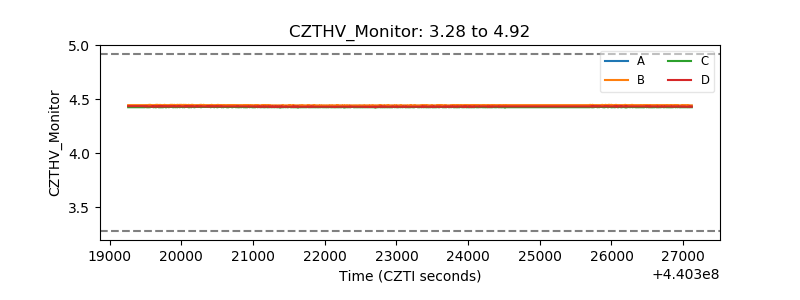 |
| D_VDD | 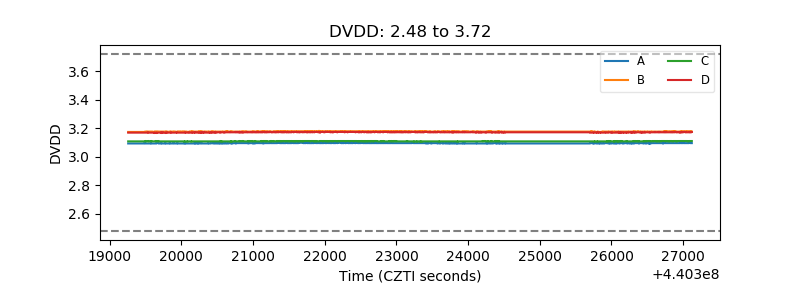 |
| Temperature 1 | 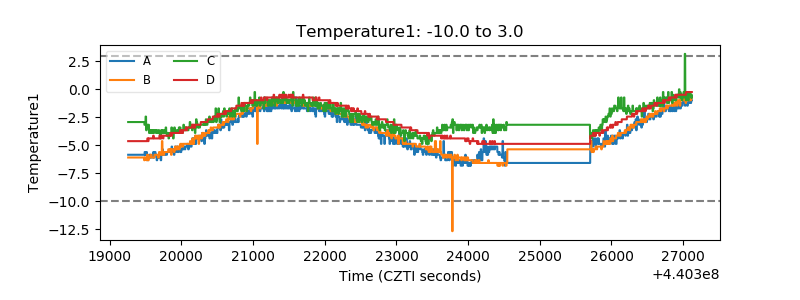 |
| Veto HV Monitor | 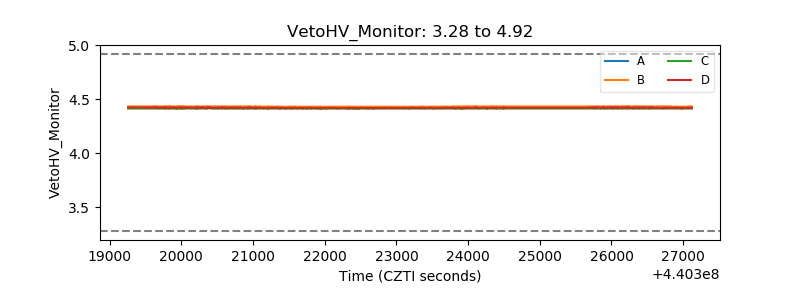 |
| Veto LLD | 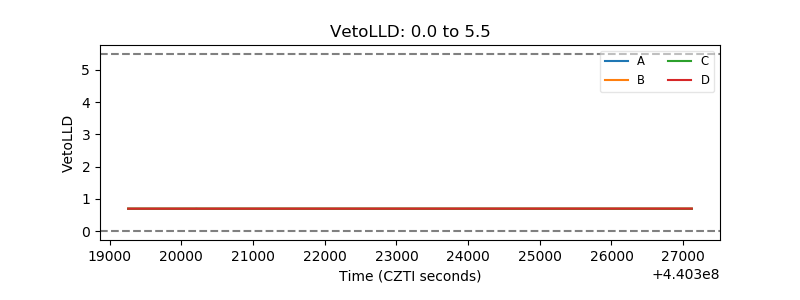 |
| Alpha Counter | 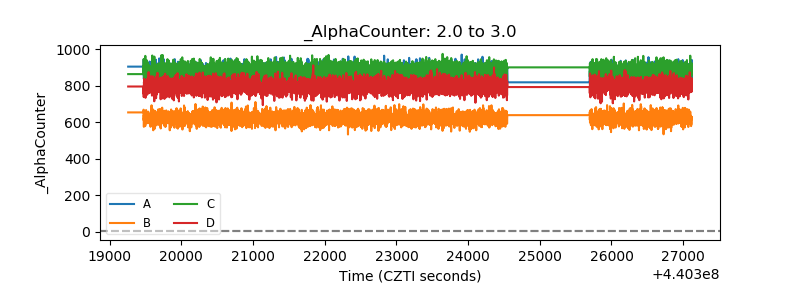 |
| _CPM_Rate | 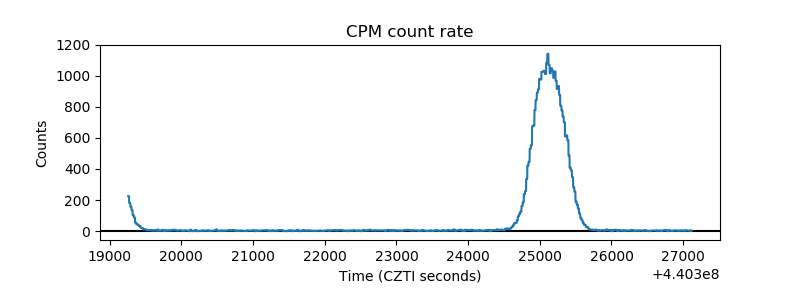 |
| CZT Counter | 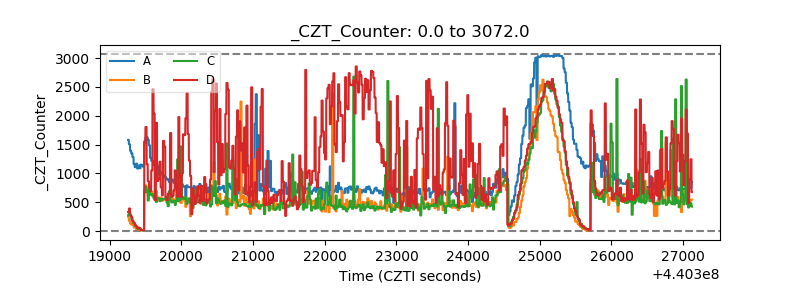 |
| +2.5 Volts monitor | 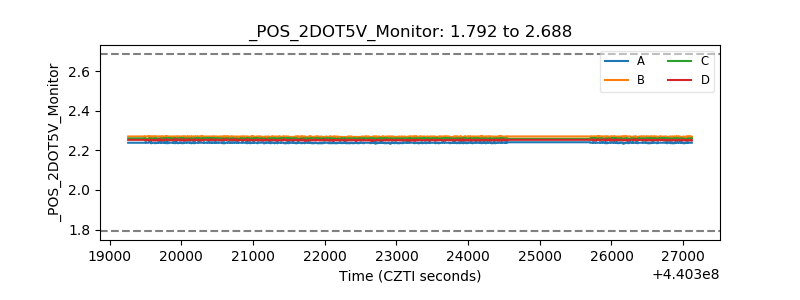 |
| +5 Volts monitor | 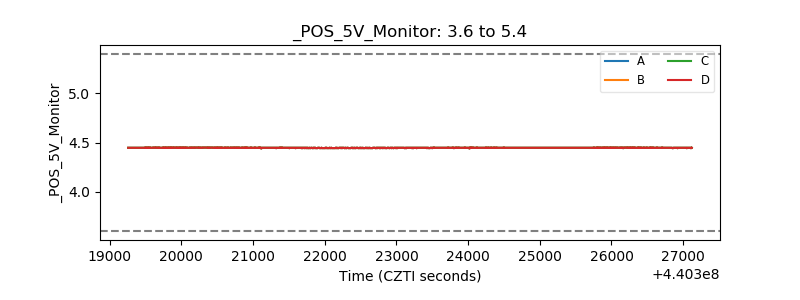 |
| _ROLL_ROT | 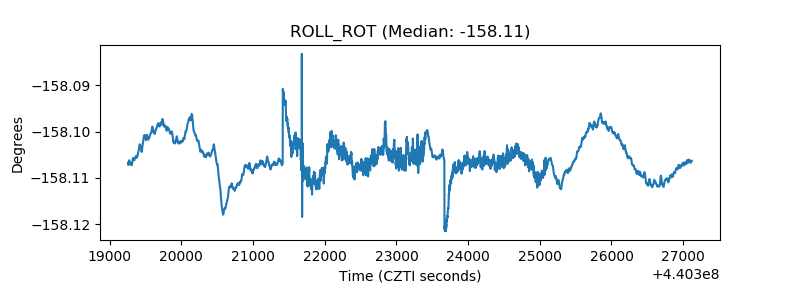 |
| _Roll_DEC | 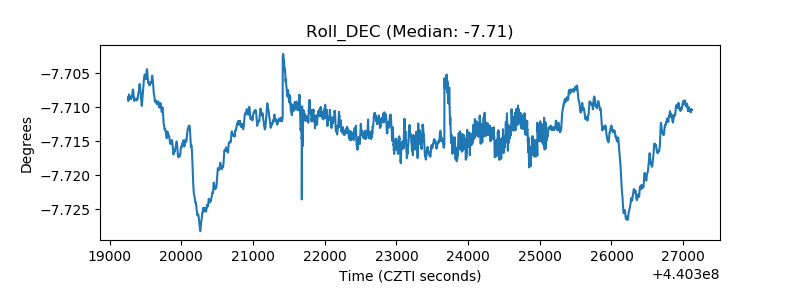 |
| _Roll_RA |  |
| Veto Counter | 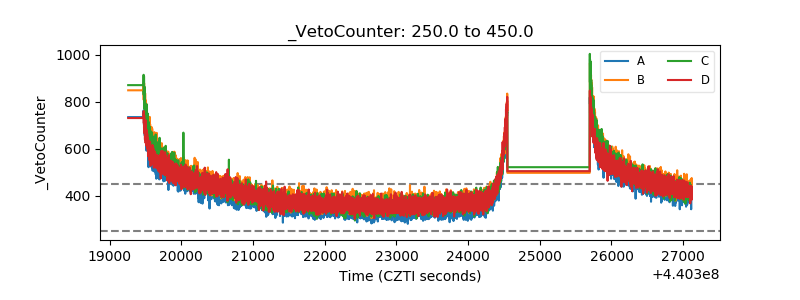 |