| Param | Original file | Final file |
|---|---|---|
| Filename | modeM0/AS1A13_008T08_9000005998_44416cztM0_level2.fits | modeM0/AS1A13_008T08_9000005998_44416cztM0_level2_quad_clean.evt |
| Size (bytes) | 480,165,120 | 104,892,480 |
| Size | 457.9 MB | 100.0 MB |
| Events in quadrant A | 4,614,392 | 723,640 |
| Events in quadrant B | 3,236,048 | 746,382 |
| Events in quadrant C | 3,743,705 | 695,975 |
| Events in quadrant D | 5,712,411 | 589,500 |
| Mode SS | |||
|---|---|---|---|
| Quadrant | BADHDUFLAG | Total packets | Discarded packets |
| A | 0 | 122 | 0 |
| B | 0 | 122 | 0 |
| C | 0 | 122 | 0 |
| D | 0 | 122 | 0 |
| Mode M0 | |||
|---|---|---|---|
| Quadrant | BADHDUFLAG | Total packets | Discarded packets |
| A | 0 | 18626 | 1 |
| B | 0 | 13381 | 1 |
| C | 0 | 15183 | 1 |
| D | 0 | 21076 | 1 |
| Mode M9 | |||
|---|---|---|---|
| Quadrant | BADHDUFLAG | Total packets | Discarded packets |
| A | 0 | 13 | 0 |
| B | 0 | 13 | 0 |
| C | 0 | 13 | 0 |
| D | 0 | 13 | 0 |
| Quadrant | Total seconds | Saturated seconds | Saturation percentage |
|---|---|---|---|
| A | 6026 | 141 | 2.339861% |
| B | 6026 | 99 | 1.642881% |
| C | 6026 | 199 | 3.302356% |
| D | 6026 | 741 | 12.296714% |
Noise dominated data is calculated using 1-second bins in cleaned event files. If a bin has >2000 counts, and if more than 50% of those come from <1% of pixels, then it is considered to be noise-dominated and hence unusable.
| Quadrant | # 1 sec bins | Bins with >0 counts | Bins with >2000 counts | High rate bins dominated by noise | Noise dominated (total time) | Noise dominated (detector-on time) | Marked lightcurve |
|---|---|---|---|---|---|---|---|
| A | 7246 | 6027 | 4 | 4 | 0.06% | 0.07% | 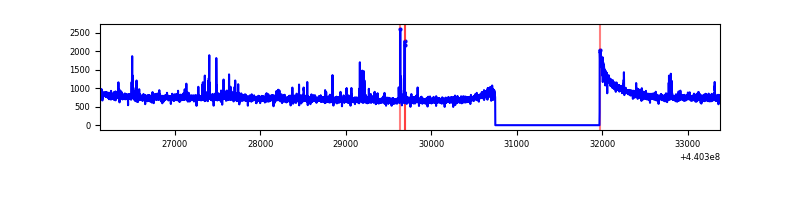 |
| B | 7246 | 6027 | 7 | 7 | 0.10% | 0.12% | 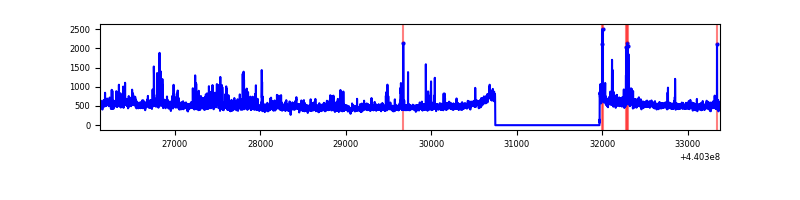 |
| C | 7246 | 6027 | 187 | 187 | 2.58% | 3.10% | 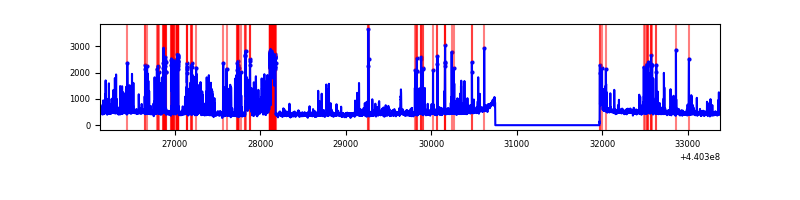 |
| D | 7246 | 6027 | 588 | 588 | 8.11% | 9.76% | 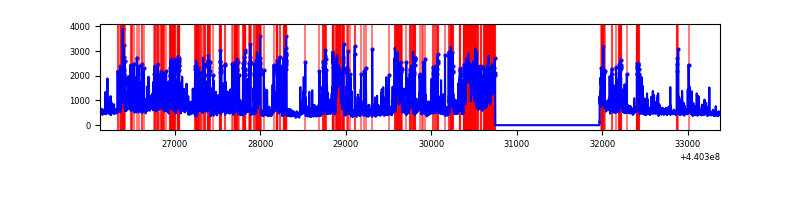 |
Top three noisy pixels from each quadrant. If the there are fewer than three noisy pixels in the level2.evt file, extra rows are filled as -1
| Pixel properties | Quadrant properties | ||||||
|---|---|---|---|---|---|---|---|
| Quadrant | DetID | PixID | Counts | Sigma | Mean | Median | Sigma |
| A | 10 | 83 | 1684746 | 11220.28 | 731 | 718 | 150.1 |
| A | 13 | 248 | 46924 | 307.86 | 731 | 718 | 150.1 |
| A | 0 | 243 | 22665 | 146.23 | 731 | 718 | 150.1 |
| B | 0 | 229 | 91957 | 641.2 | 722 | 703 | 142.3 |
| B | 0 | 183 | 69348 | 482.34 | 722 | 703 | 142.3 |
| B | 0 | 155 | 50504 | 349.93 | 722 | 703 | 142.3 |
| C | 12 | 16 | 768520 | 4757.83 | 694 | 699 | 161.4 |
| C | 14 | 254 | 240978 | 1488.9 | 694 | 699 | 161.4 |
| C | 3 | 233 | 18419 | 109.8 | 694 | 699 | 161.4 |
| D | 2 | 249 | 690190 | 4051.31 | 673 | 653 | 170.2 |
| D | 5 | 235 | 507182 | 2976.06 | 673 | 653 | 170.2 |
| D | 4 | 221 | 396828 | 2327.69 | 673 | 653 | 170.2 |
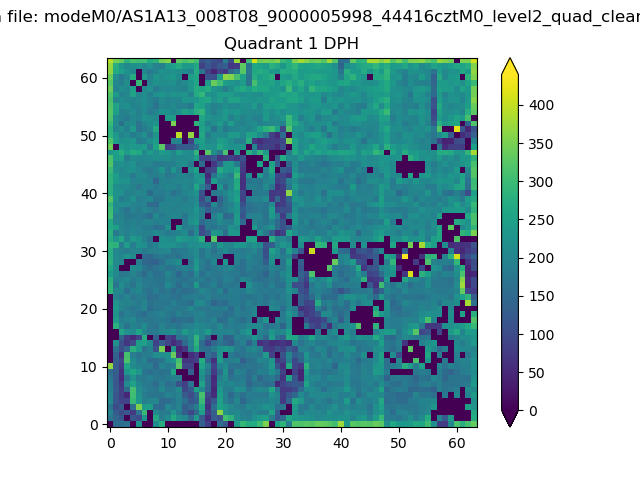
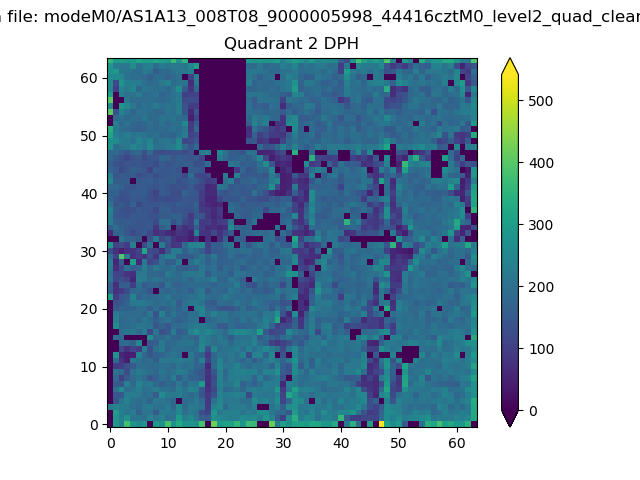
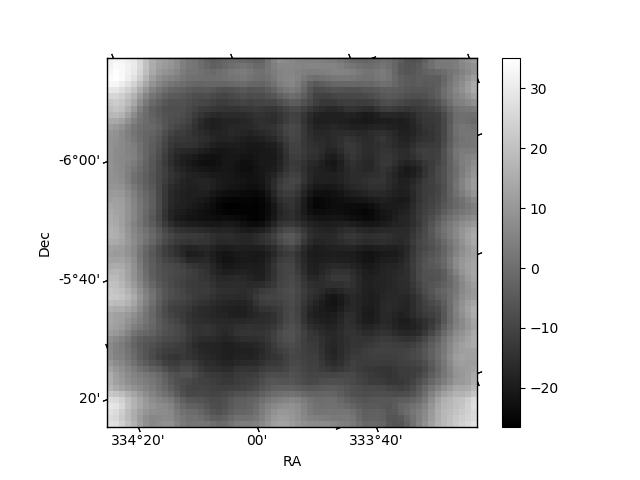
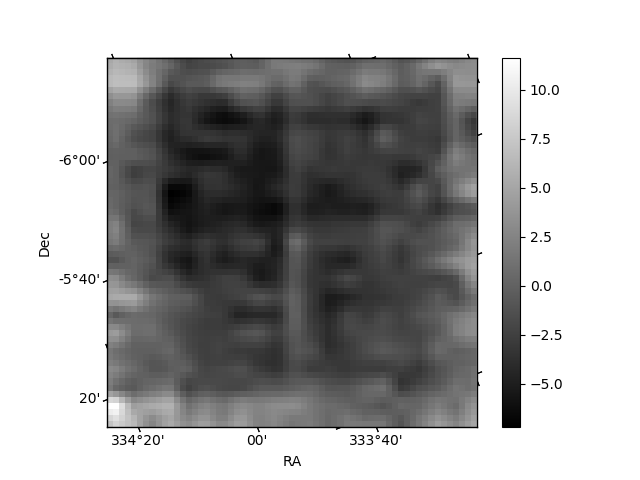
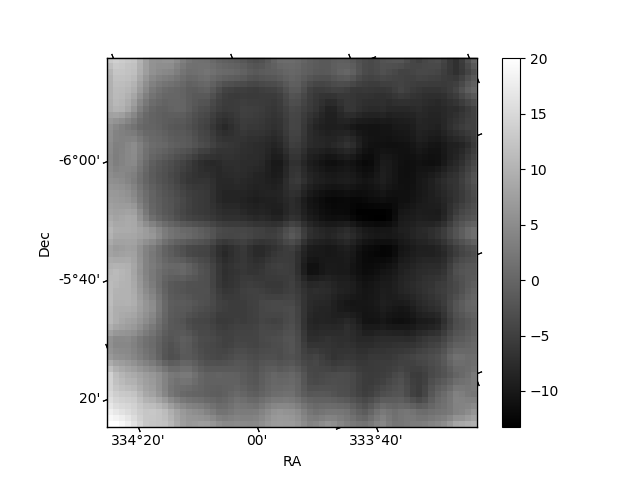
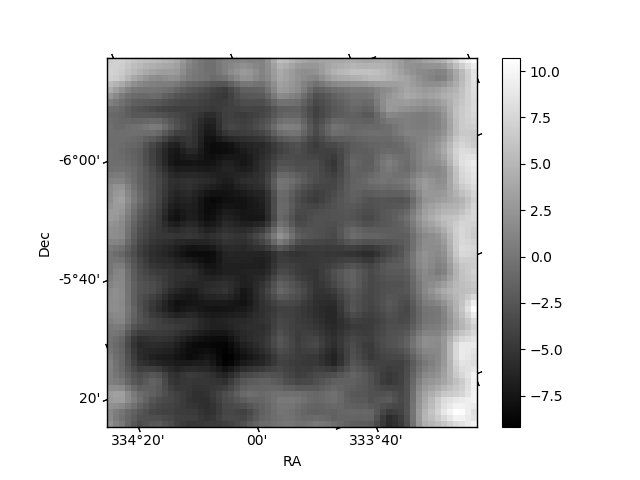
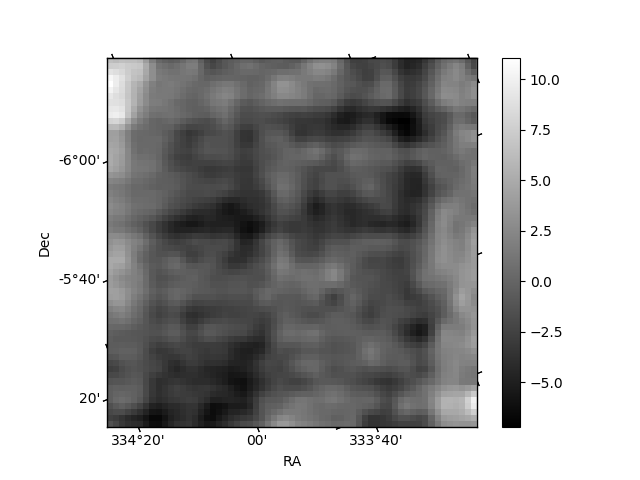
Histogram calculated using DETX and DETY for each event in the final _common_clean file
| Quadrant A |  |
 |
Quadrant B |
|---|---|---|---|
| Quadrant D | 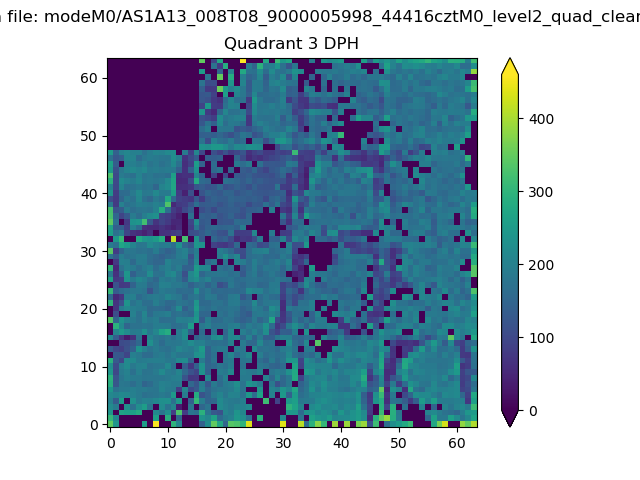 |
 |
Quadrant C |
| Plot type | Count rate plots | Images |
|---|---|---|
| Comparison with Poisson distribution Blue bars denote a histogram of data divided into 1 sec bins. Red curve is a Poisson curve with rate = median count rate of data. |
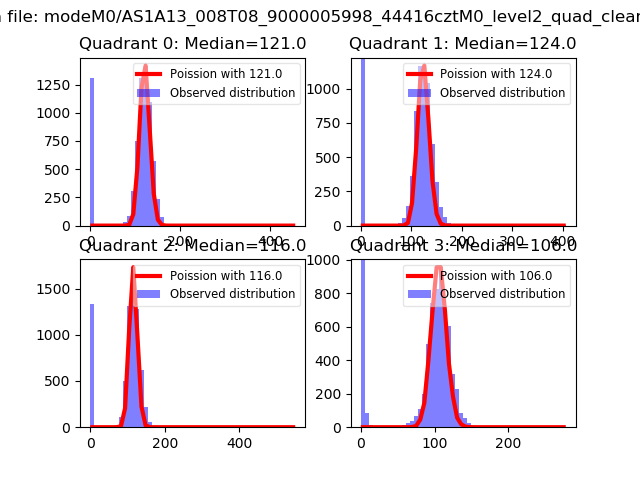 |
 |
| Quadrant-wise count rates Data is divided into 100 sec bins |
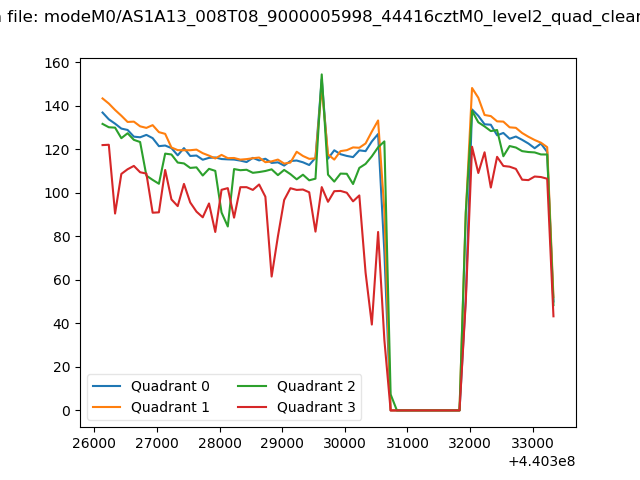 |
|
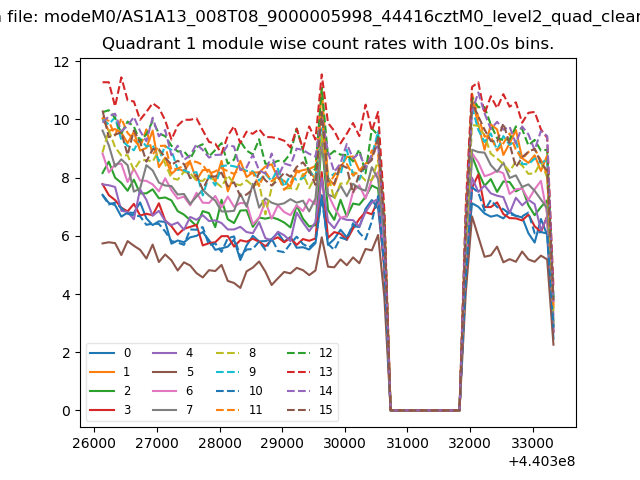
| Module-wise count rates for Quadrant A Data is divided into 100 sec bins |
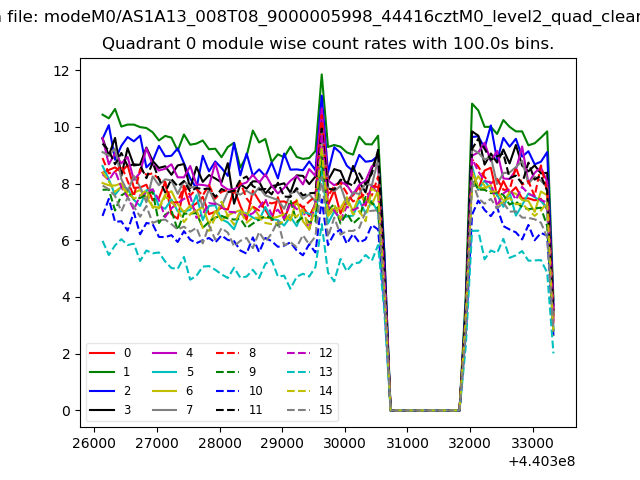 |
 |
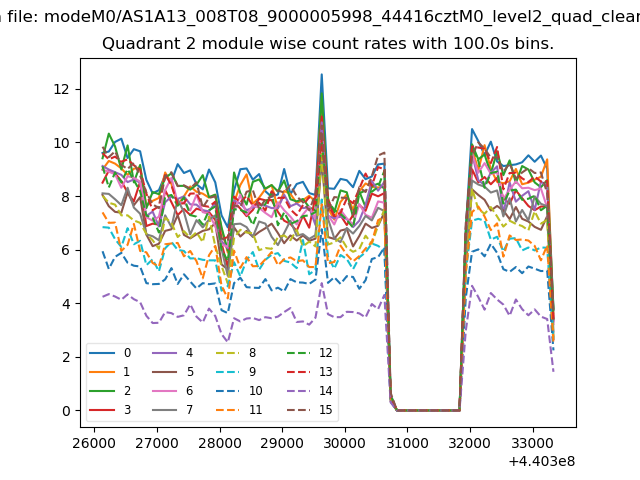
| Module-wise count rates for Quadrant B Data is divided into 100 sec bins |
 |
 |
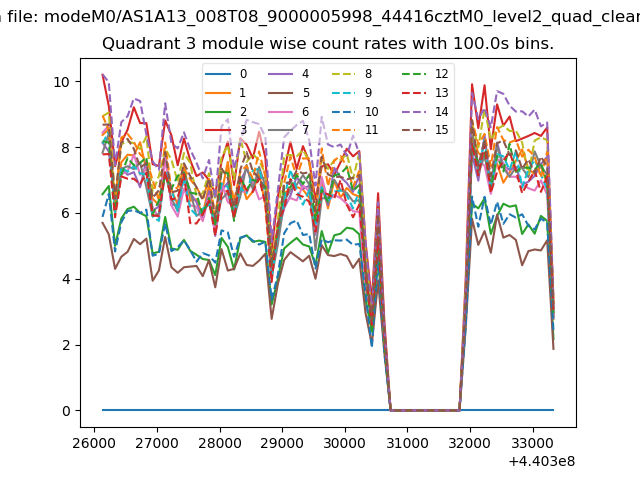
| Module-wise count rates for Quadrant C Data is divided into 100 sec bins |
 |
 |
| Module-wise count rates for Quadrant D Data is divided into 100 sec bins |
 |
 |
| Parameter | Plot |
|---|---|
| CZT HV Monitor | 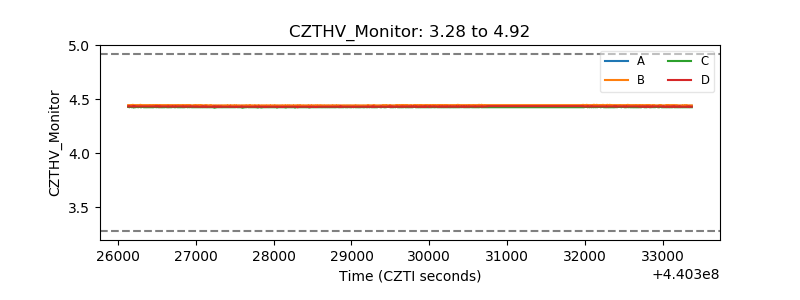 |
| D_VDD | 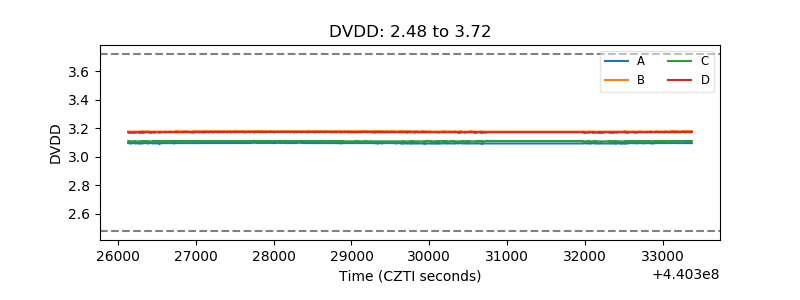 |
| Temperature 1 | 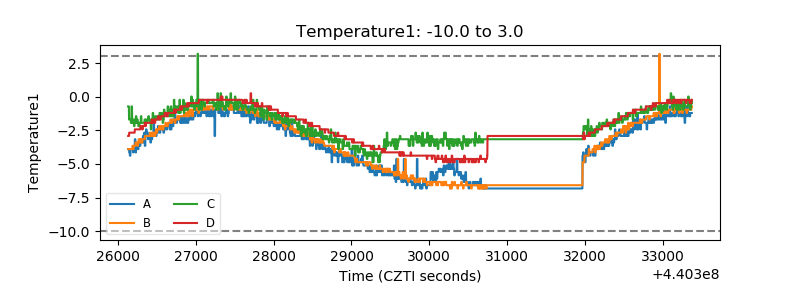 |
| Veto HV Monitor | 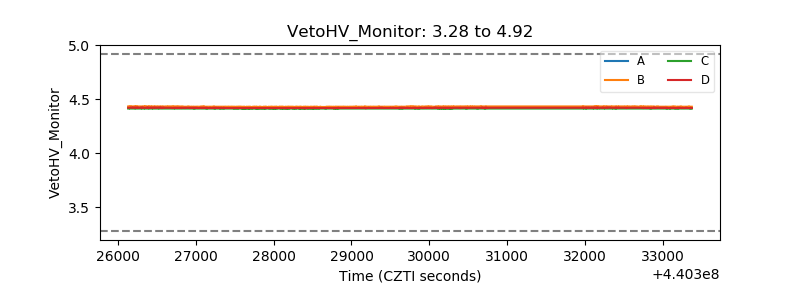 |
| Veto LLD | 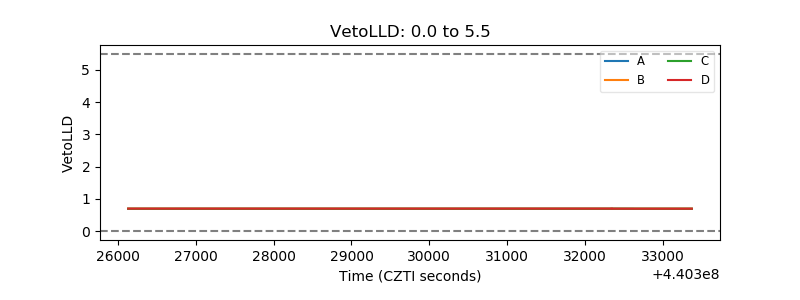 |
| Alpha Counter | 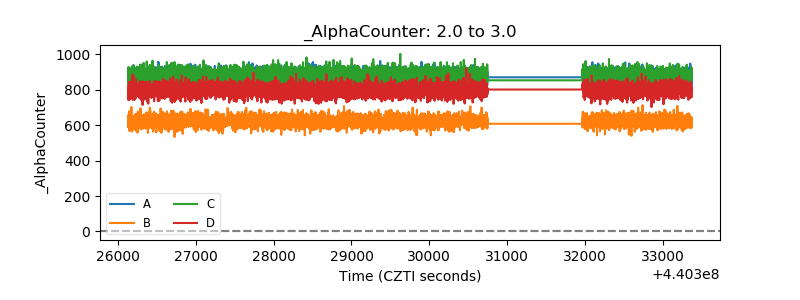 |
| _CPM_Rate | 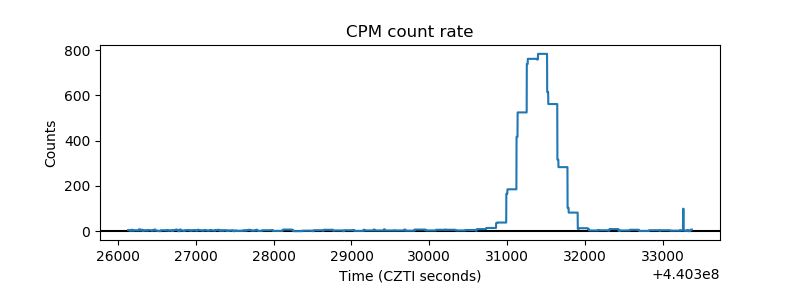 |
| CZT Counter | 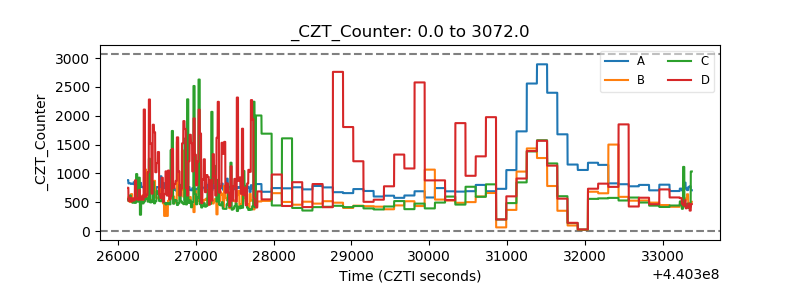 |
| +2.5 Volts monitor | 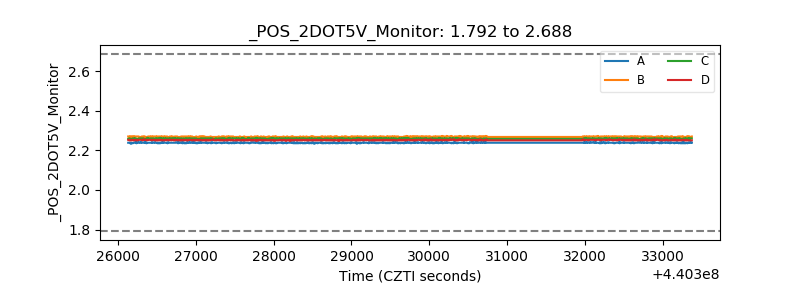 |
| +5 Volts monitor | 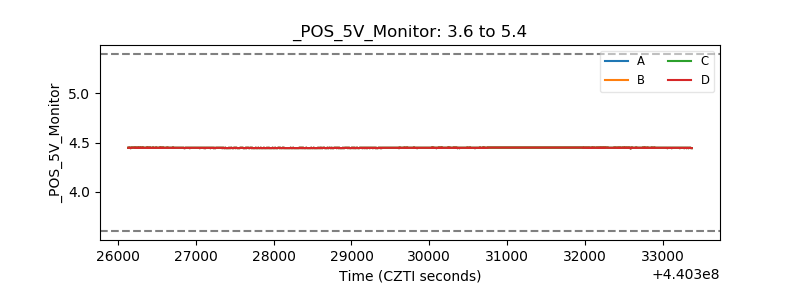 |
| _ROLL_ROT | 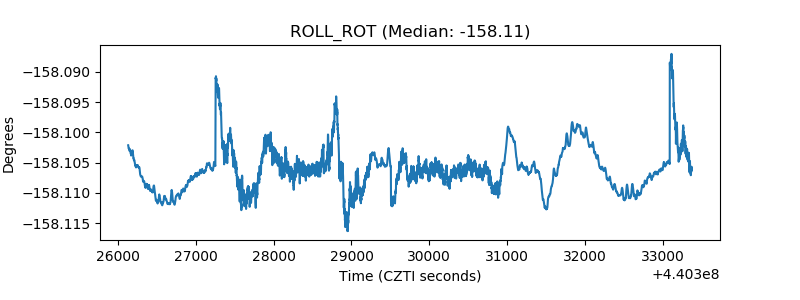 |
| _Roll_DEC | 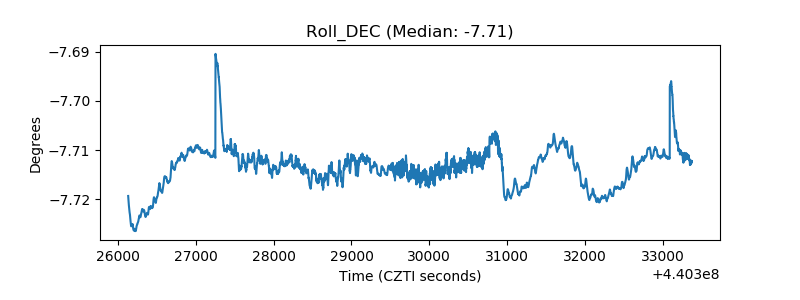 |
| _Roll_RA | 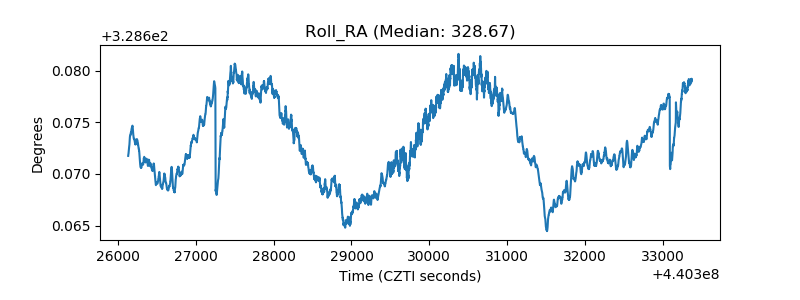 |
| Veto Counter | 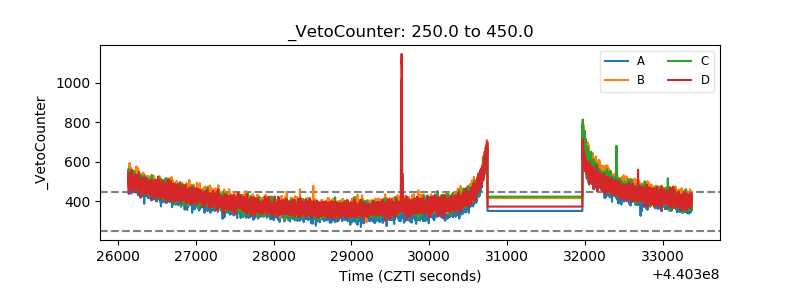 |