| Param | Original file | Final file |
|---|---|---|
| Filename | modeM0/AS1A13_008T08_9000005998_44417cztM0_level2.fits | modeM0/AS1A13_008T08_9000005998_44417cztM0_level2_quad_clean.evt |
| Size (bytes) | 484,560,000 | 103,953,600 |
| Size | 462.1 MB | 99.1 MB |
| Events in quadrant A | 4,754,414 | 715,564 |
| Events in quadrant B | 3,283,865 | 734,466 |
| Events in quadrant C | 3,348,600 | 699,430 |
| Events in quadrant D | 6,066,183 | 563,138 |
| Mode SS | |||
|---|---|---|---|
| Quadrant | BADHDUFLAG | Total packets | Discarded packets |
| A | 0 | 128 | 0 |
| B | 0 | 128 | 0 |
| C | 0 | 128 | 0 |
| D | 0 | 128 | 0 |
| Mode M0 | |||
|---|---|---|---|
| Quadrant | BADHDUFLAG | Total packets | Discarded packets |
| A | 0 | 19267 | 4 |
| B | 0 | 13739 | 1 |
| C | 0 | 14273 | 2 |
| D | 0 | 22234 | 1 |
| Mode M9 | |||
|---|---|---|---|
| Quadrant | BADHDUFLAG | Total packets | Discarded packets |
| A | 0 | 11 | 0 |
| B | 0 | 11 | 0 |
| C | 0 | 11 | 0 |
| D | 0 | 11 | 0 |
| Quadrant | Total seconds | Saturated seconds | Saturation percentage |
|---|---|---|---|
| A | 6226 | 200 | 3.212335% |
| B | 6227 | 174 | 2.794283% |
| C | 6226 | 155 | 2.489560% |
| D | 6227 | 1021 | 16.396339% |
Noise dominated data is calculated using 1-second bins in cleaned event files. If a bin has >2000 counts, and if more than 50% of those come from <1% of pixels, then it is considered to be noise-dominated and hence unusable.
| Quadrant | # 1 sec bins | Bins with >0 counts | Bins with >2000 counts | High rate bins dominated by noise | Noise dominated (total time) | Noise dominated (detector-on time) | Marked lightcurve |
|---|---|---|---|---|---|---|---|
| A | 7326 | 6227 | 15 | 15 | 0.20% | 0.24% | 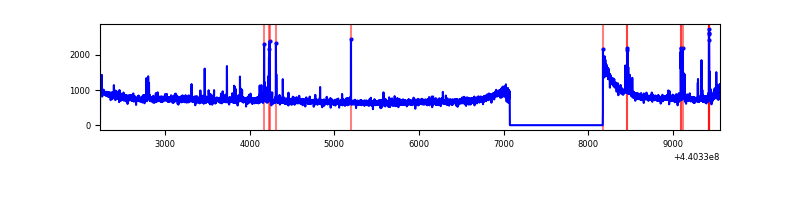 |
| B | 7327 | 6228 | 22 | 22 | 0.30% | 0.35% | 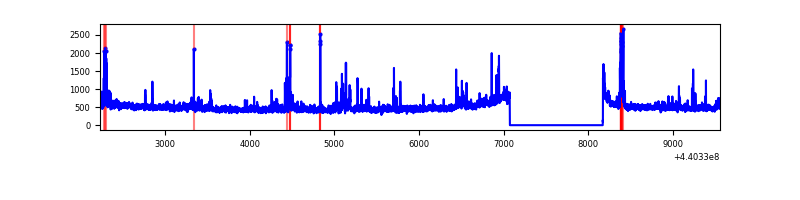 |
| C | 7327 | 6228 | 65 | 65 | 0.89% | 1.04% |  |
| D | 7327 | 6228 | 840 | 840 | 11.46% | 13.49% | 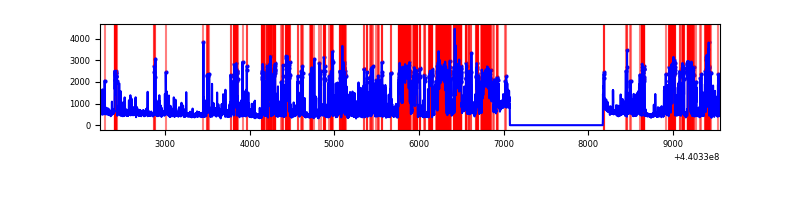 |
Top three noisy pixels from each quadrant. If the there are fewer than three noisy pixels in the level2.evt file, extra rows are filled as -1
| Pixel properties | Quadrant properties | ||||||
|---|---|---|---|---|---|---|---|
| Quadrant | DetID | PixID | Counts | Sigma | Mean | Median | Sigma |
| A | 10 | 83 | 1734526 | 11243.83 | 739 | 723 | 154.2 |
| A | 13 | 248 | 58743 | 376.26 | 739 | 723 | 154.2 |
| A | 0 | 243 | 56638 | 362.61 | 739 | 723 | 154.2 |
| B | 0 | 229 | 109934 | 754.86 | 733 | 712 | 144.7 |
| B | 5 | 32 | 85200 | 583.92 | 733 | 712 | 144.7 |
| B | 0 | 155 | 44766 | 304.47 | 733 | 712 | 144.7 |
| C | 12 | 16 | 328870 | 1968.01 | 708 | 714 | 166.7 |
| C | 14 | 254 | 196844 | 1176.23 | 708 | 714 | 166.7 |
| C | 3 | 233 | 50833 | 300.57 | 708 | 714 | 166.7 |
| D | 4 | 221 | 925968 | 5483.2 | 670 | 651 | 168.8 |
| D | 13 | 249 | 718168 | 4251.83 | 670 | 651 | 168.8 |
| D | 2 | 249 | 619255 | 3665.69 | 670 | 651 | 168.8 |
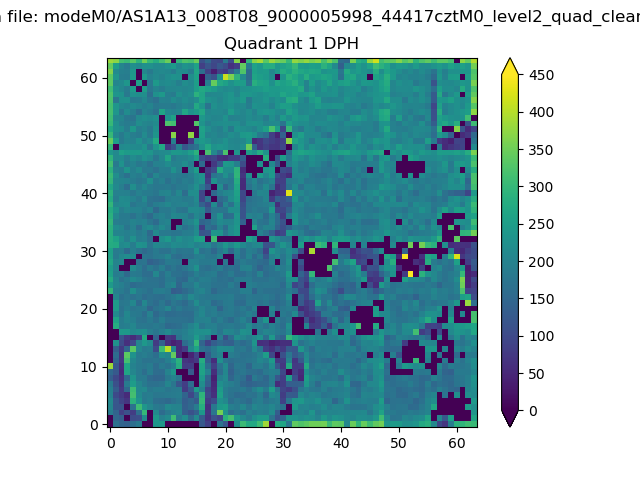
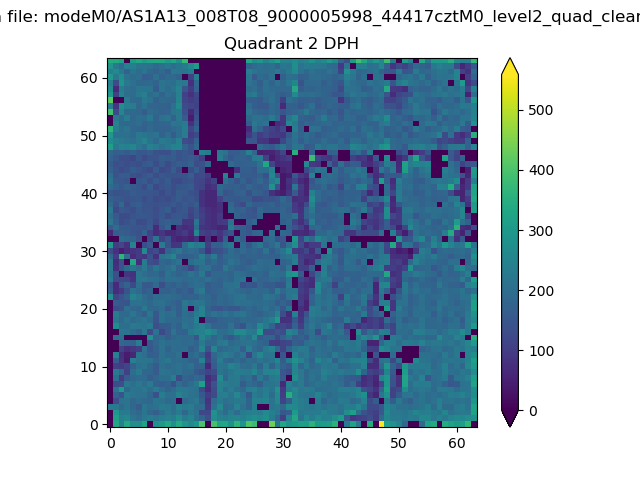
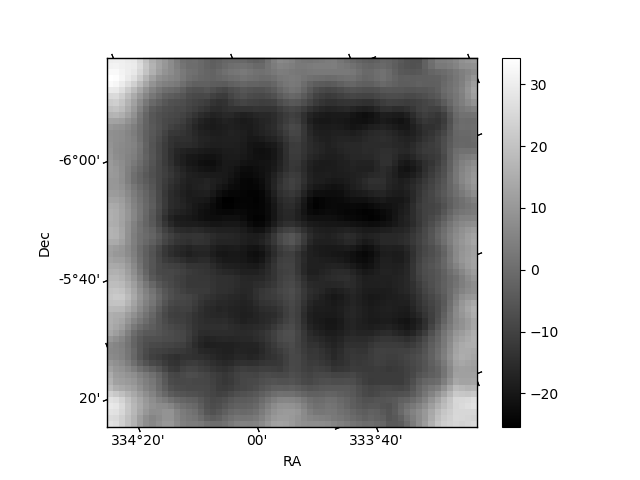
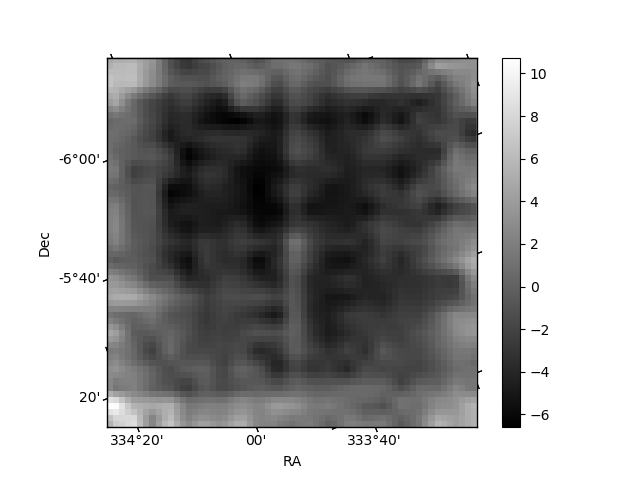
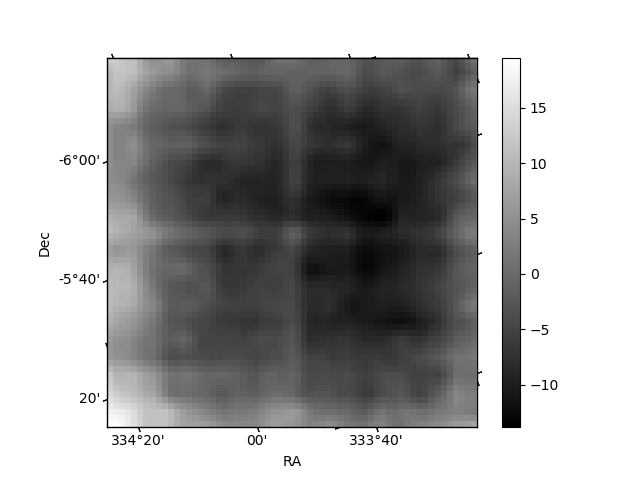
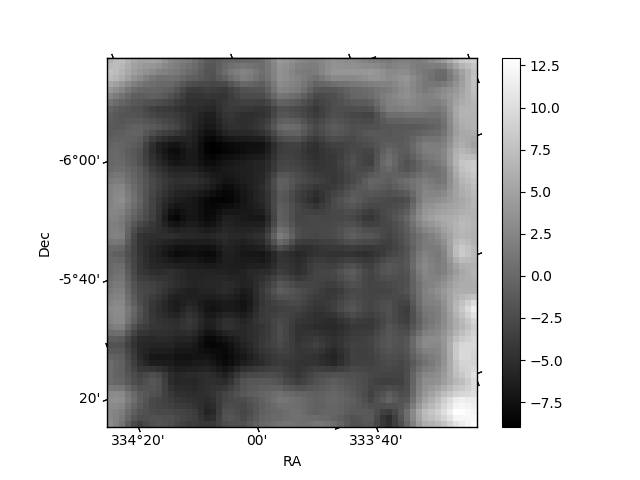
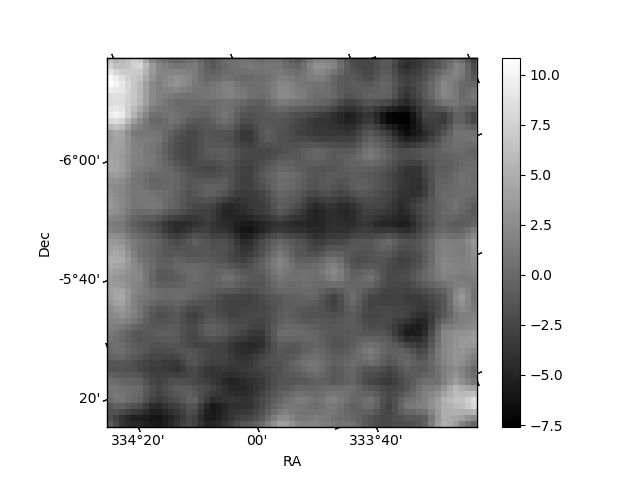
Histogram calculated using DETX and DETY for each event in the final _common_clean file
| Quadrant A | 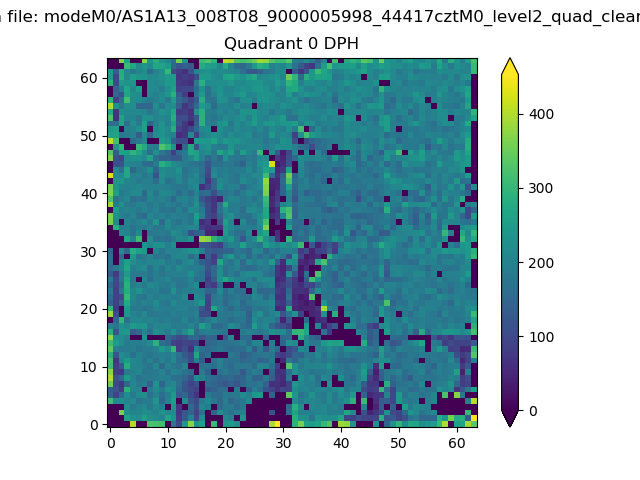 |
 |
Quadrant B |
|---|---|---|---|
| Quadrant D | 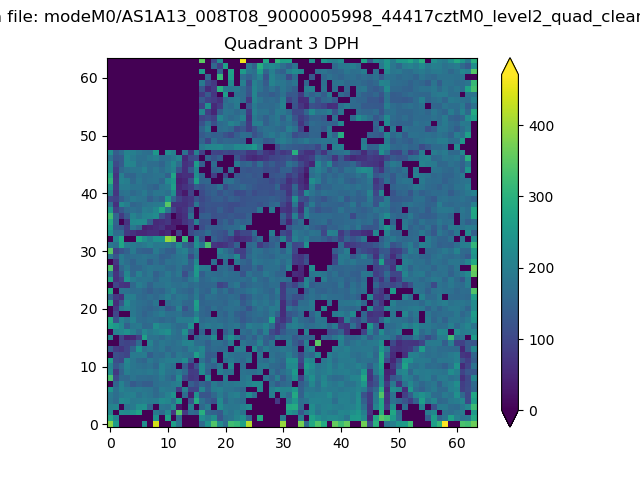 |
 |
Quadrant C |
| Plot type | Count rate plots | Images |
|---|---|---|
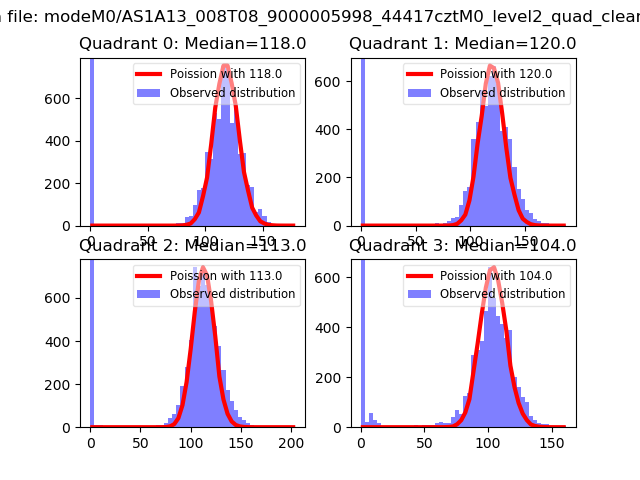
| Comparison with Poisson distribution Blue bars denote a histogram of data divided into 1 sec bins. Red curve is a Poisson curve with rate = median count rate of data. |
 |
 |
| Quadrant-wise count rates Data is divided into 100 sec bins |
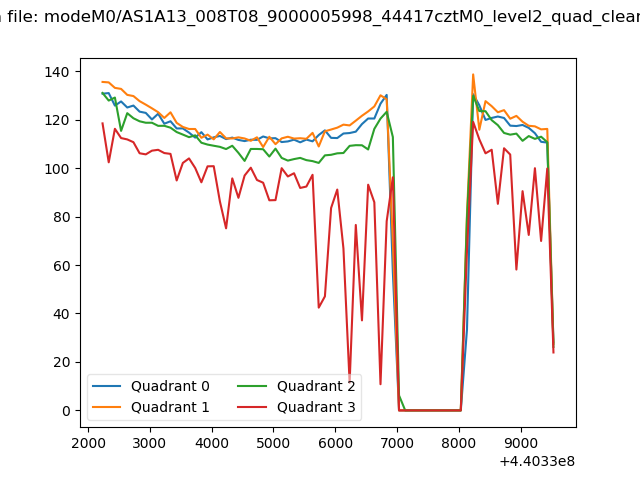 |
|
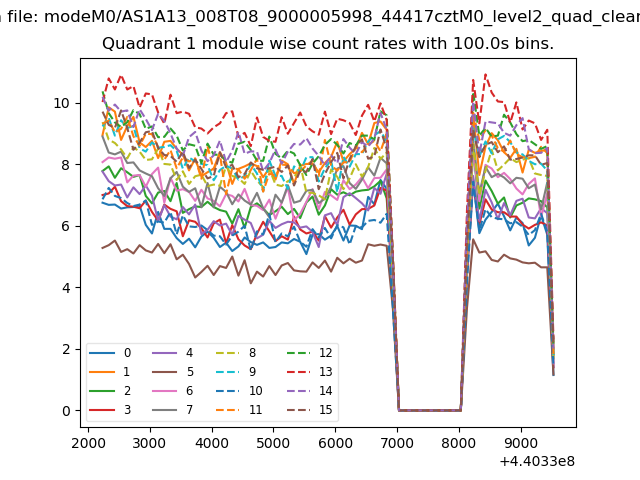
| Module-wise count rates for Quadrant A Data is divided into 100 sec bins |
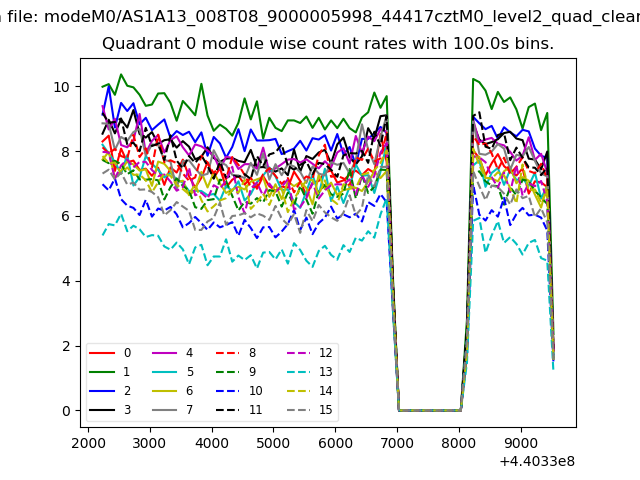 |
 |
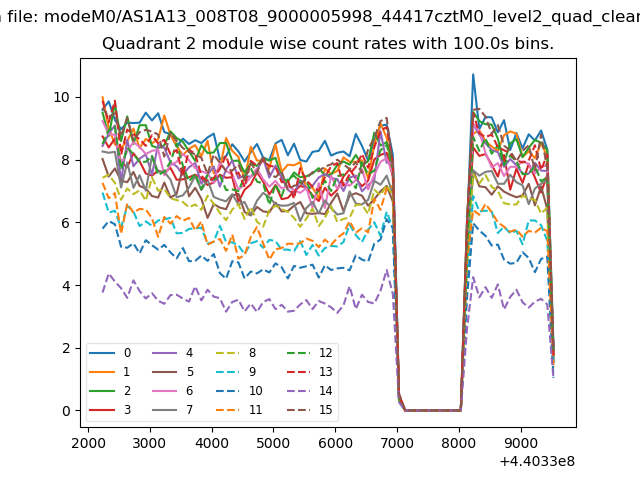
| Module-wise count rates for Quadrant B Data is divided into 100 sec bins |
 |
 |
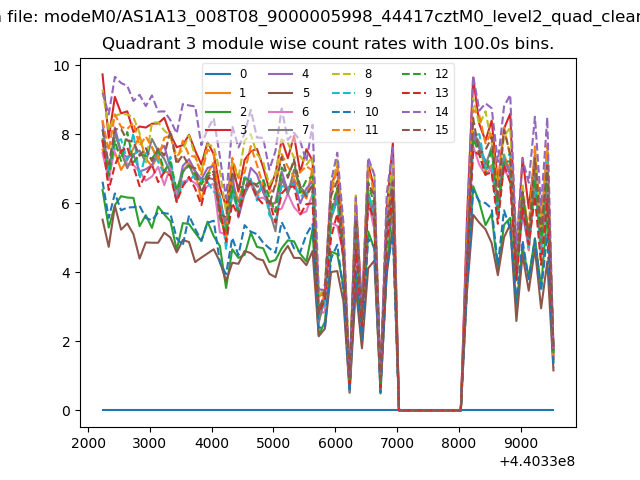
| Module-wise count rates for Quadrant C Data is divided into 100 sec bins |
 |
 |
| Module-wise count rates for Quadrant D Data is divided into 100 sec bins |
 |
 |
| Parameter | Plot |
|---|---|
| CZT HV Monitor | 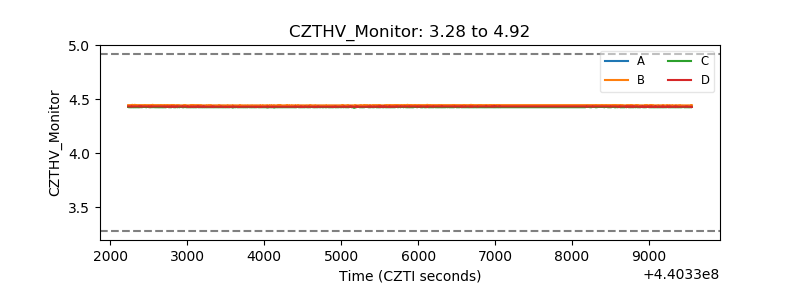 |
| D_VDD | 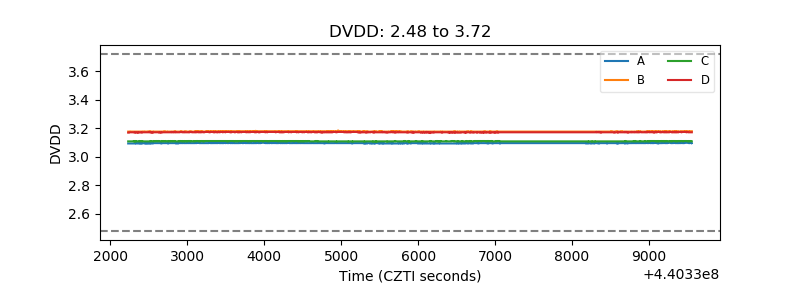 |
| Temperature 1 | 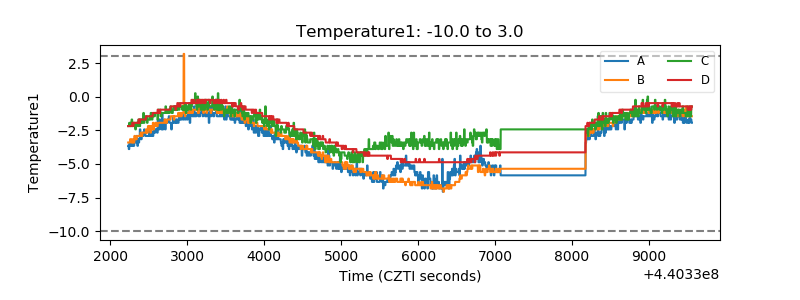 |
| Veto HV Monitor |  |
| Veto LLD | 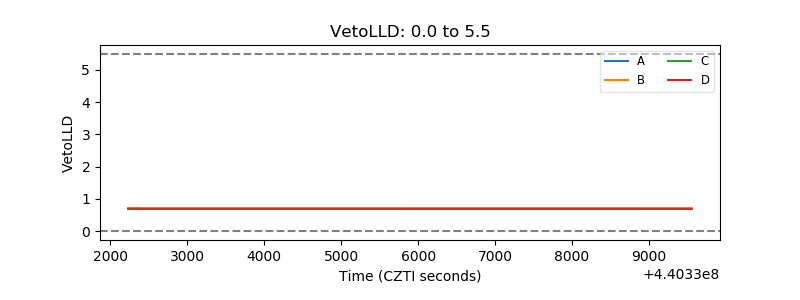 |
| Alpha Counter | 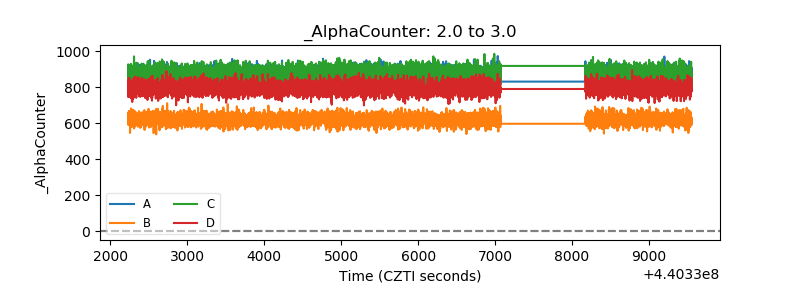 |
| _CPM_Rate | 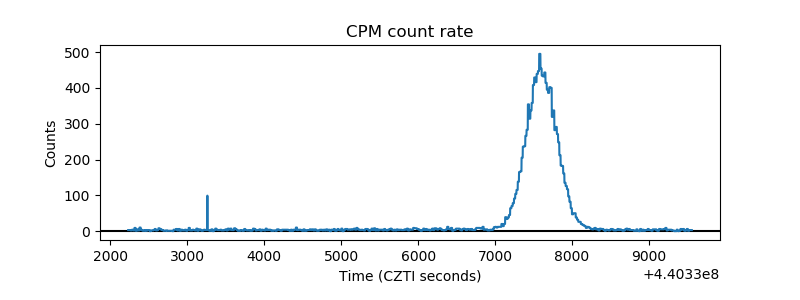 |
| CZT Counter | 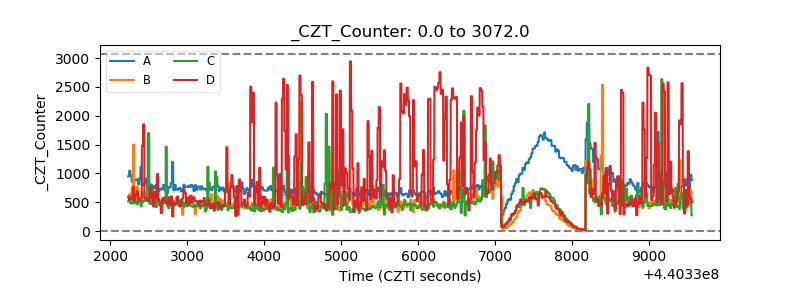 |
| +2.5 Volts monitor | 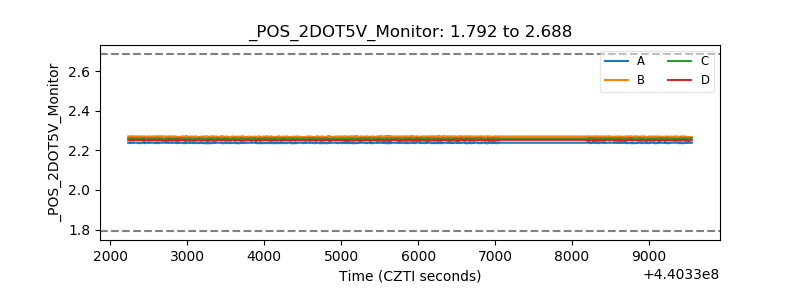 |
| +5 Volts monitor | 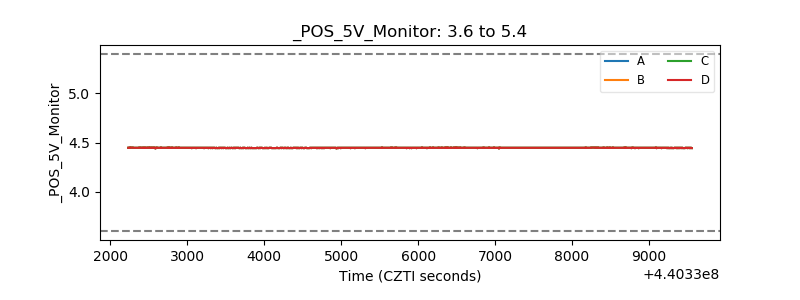 |
| _ROLL_ROT | 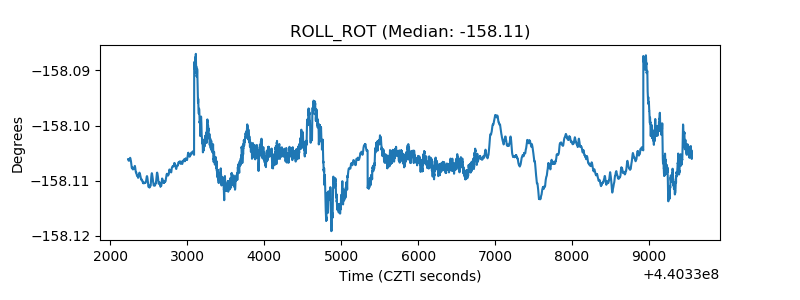 |
| _Roll_DEC | 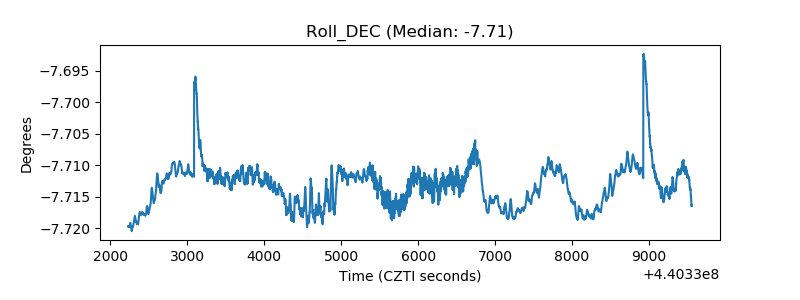 |
| _Roll_RA | 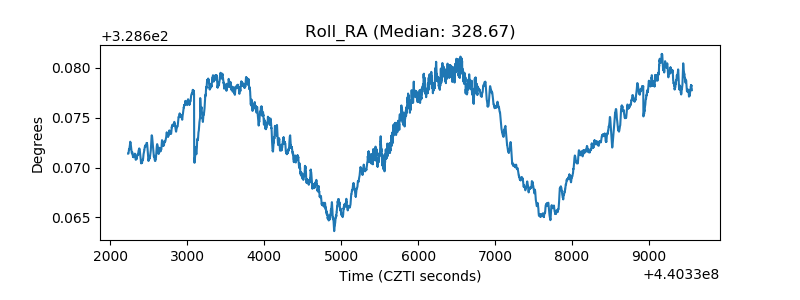 |
| Veto Counter | 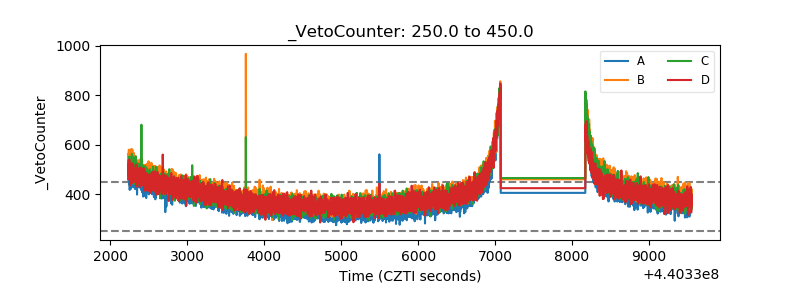 |