| Param | Original file | Final file |
|---|---|---|
| Filename | modeM0/AS1A13_008T08_9000005998_44418cztM0_level2.fits | modeM0/AS1A13_008T08_9000005998_44418cztM0_level2_quad_clean.evt |
| Size (bytes) | 598,867,200 | 108,576,000 |
| Size | 571.1 MB | 103.5 MB |
| Events in quadrant A | 5,515,474 | 751,884 |
| Events in quadrant B | 3,849,703 | 778,589 |
| Events in quadrant C | 4,370,473 | 727,778 |
| Events in quadrant D | 7,902,321 | 552,435 |
| Mode SS | |||
|---|---|---|---|
| Quadrant | BADHDUFLAG | Total packets | Discarded packets |
| A | 0 | 140 | 0 |
| B | 0 | 140 | 0 |
| C | 0 | 140 | 0 |
| D | 0 | 140 | 0 |
| Mode M0 | |||
|---|---|---|---|
| Quadrant | BADHDUFLAG | Total packets | Discarded packets |
| A | 0 | 21864 | 1 |
| B | 0 | 15934 | 1 |
| C | 0 | 17801 | 1 |
| D | 0 | 28184 | 1 |
| Mode M9 | |||
|---|---|---|---|
| Quadrant | BADHDUFLAG | Total packets | Discarded packets |
| A | 0 | 9 | 0 |
| B | 0 | 9 | 0 |
| C | 0 | 9 | 0 |
| D | 0 | 9 | 0 |
| Quadrant | Total seconds | Saturated seconds | Saturation percentage |
|---|---|---|---|
| A | 6835 | 273 | 3.994148% |
| B | 6836 | 163 | 2.384435% |
| C | 6836 | 324 | 4.739614% |
| D | 6836 | 1625 | 23.771211% |
Noise dominated data is calculated using 1-second bins in cleaned event files. If a bin has >2000 counts, and if more than 50% of those come from <1% of pixels, then it is considered to be noise-dominated and hence unusable.
| Quadrant | # 1 sec bins | Bins with >0 counts | Bins with >2000 counts | High rate bins dominated by noise | Noise dominated (total time) | Noise dominated (detector-on time) | Marked lightcurve |
|---|---|---|---|---|---|---|---|
| A | 7735 | 6836 | 99 | 99 | 1.28% | 1.45% | 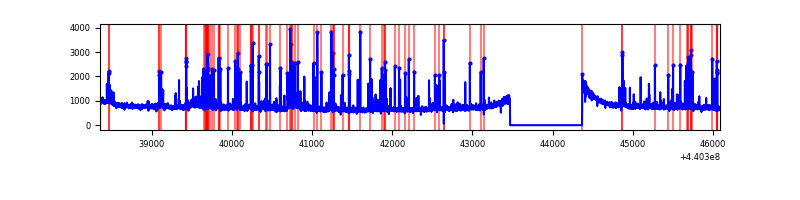 |
| B | 7736 | 6837 | 62 | 62 | 0.80% | 0.91% | 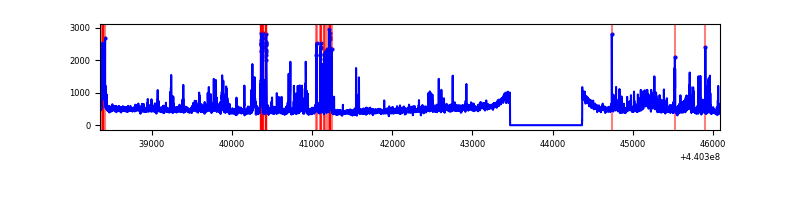 |
| C | 7736 | 6837 | 189 | 189 | 2.44% | 2.76% | 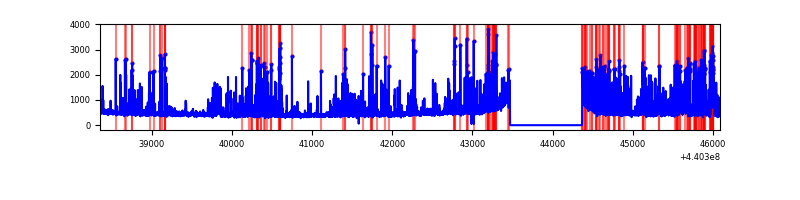 |
| D | 7736 | 6837 | 1431 | 1431 | 18.50% | 20.93% | 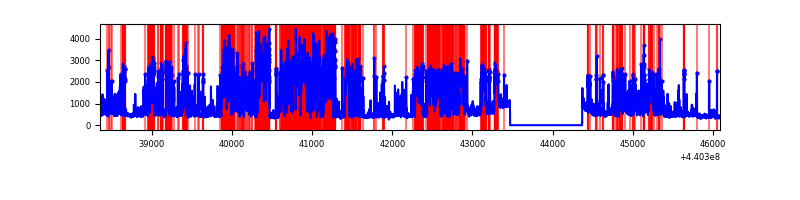 |
Top three noisy pixels from each quadrant. If the there are fewer than three noisy pixels in the level2.evt file, extra rows are filled as -1
| Pixel properties | Quadrant properties | ||||||
|---|---|---|---|---|---|---|---|
| Quadrant | DetID | PixID | Counts | Sigma | Mean | Median | Sigma |
| A | 10 | 83 | 1902020 | 11622.55 | 785 | 768 | 163.6 |
| A | 15 | 223 | 445017 | 2715.74 | 785 | 768 | 163.6 |
| A | 13 | 248 | 66289 | 400.54 | 785 | 768 | 163.6 |
| B | 5 | 235 | 355456 | 2274.19 | 788 | 765 | 156.0 |
| B | 0 | 229 | 129446 | 825.07 | 788 | 765 | 156.0 |
| B | 0 | 155 | 100465 | 639.25 | 788 | 765 | 156.0 |
| C | 12 | 16 | 907045 | 5122.13 | 750 | 755 | 176.9 |
| C | 14 | 254 | 243005 | 1369.14 | 750 | 755 | 176.9 |
| C | 2 | 14 | 210552 | 1185.72 | 750 | 755 | 176.9 |
| D | 5 | 222 | 2128637 | 12244.98 | 687 | 665 | 173.8 |
| D | 4 | 221 | 955927 | 5496.86 | 687 | 665 | 173.8 |
| D | 2 | 249 | 935904 | 5381.64 | 687 | 665 | 173.8 |
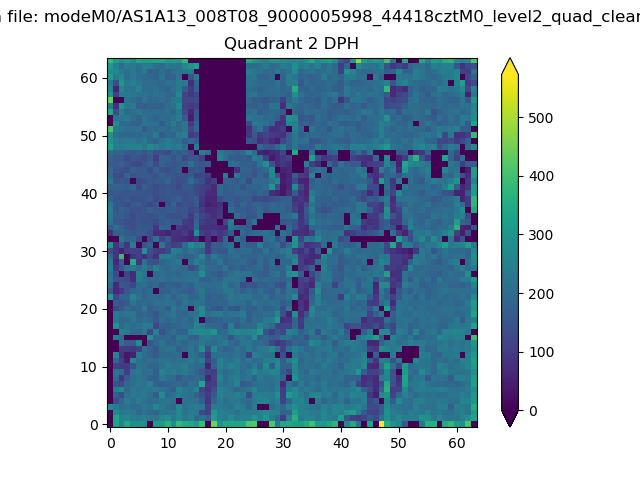
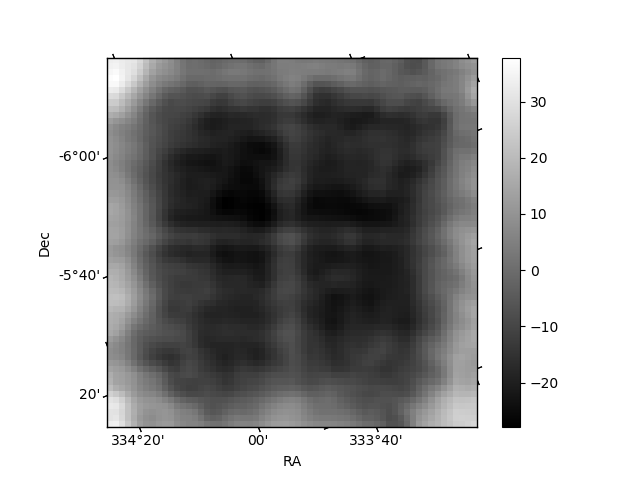
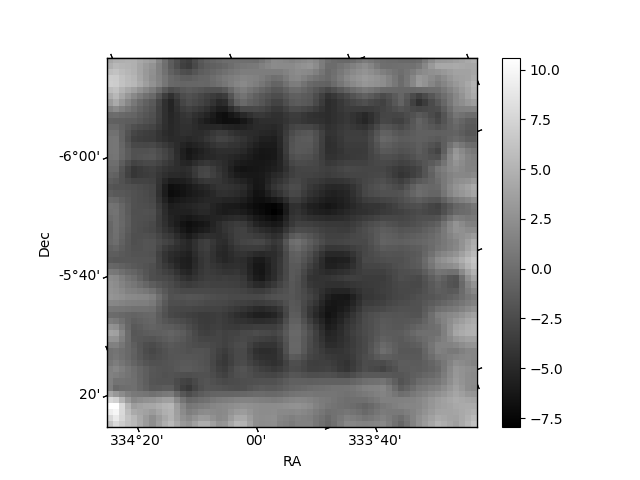
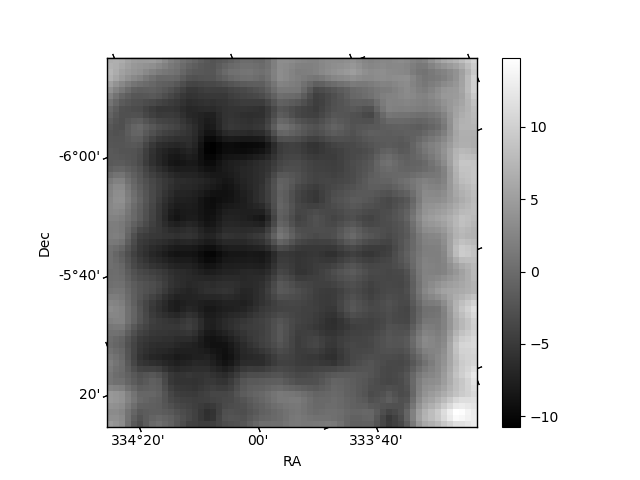
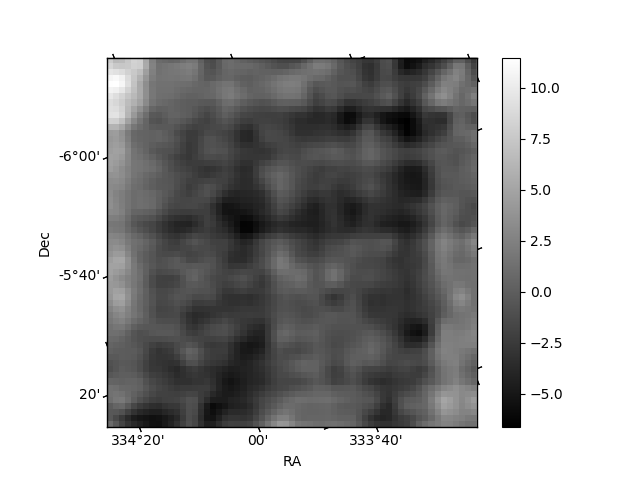
Histogram calculated using DETX and DETY for each event in the final _common_clean file
| Quadrant A | 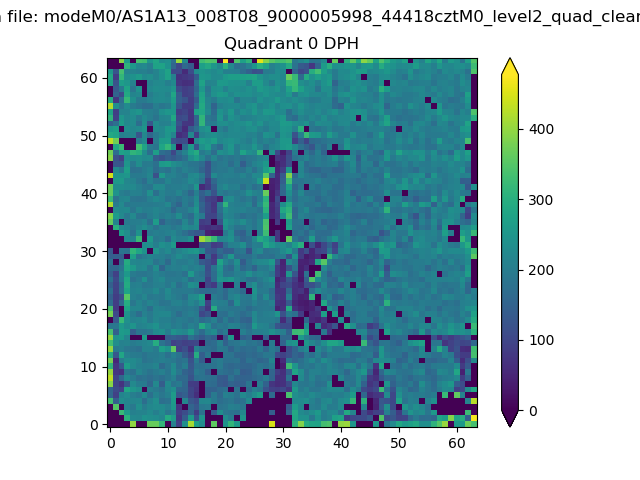 |
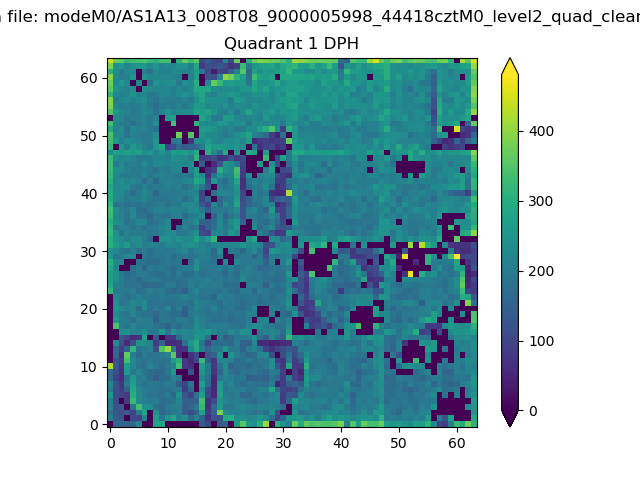 |
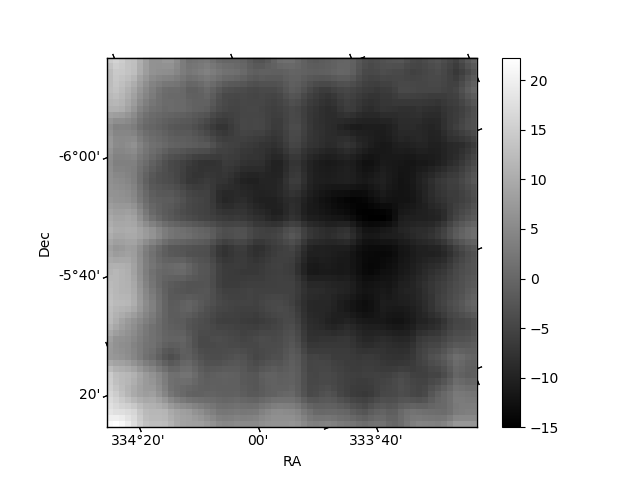
Quadrant B |
|---|---|---|---|
| Quadrant D | 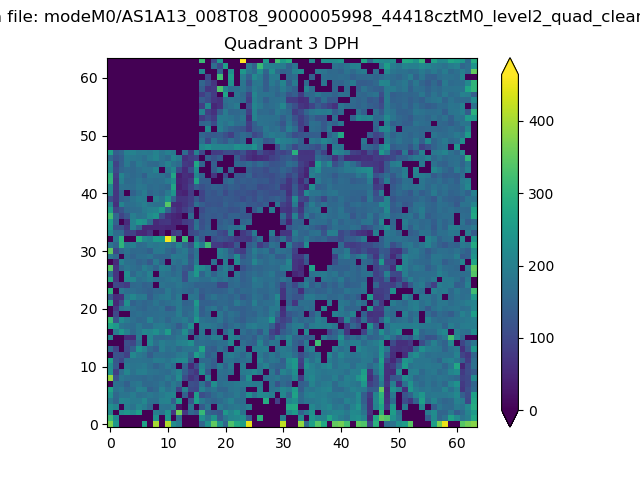 |
 |
Quadrant C |
| Plot type | Count rate plots | Images |
|---|---|---|
| Comparison with Poisson distribution Blue bars denote a histogram of data divided into 1 sec bins. Red curve is a Poisson curve with rate = median count rate of data. |
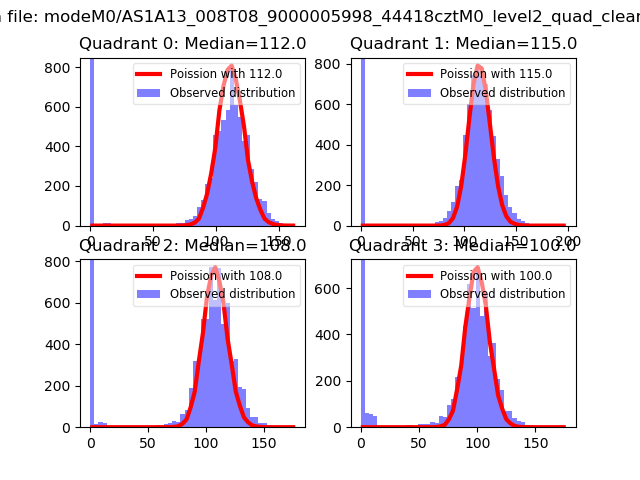 |
 |
| Quadrant-wise count rates Data is divided into 100 sec bins |
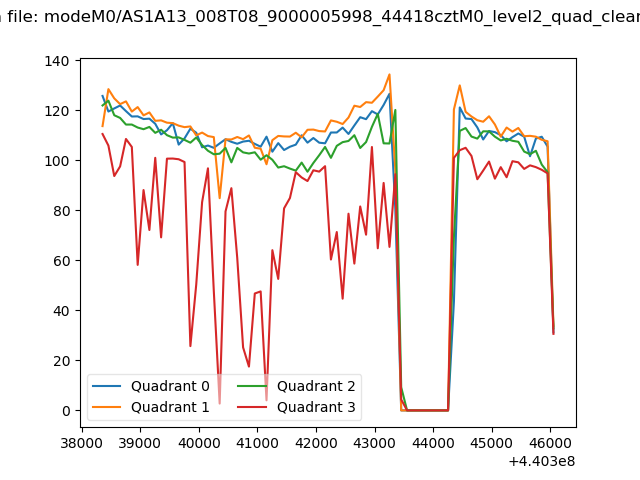 |
|
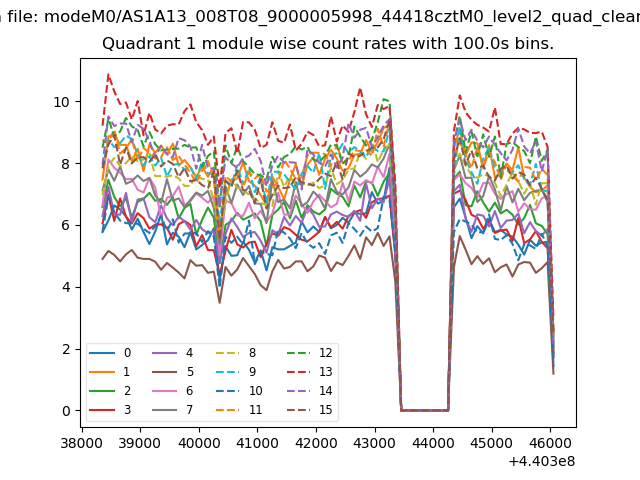
| Module-wise count rates for Quadrant A Data is divided into 100 sec bins |
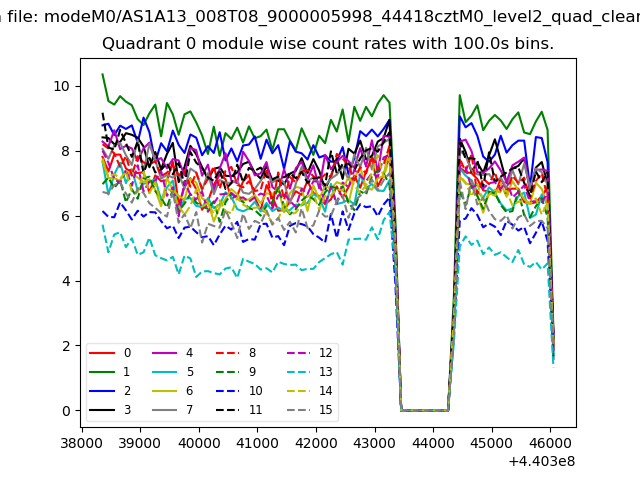 |
 |
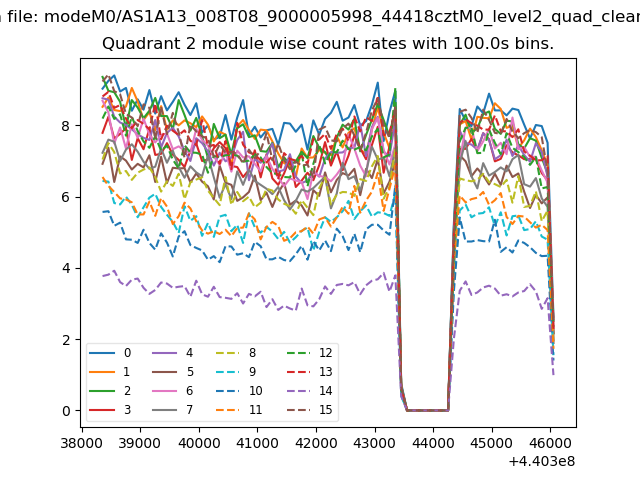
| Module-wise count rates for Quadrant B Data is divided into 100 sec bins |
 |
 |
| Module-wise count rates for Quadrant C Data is divided into 100 sec bins |
 |
 |
| Module-wise count rates for Quadrant D Data is divided into 100 sec bins |
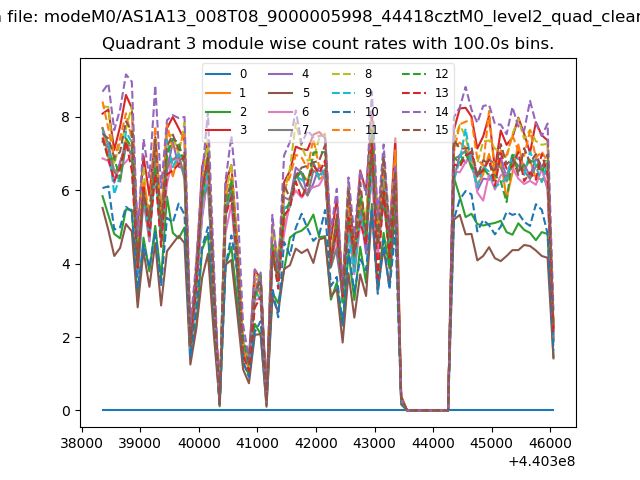 |
 |
| Parameter | Plot |
|---|---|
| CZT HV Monitor | 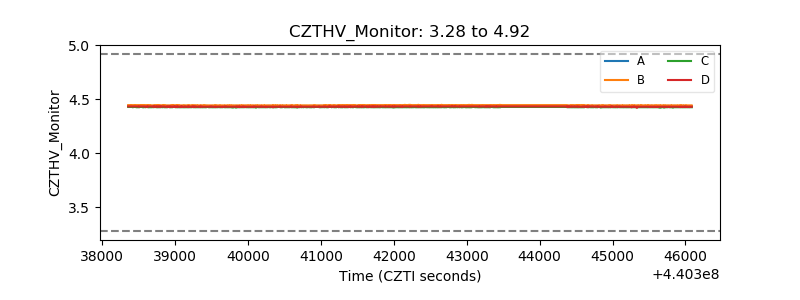 |
| D_VDD | 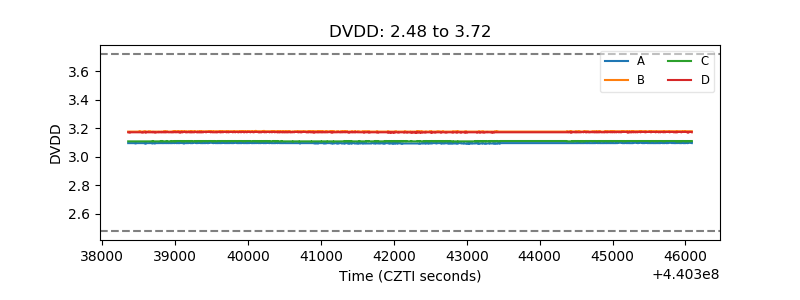 |
| Temperature 1 | 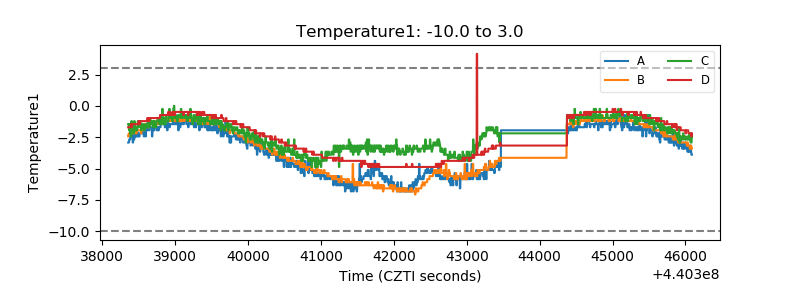 |
| Veto HV Monitor | 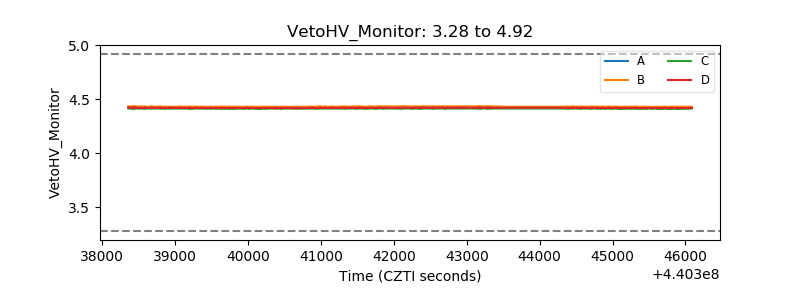 |
| Veto LLD | 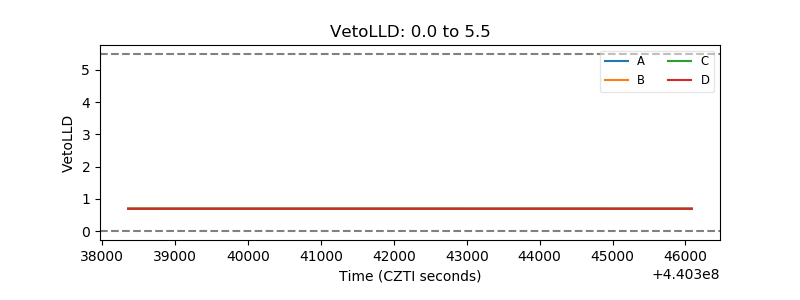 |
| Alpha Counter | 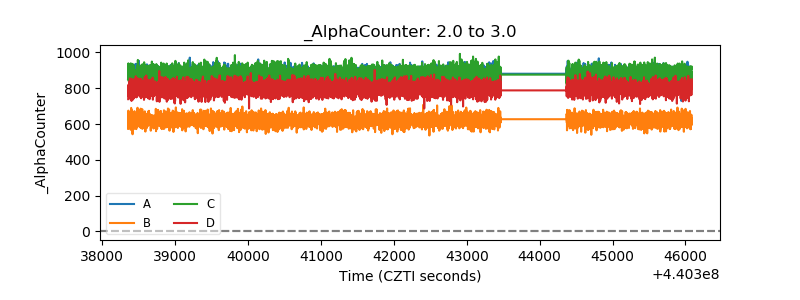 |
| _CPM_Rate | 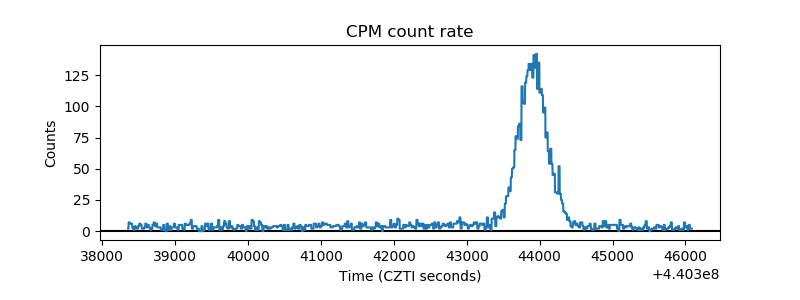 |
| CZT Counter |  |
| +2.5 Volts monitor | 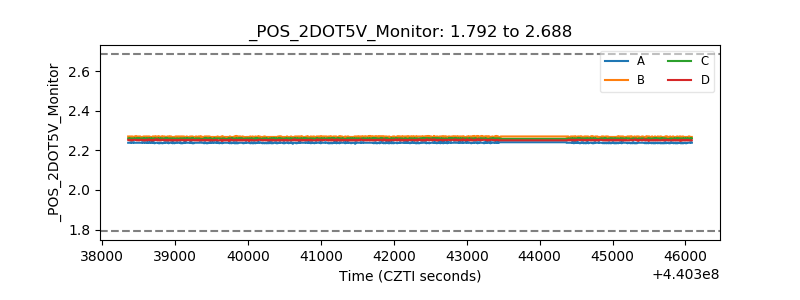 |
| +5 Volts monitor | 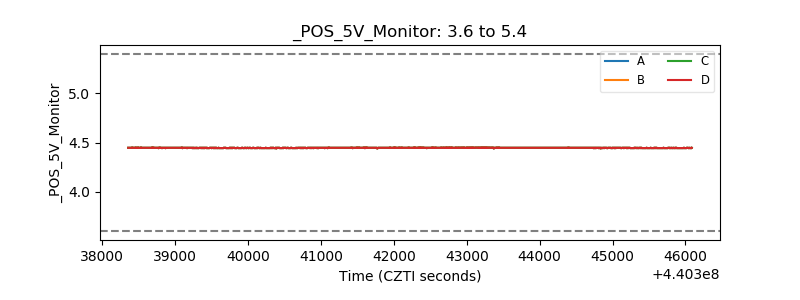 |
| _ROLL_ROT | 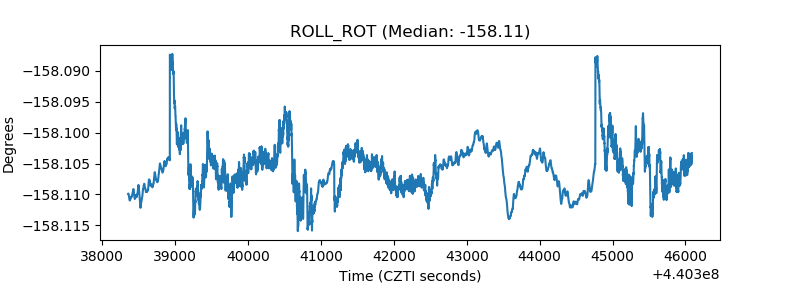 |
| _Roll_DEC | 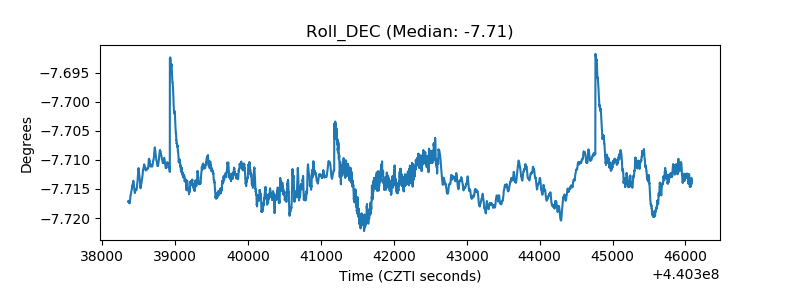 |
| _Roll_RA | 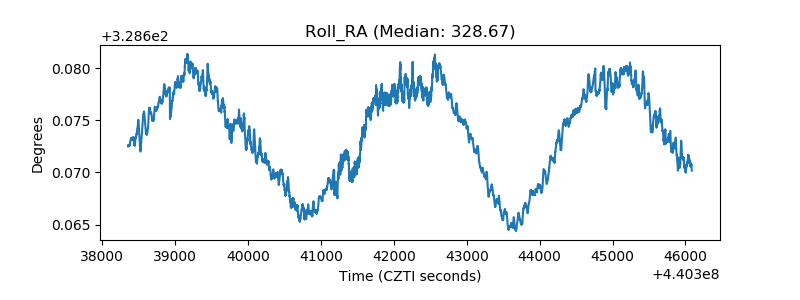 |
| Veto Counter | 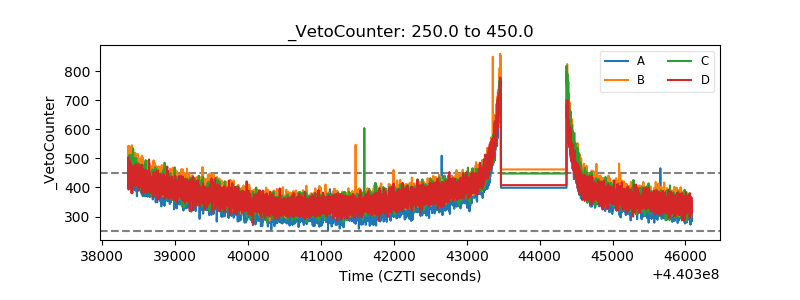 |