| Param | Original file | Final file |
|---|---|---|
| Filename | modeM0/AS1A13_072T03_9000006000_44420cztM0_level2.fits | modeM0/AS1A13_072T03_9000006000_44420cztM0_level2_quad_clean.evt |
| Size (bytes) | 349,378,560 | 73,555,200 |
| Size | 333.2 MB | 70.1 MB |
| Events in quadrant A | 3,243,101 | 498,862 |
| Events in quadrant B | 2,322,683 | 512,074 |
| Events in quadrant C | 2,790,505 | 479,103 |
| Events in quadrant D | 4,215,300 | 410,979 |
| Mode SS | |||
|---|---|---|---|
| Quadrant | BADHDUFLAG | Total packets | Discarded packets |
| A | 0 | 94 | 0 |
| B | 0 | 94 | 0 |
| C | 0 | 94 | 0 |
| D | 0 | 94 | 0 |
| Mode M0 | |||
|---|---|---|---|
| Quadrant | BADHDUFLAG | Total packets | Discarded packets |
| A | 0 | 13440 | 0 |
| B | 0 | 10047 | 0 |
| C | 0 | 11468 | 0 |
| D | 0 | 15774 | 1 |
| Quadrant | Total seconds | Saturated seconds | Saturation percentage |
|---|---|---|---|
| A | 4634 | 198 | 4.272767% |
| B | 4634 | 179 | 3.862754% |
| C | 4634 | 274 | 5.912818% |
| D | 4633 | 638 | 13.770775% |
Noise dominated data is calculated using 1-second bins in cleaned event files. If a bin has >2000 counts, and if more than 50% of those come from <1% of pixels, then it is considered to be noise-dominated and hence unusable.
| Quadrant | # 1 sec bins | Bins with >0 counts | Bins with >2000 counts | High rate bins dominated by noise | Noise dominated (total time) | Noise dominated (detector-on time) | Marked lightcurve |
|---|---|---|---|---|---|---|---|
| A | 4634 | 4634 | 0 | 0 | 0.00% | 0.00% | 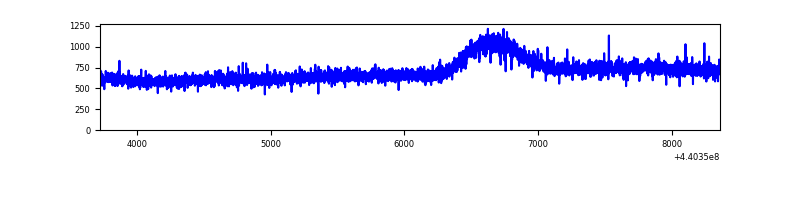 |
| B | 4634 | 4634 | 2 | 2 | 0.04% | 0.04% | 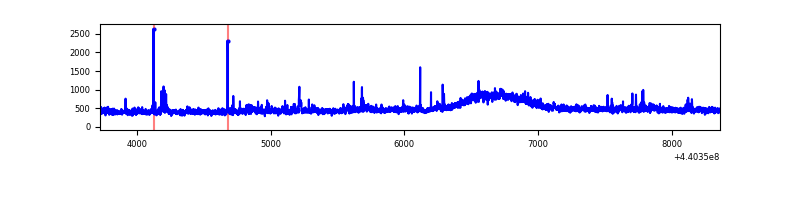 |
| C | 4634 | 4634 | 82 | 82 | 1.77% | 1.77% | 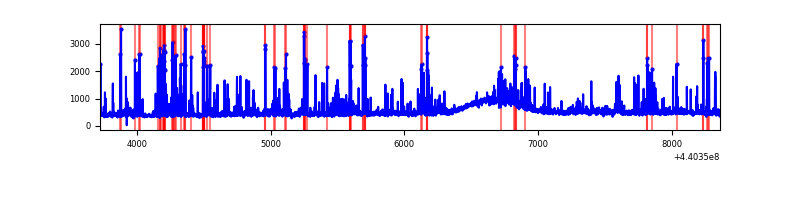 |
| D | 4633 | 4633 | 452 | 452 | 9.76% | 9.76% | 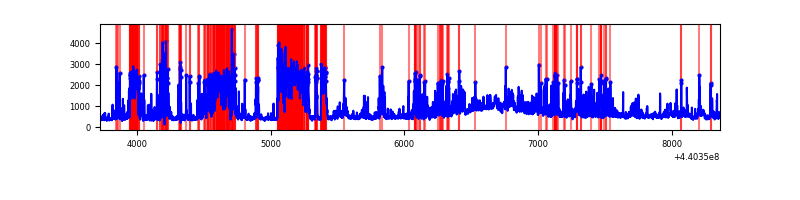 |
Top three noisy pixels from each quadrant. If the there are fewer than three noisy pixels in the level2.evt file, extra rows are filled as -1
| Pixel properties | Quadrant properties | ||||||
|---|---|---|---|---|---|---|---|
| Quadrant | DetID | PixID | Counts | Sigma | Mean | Median | Sigma |
| A | 10 | 83 | 1053861 | 8876.35 | 560 | 545 | 118.7 |
| A | 8 | 4 | 25684 | 211.85 | 560 | 545 | 118.7 |
| A | 3 | 137 | 6562 | 50.71 | 560 | 545 | 118.7 |
| B | 0 | 229 | 38001 | 331.52 | 556 | 538 | 113.0 |
| B | 0 | 190 | 29208 | 253.71 | 556 | 538 | 113.0 |
| B | 0 | 155 | 14724 | 125.54 | 556 | 538 | 113.0 |
| C | 12 | 16 | 441824 | 3407.06 | 542 | 543 | 129.5 |
| C | 3 | 233 | 149781 | 1152.24 | 542 | 543 | 129.5 |
| C | 14 | 254 | 67122 | 514.05 | 542 | 543 | 129.5 |
| D | 4 | 221 | 714114 | 5383.04 | 525 | 506 | 132.6 |
| D | 2 | 249 | 493000 | 3715.09 | 525 | 506 | 132.6 |
| D | 13 | 249 | 465587 | 3508.3 | 525 | 506 | 132.6 |
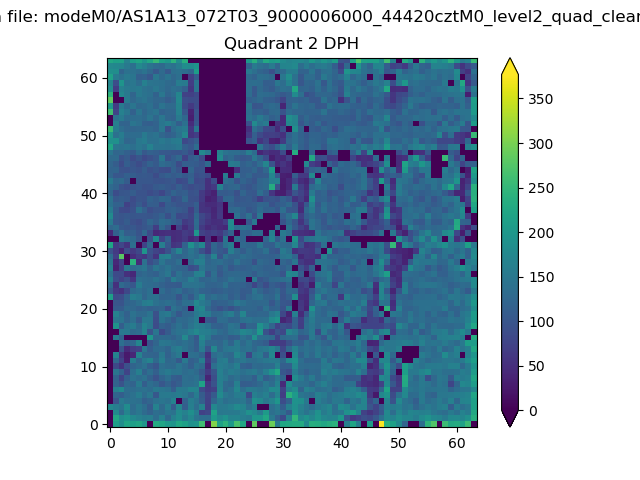
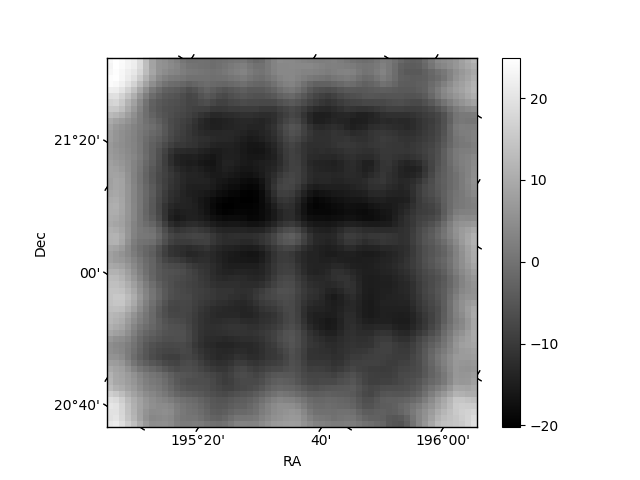
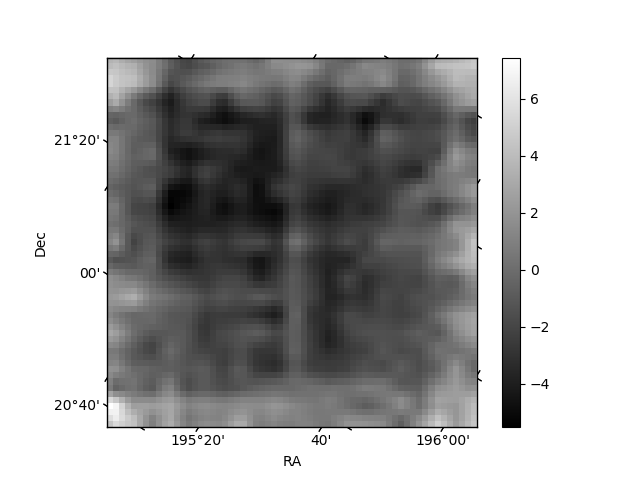
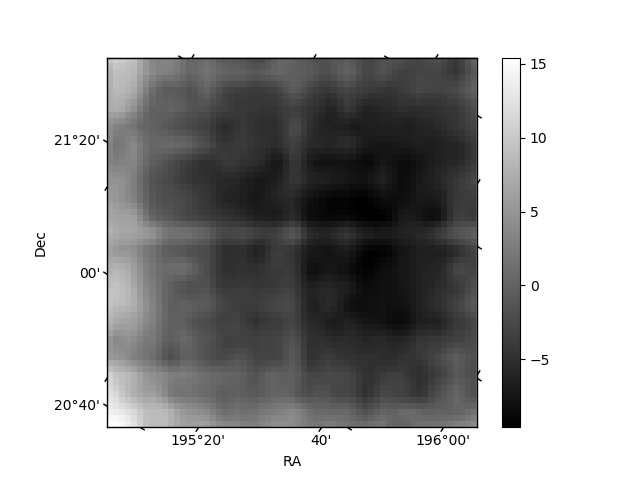
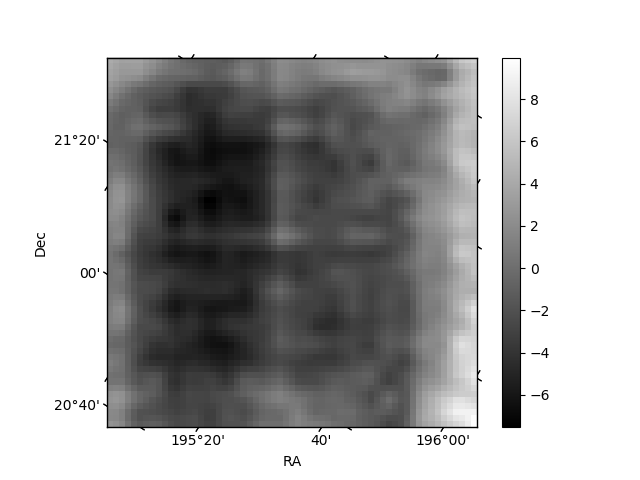
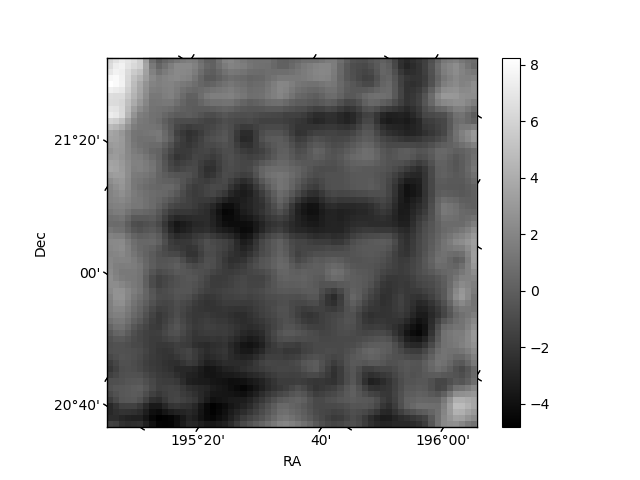
Histogram calculated using DETX and DETY for each event in the final _common_clean file
| Quadrant A | 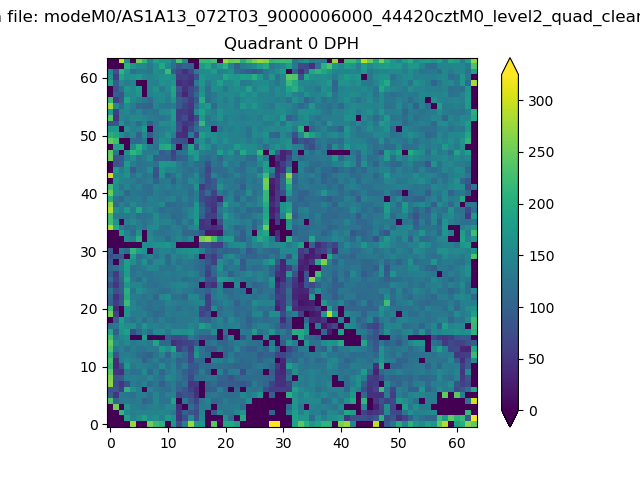 |
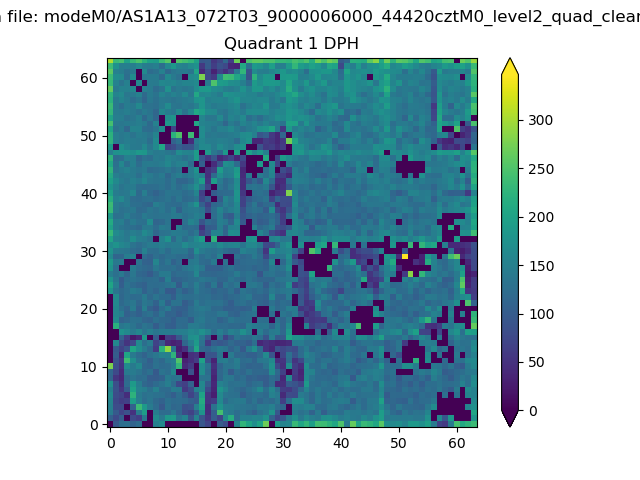 |
Quadrant B |
|---|---|---|---|
| Quadrant D | 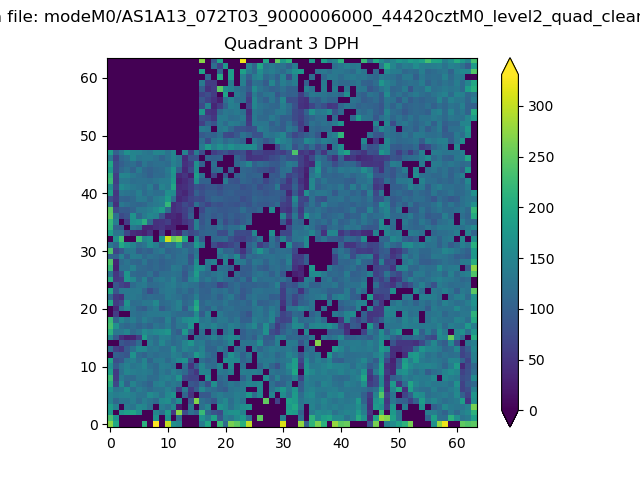 |
 |
Quadrant C |
| Plot type | Count rate plots | Images |
|---|---|---|
| Comparison with Poisson distribution Blue bars denote a histogram of data divided into 1 sec bins. Red curve is a Poisson curve with rate = median count rate of data. |
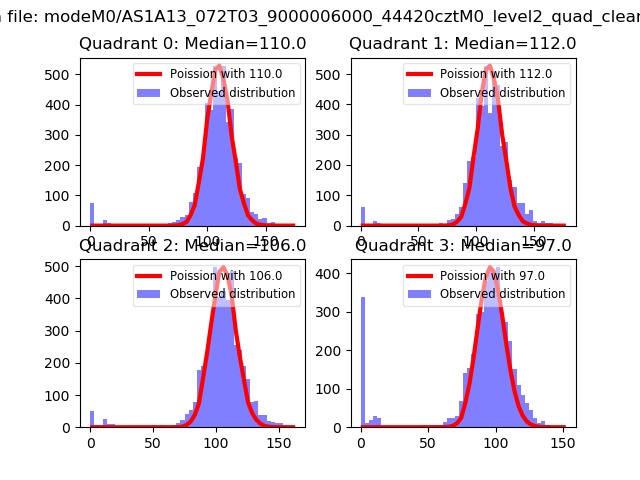 |
 |
| Quadrant-wise count rates Data is divided into 100 sec bins |
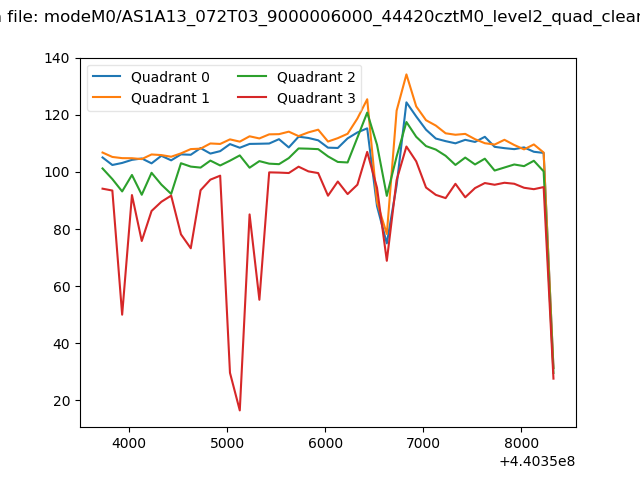 |
|
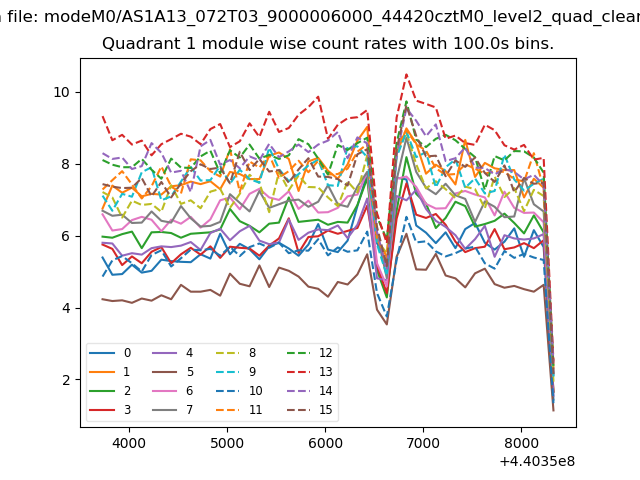
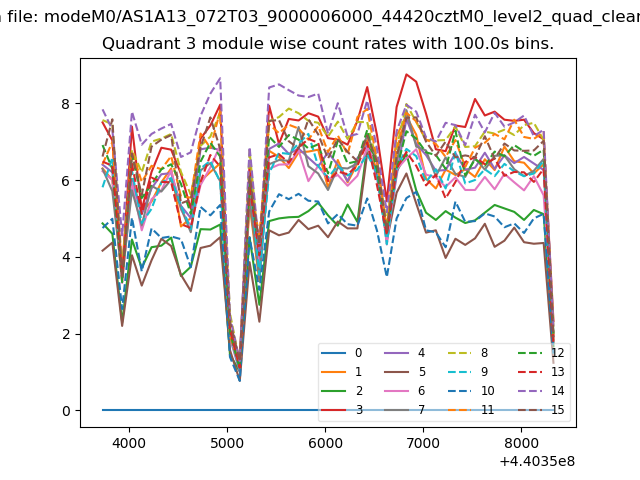
| Module-wise count rates for Quadrant A Data is divided into 100 sec bins |
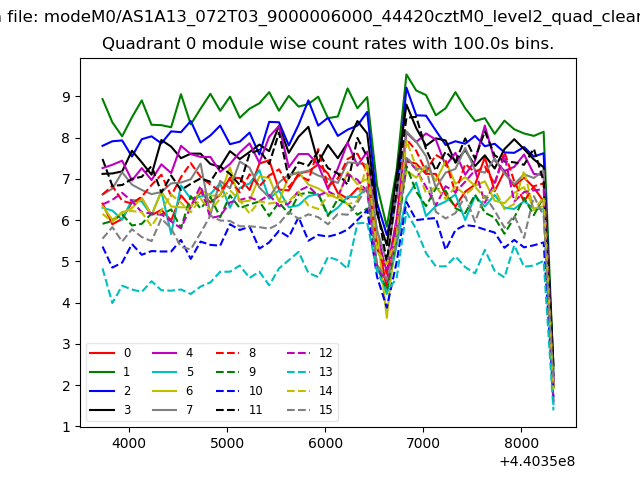 |
 |
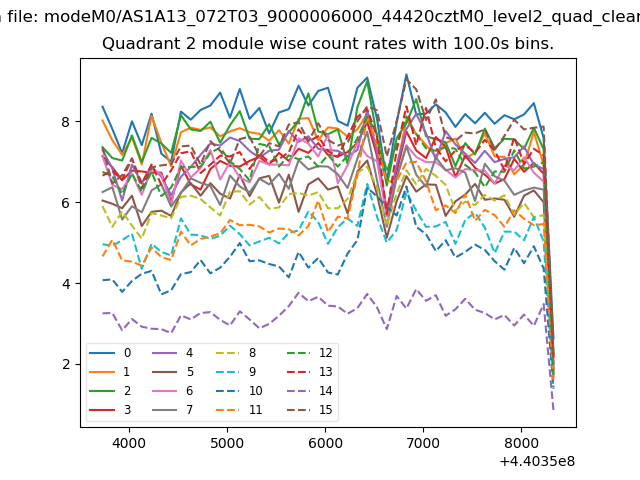
| Module-wise count rates for Quadrant B Data is divided into 100 sec bins |
 |
 |
| Module-wise count rates for Quadrant C Data is divided into 100 sec bins |
 |
 |
| Module-wise count rates for Quadrant D Data is divided into 100 sec bins |
 |
 |
| Parameter | Plot |
|---|---|
| CZT HV Monitor | 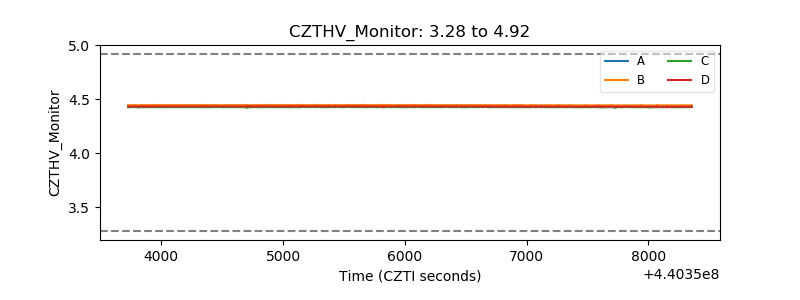 |
| D_VDD | 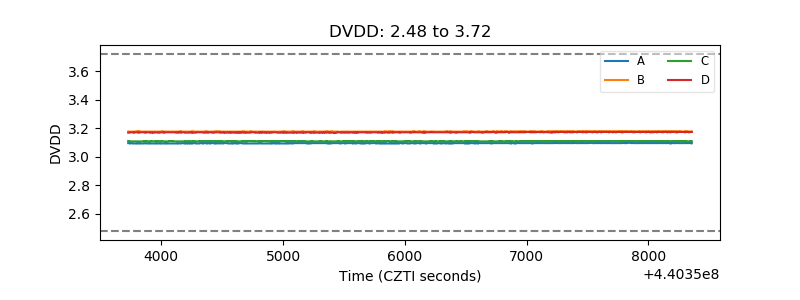 |
| Temperature 1 | 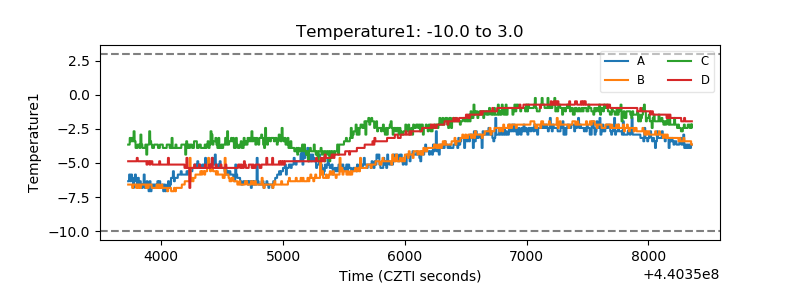 |
| Veto HV Monitor | 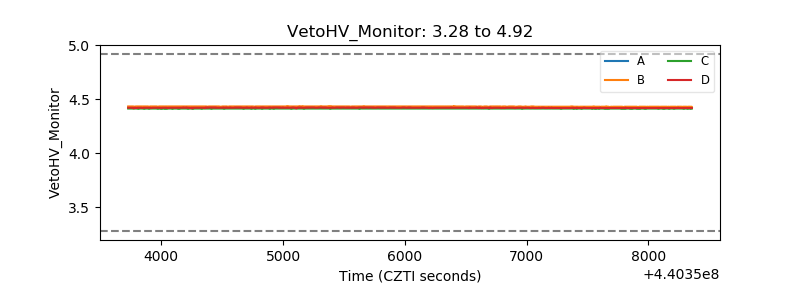 |
| Veto LLD | 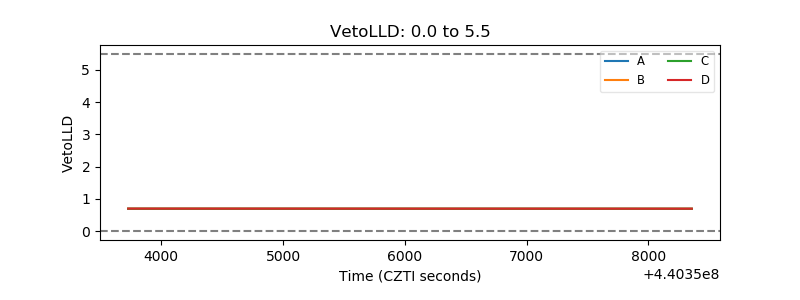 |
| Alpha Counter | 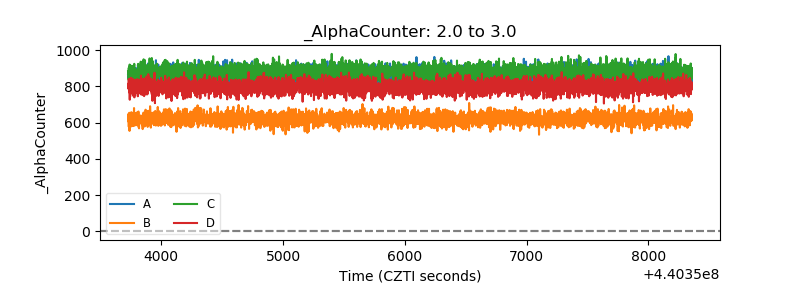 |
| _CPM_Rate | 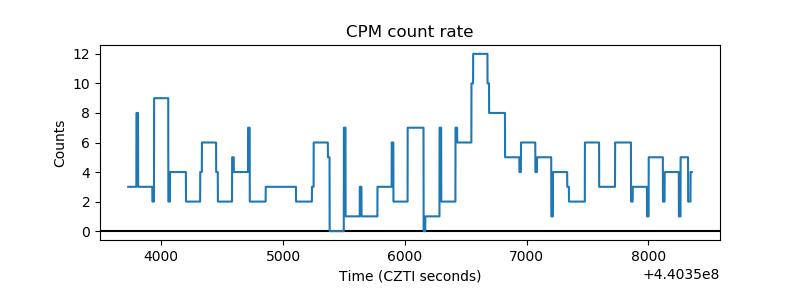 |
| CZT Counter | 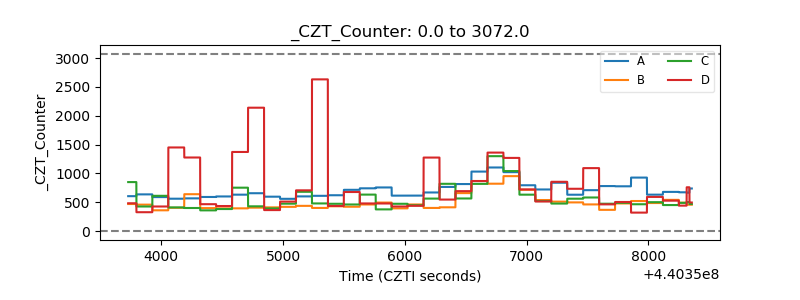 |
| +2.5 Volts monitor | 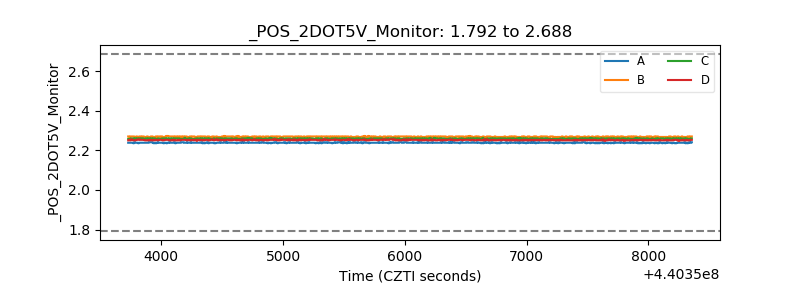 |
| +5 Volts monitor | 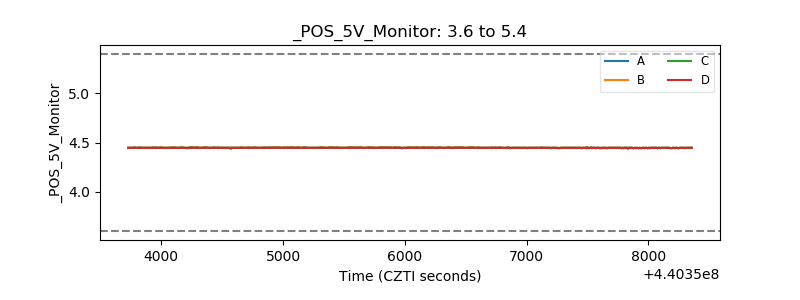 |
| _ROLL_ROT | 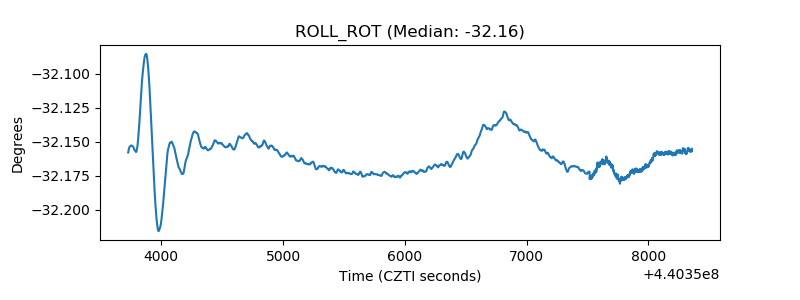 |
| _Roll_DEC | 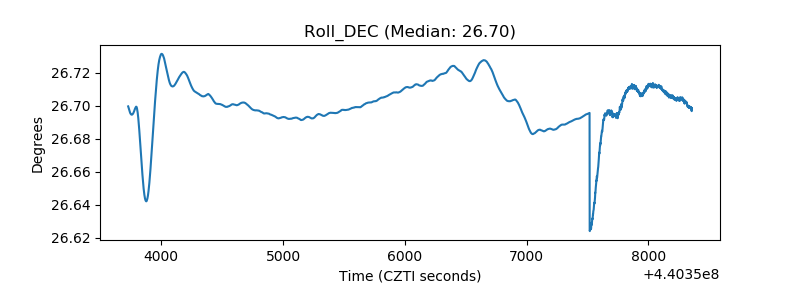 |
| _Roll_RA | 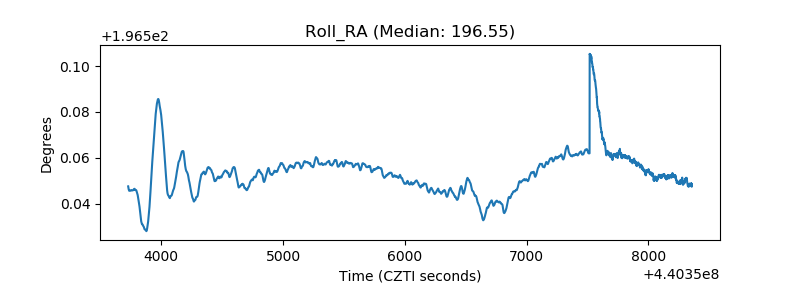 |
| Veto Counter | 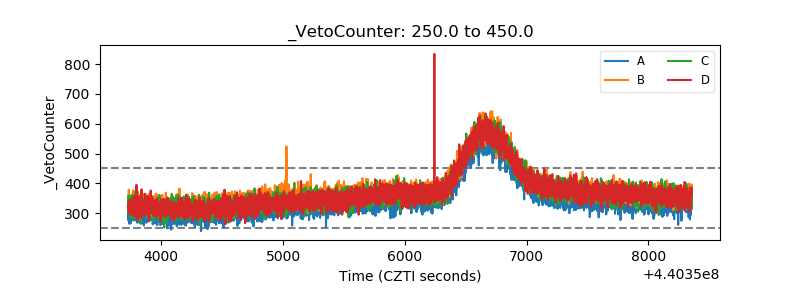 |