| Param | Original file | Final file |
|---|---|---|
| Filename | modeM0/AS1A13_072T03_9000006000_44421cztM0_level2.fits | modeM0/AS1A13_072T03_9000006000_44421cztM0_level2_quad_clean.evt |
| Size (bytes) | 530,023,680 | 116,190,720 |
| Size | 505.5 MB | 110.8 MB |
| Events in quadrant A | 5,091,601 | 791,417 |
| Events in quadrant B | 3,501,419 | 806,295 |
| Events in quadrant C | 3,993,386 | 759,500 |
| Events in quadrant D | 6,462,523 | 648,454 |
| Mode SS | |||
|---|---|---|---|
| Quadrant | BADHDUFLAG | Total packets | Discarded packets |
| A | 0 | 148 | 0 |
| B | 0 | 148 | 0 |
| C | 0 | 148 | 0 |
| D | 0 | 148 | 0 |
| Mode M0 | |||
|---|---|---|---|
| Quadrant | BADHDUFLAG | Total packets | Discarded packets |
| A | 0 | 21219 | 0 |
| B | 0 | 15518 | 0 |
| C | 0 | 17089 | 0 |
| D | 0 | 24313 | 0 |
| Quadrant | Total seconds | Saturated seconds | Saturation percentage |
|---|---|---|---|
| A | 7356 | 75 | 1.019576% |
| B | 7356 | 67 | 0.910821% |
| C | 7357 | 177 | 2.405872% |
| D | 7357 | 787 | 10.697295% |
Noise dominated data is calculated using 1-second bins in cleaned event files. If a bin has >2000 counts, and if more than 50% of those come from <1% of pixels, then it is considered to be noise-dominated and hence unusable.
| Quadrant | # 1 sec bins | Bins with >0 counts | Bins with >2000 counts | High rate bins dominated by noise | Noise dominated (total time) | Noise dominated (detector-on time) | Marked lightcurve |
|---|---|---|---|---|---|---|---|
| A | 7356 | 7356 | 1 | 1 | 0.01% | 0.01% | 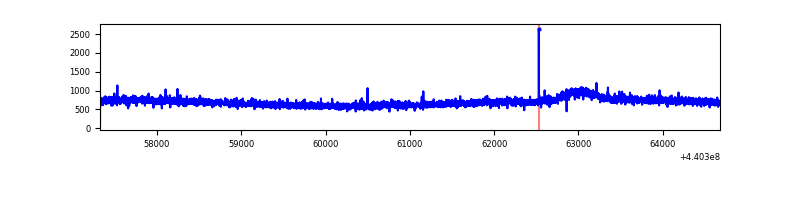 |
| B | 7356 | 7356 | 3 | 3 | 0.04% | 0.04% | 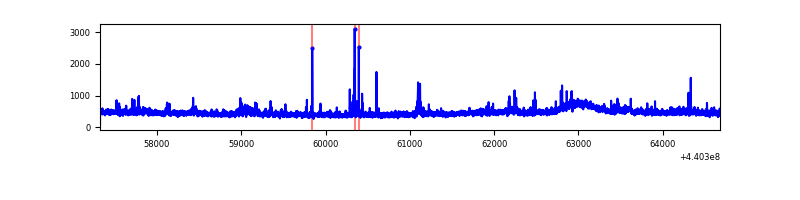 |
| C | 7357 | 7357 | 109 | 109 | 1.48% | 1.48% | 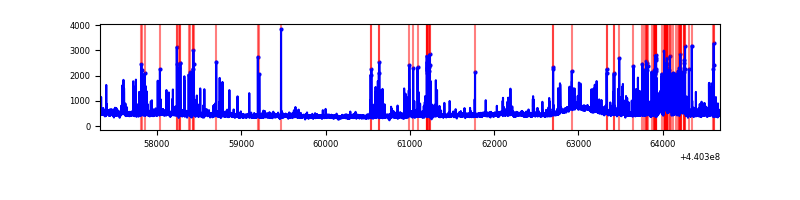 |
| D | 7357 | 7357 | 677 | 677 | 9.20% | 9.20% | 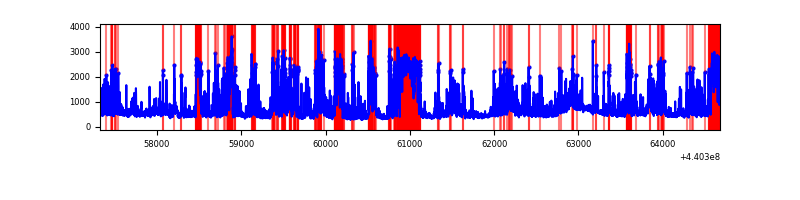 |
Top three noisy pixels from each quadrant. If the there are fewer than three noisy pixels in the level2.evt file, extra rows are filled as -1
| Pixel properties | Quadrant properties | ||||||
|---|---|---|---|---|---|---|---|
| Quadrant | DetID | PixID | Counts | Sigma | Mean | Median | Sigma |
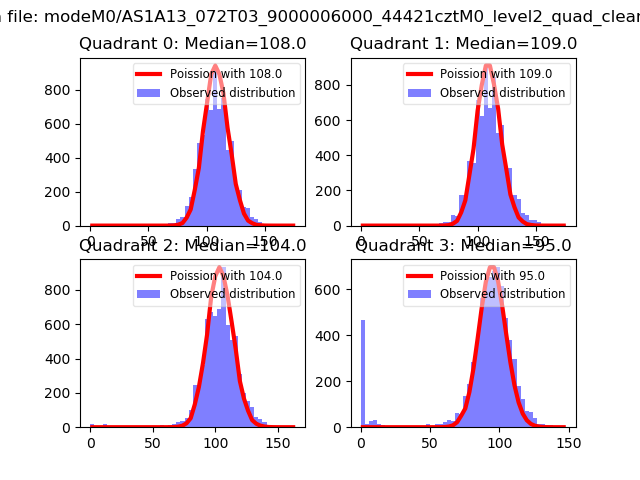
| A | 10 | 83 | 1783670 | 10041.69 | 840 | 821 | 177.5 |
| A | 8 | 4 | 51682 | 286.47 | 840 | 821 | 177.5 |
| A | 3 | 137 | 9682 | 49.91 | 840 | 821 | 177.5 |
| B | 0 | 229 | 101094 | 603.01 | 834 | 808 | 166.3 |
| B | 0 | 190 | 41963 | 247.46 | 834 | 808 | 166.3 |
| B | 4 | 170 | 24165 | 140.44 | 834 | 808 | 166.3 |
| C | 12 | 16 | 434750 | 2258.77 | 815 | 819 | 192.1 |
| C | 15 | 158 | 158984 | 823.31 | 815 | 819 | 192.1 |
| C | 3 | 233 | 129540 | 670.04 | 815 | 819 | 192.1 |
| D | 4 | 221 | 1253966 | 6223.14 | 793 | 767 | 201.4 |
| D | 2 | 249 | 1103721 | 5477.05 | 793 | 767 | 201.4 |
| D | 5 | 235 | 585060 | 2901.48 | 793 | 767 | 201.4 |
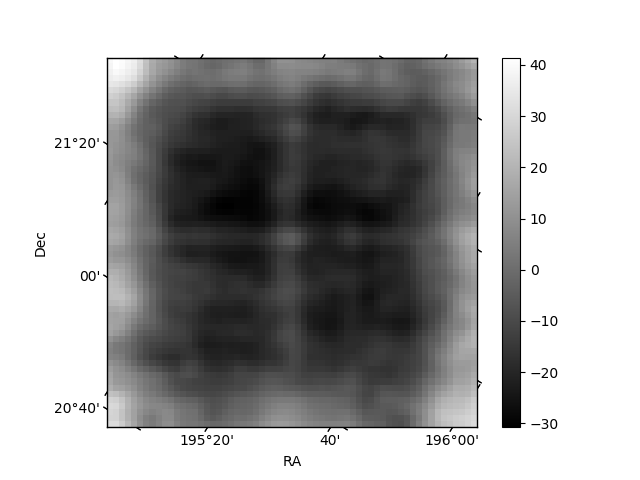
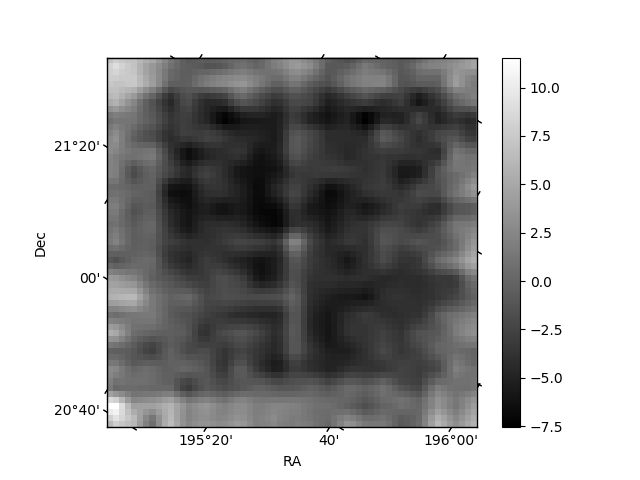
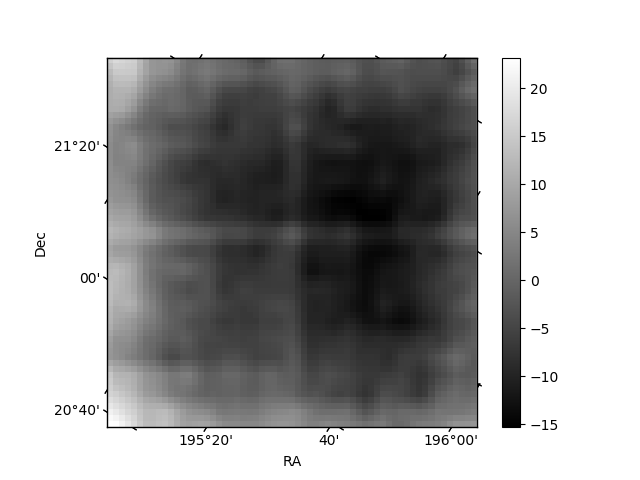
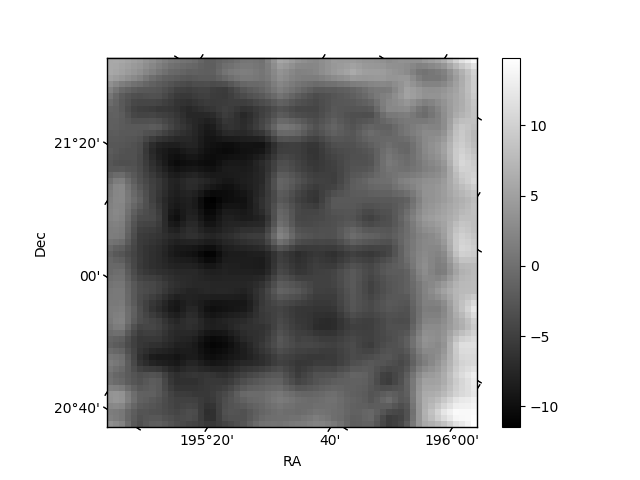
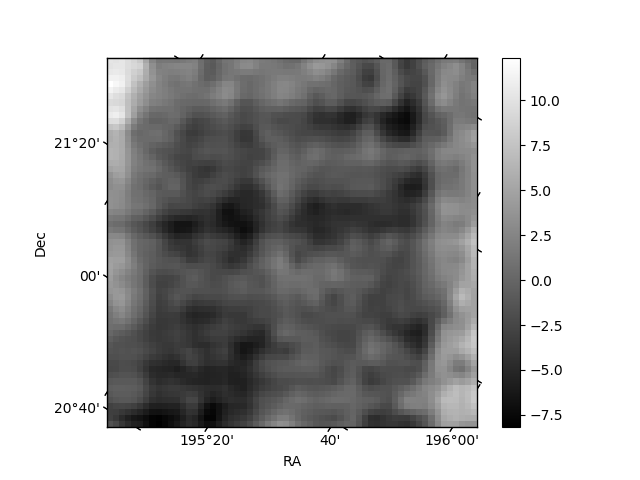
Histogram calculated using DETX and DETY for each event in the final _common_clean file
| Quadrant A | 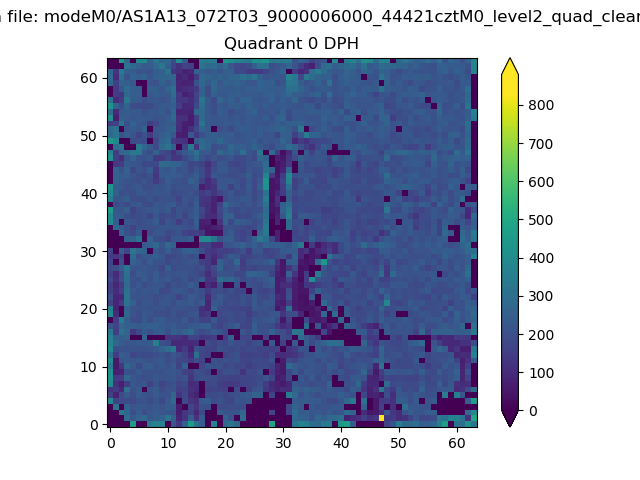 |
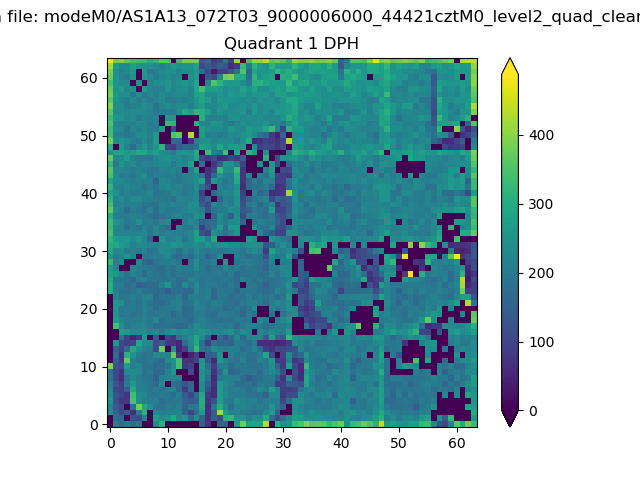 |
Quadrant B |
|---|---|---|---|
| Quadrant D | 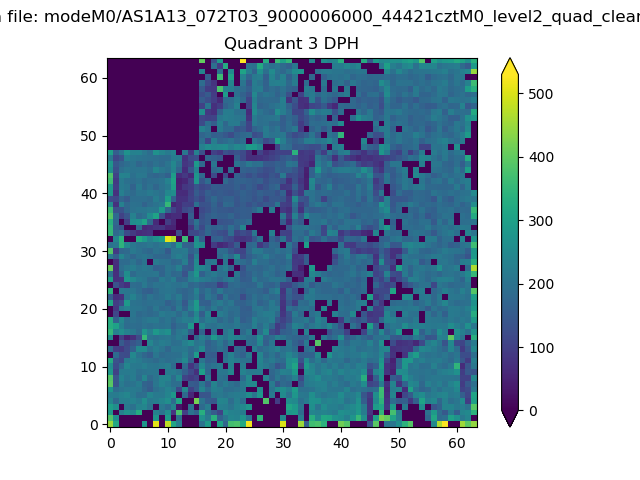 |
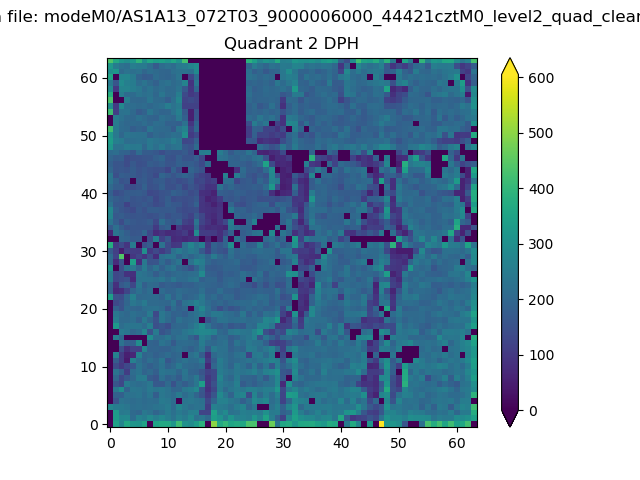 |
Quadrant C |
| Plot type | Count rate plots | Images |
|---|---|---|
| Comparison with Poisson distribution Blue bars denote a histogram of data divided into 1 sec bins. Red curve is a Poisson curve with rate = median count rate of data. |
 |
 |
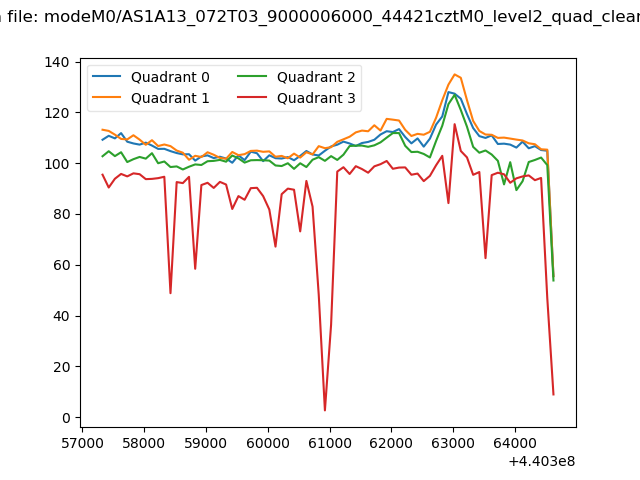
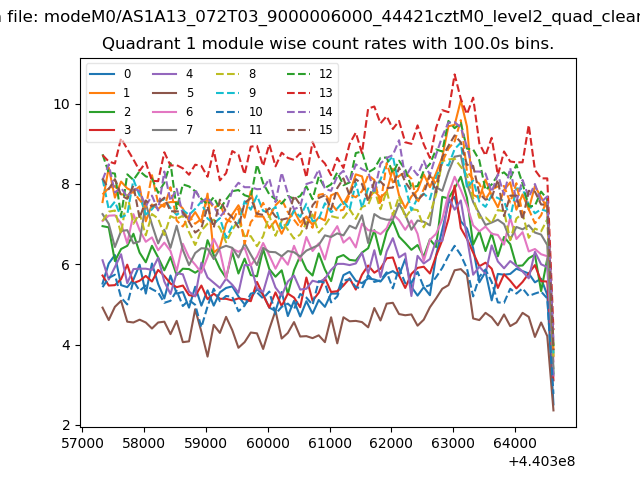
| Quadrant-wise count rates Data is divided into 100 sec bins |
 |
|
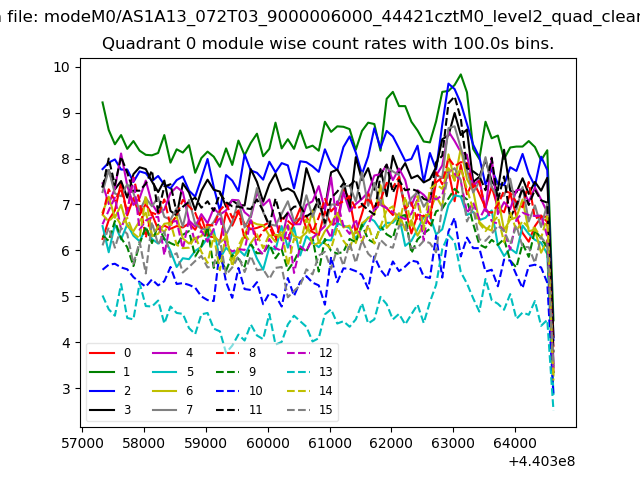
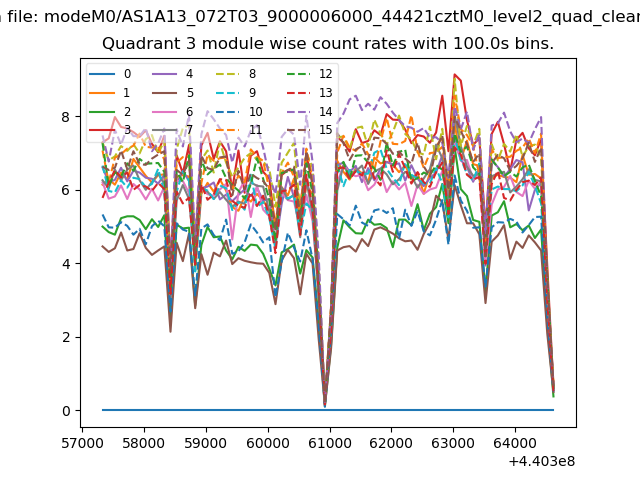
| Module-wise count rates for Quadrant A Data is divided into 100 sec bins |
 |
 |
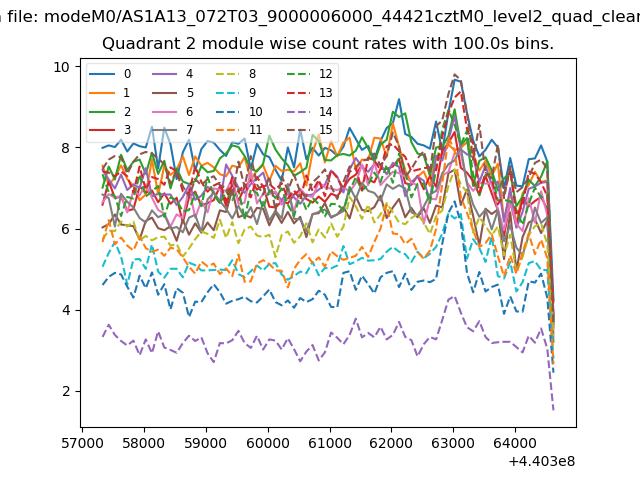
| Module-wise count rates for Quadrant B Data is divided into 100 sec bins |
 |
 |
| Module-wise count rates for Quadrant C Data is divided into 100 sec bins |
 |
 |
| Module-wise count rates for Quadrant D Data is divided into 100 sec bins |
 |
 |
| Parameter | Plot |
|---|---|
| CZT HV Monitor | 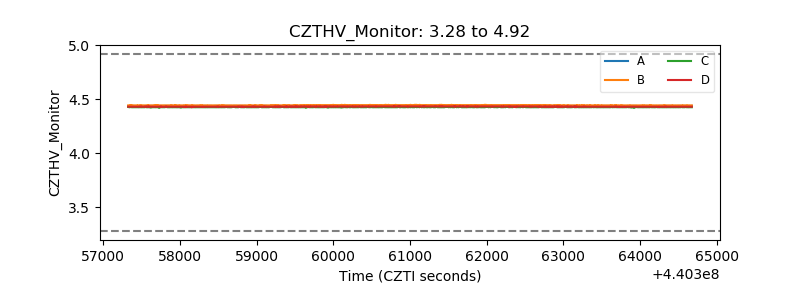 |
| D_VDD | 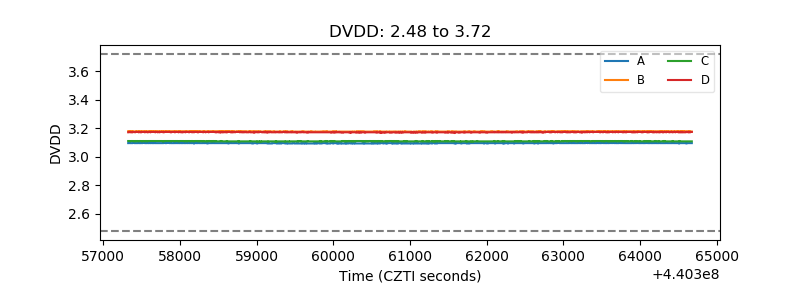 |
| Temperature 1 | 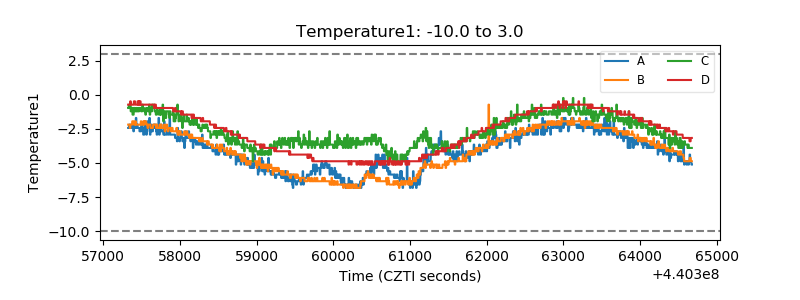 |
| Veto HV Monitor | 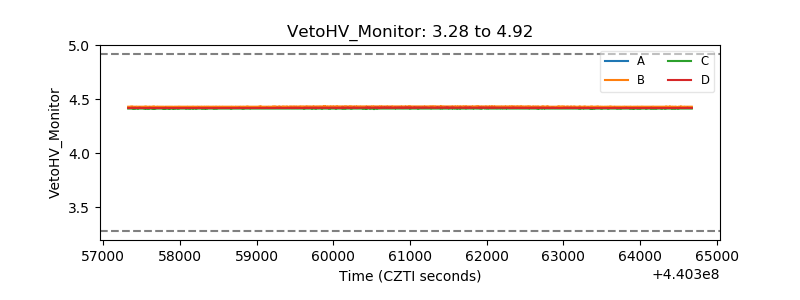 |
| Veto LLD | 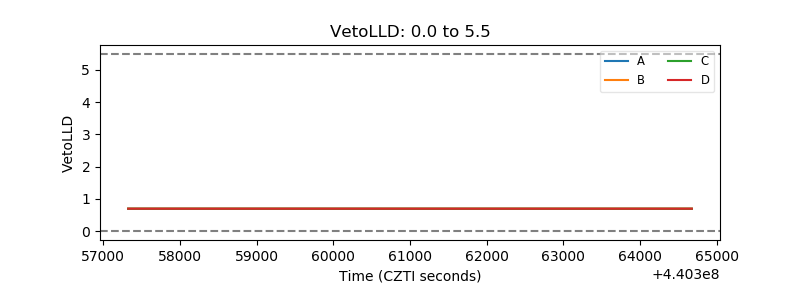 |
| Alpha Counter | 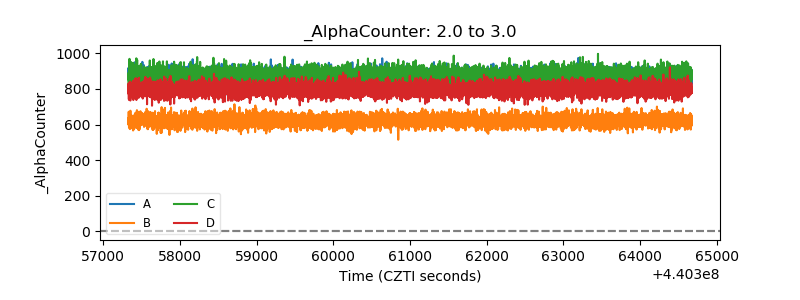 |
| _CPM_Rate | 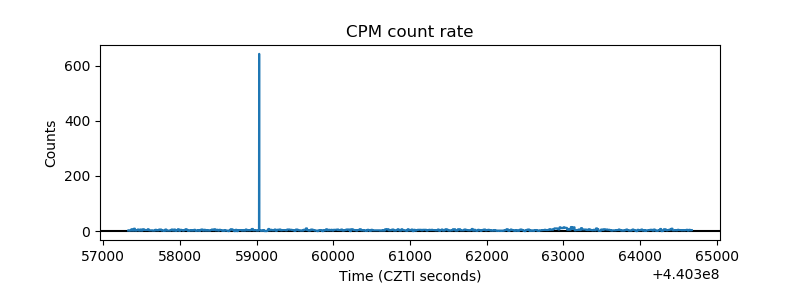 |
| CZT Counter | 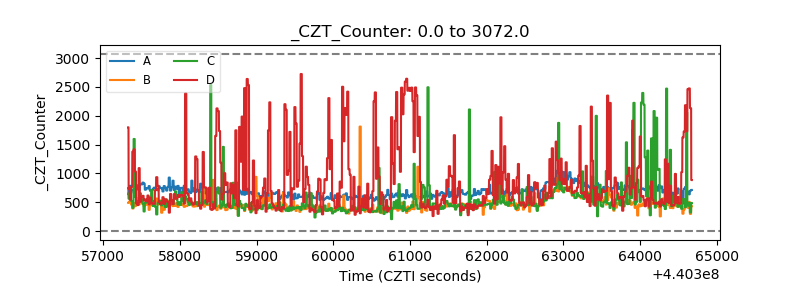 |
| +2.5 Volts monitor | 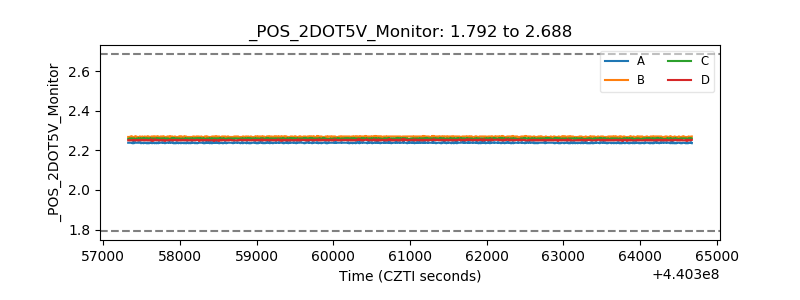 |
| +5 Volts monitor | 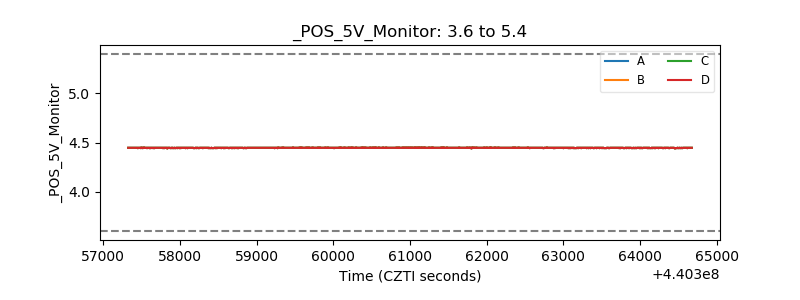 |
| _ROLL_ROT | 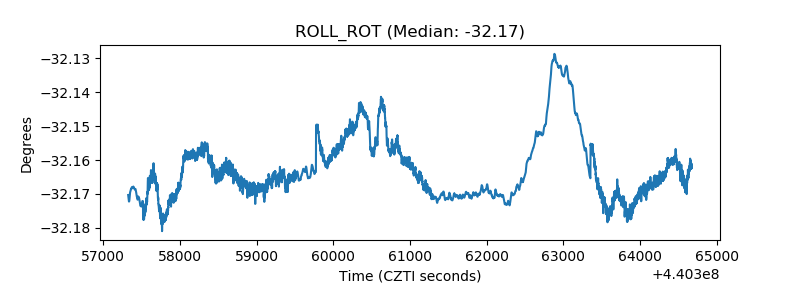 |
| _Roll_DEC | 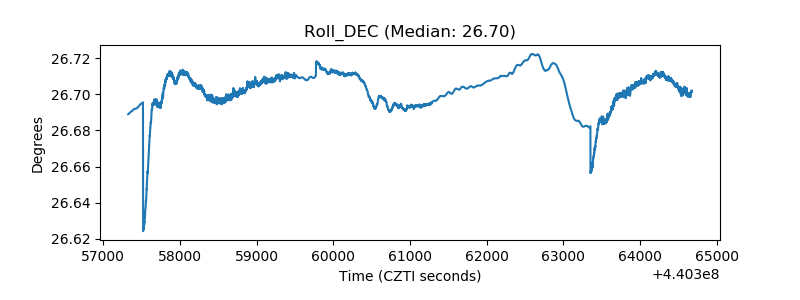 |
| _Roll_RA | 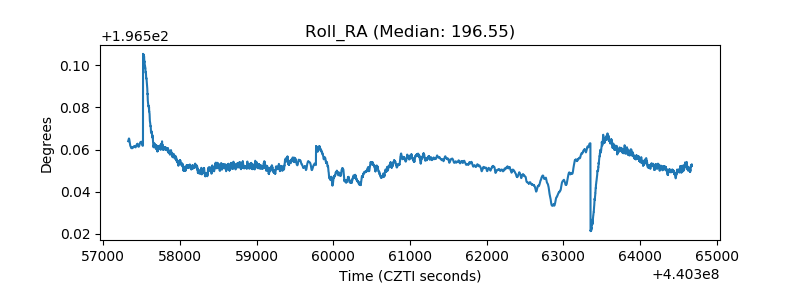 |
| Veto Counter | 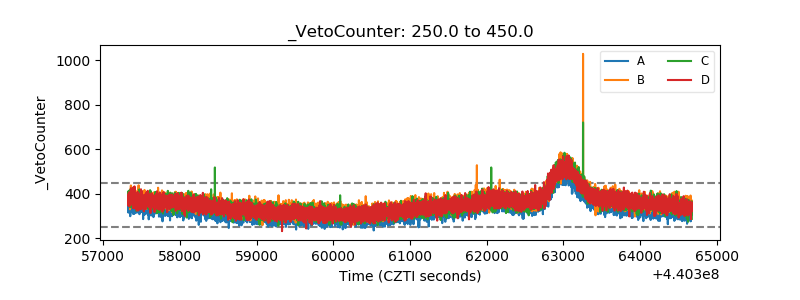 |