| Param | Original file | Final file |
|---|---|---|
| Filename | modeM0/AS1A13_072T03_9000006000_44422cztM0_level2.fits | modeM0/AS1A13_072T03_9000006000_44422cztM0_level2_quad_clean.evt |
| Size (bytes) | 457,151,040 | 93,130,560 |
| Size | 436.0 MB | 88.8 MB |
| Events in quadrant A | 4,096,476 | 631,724 |
| Events in quadrant B | 3,011,174 | 647,323 |
| Events in quadrant C | 3,765,452 | 604,098 |
| Events in quadrant D | 5,574,981 | 510,906 |
| Mode SS | |||
|---|---|---|---|
| Quadrant | BADHDUFLAG | Total packets | Discarded packets |
| A | 0 | 138 | 16 |
| B | 0 | 137 | 16 |
| C | 0 | 136 | 11 |
| D | 0 | 135 | 10 |
| Mode M9 | |||
|---|---|---|---|
| Quadrant | BADHDUFLAG | Total packets | Discarded packets |
| A | 0 | 1 | 0 |
| B | 0 | 1 | 0 |
| C | 0 | 1 | 0 |
| D | 0 | 1 | 0 |
| Mode M0 | |||
|---|---|---|---|
| Quadrant | BADHDUFLAG | Total packets | Discarded packets |
| A | 0 | 19135 | 2148 |
| B | 0 | 14748 | 1552 |
| C | 0 | 17353 | 1838 |
| D | 0 | 23070 | 2301 |
| Quadrant | Total seconds | Saturated seconds | Saturation percentage |
|---|---|---|---|
| A | 6081 | 198 | 3.256043% |
| B | 6112 | 194 | 3.174084% |
| C | 6104 | 383 | 6.274574% |
| D | 6090 | 875 | 14.367816% |
Noise dominated data is calculated using 1-second bins in cleaned event files. If a bin has >2000 counts, and if more than 50% of those come from <1% of pixels, then it is considered to be noise-dominated and hence unusable.
| Quadrant | # 1 sec bins | Bins with >0 counts | Bins with >2000 counts | High rate bins dominated by noise | Noise dominated (total time) | Noise dominated (detector-on time) | Marked lightcurve |
|---|---|---|---|---|---|---|---|
| A | 6428 | 6176 | 0 | 0 | 0.00% | 0.00% | 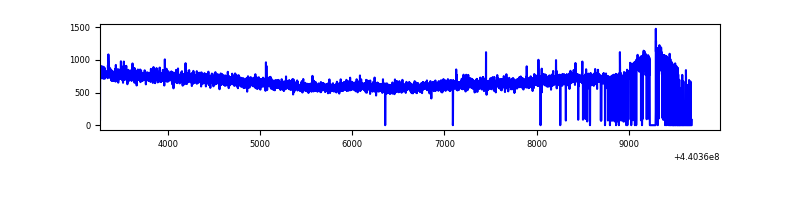 |
| B | 6675 | 6204 | 18 | 18 | 0.27% | 0.29% | 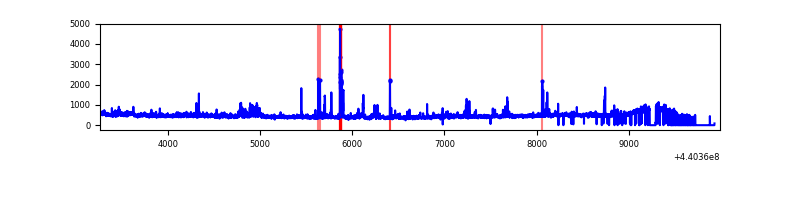 |
| C | 6733 | 6208 | 177 | 177 | 2.63% | 2.85% | 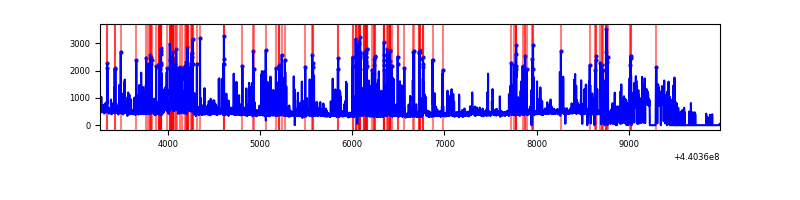 |
| D | 6487 | 6194 | 653 | 653 | 10.07% | 10.54% | 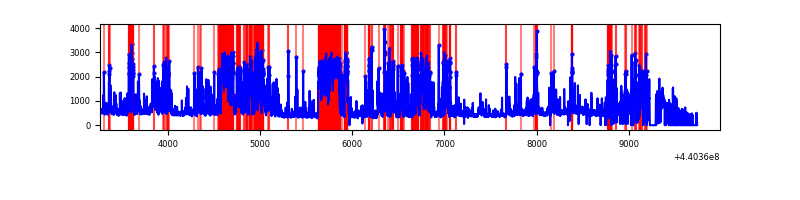 |
Top three noisy pixels from each quadrant. If the there are fewer than three noisy pixels in the level2.evt file, extra rows are filled as -1
| Pixel properties | Quadrant properties | ||||||
|---|---|---|---|---|---|---|---|
| Quadrant | DetID | PixID | Counts | Sigma | Mean | Median | Sigma |
| A | 10 | 83 | 1402798 | 9677.9 | 690 | 676 | 144.9 |
| A | 8 | 4 | 24106 | 161.72 | 690 | 676 | 144.9 |
| A | 3 | 137 | 8073 | 51.05 | 690 | 676 | 144.9 |
| B | 5 | 172 | 78398 | 565.59 | 688 | 666 | 137.4 |
| B | 0 | 229 | 62859 | 452.52 | 688 | 666 | 137.4 |
| B | 0 | 190 | 56772 | 408.23 | 688 | 666 | 137.4 |
| C | 12 | 16 | 713888 | 4534.24 | 668 | 673 | 157.3 |
| C | 15 | 158 | 185937 | 1177.81 | 668 | 673 | 157.3 |
| C | 3 | 233 | 171176 | 1083.97 | 668 | 673 | 157.3 |
| D | 4 | 221 | 1477905 | 8966.93 | 645 | 623 | 164.7 |
| D | 2 | 249 | 989783 | 6004.09 | 645 | 623 | 164.7 |
| D | 5 | 235 | 218127 | 1320.22 | 645 | 623 | 164.7 |
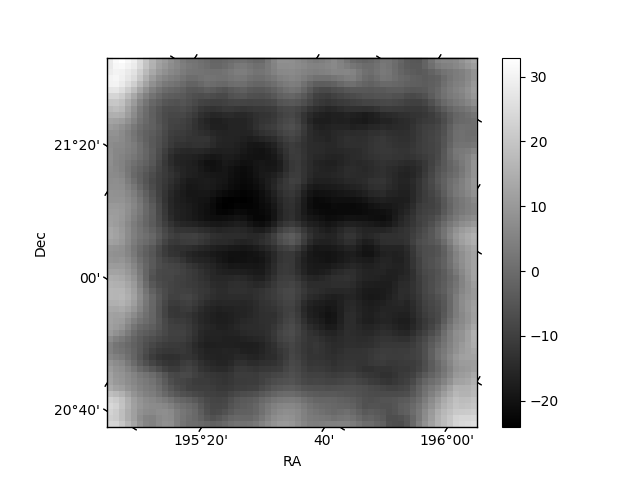
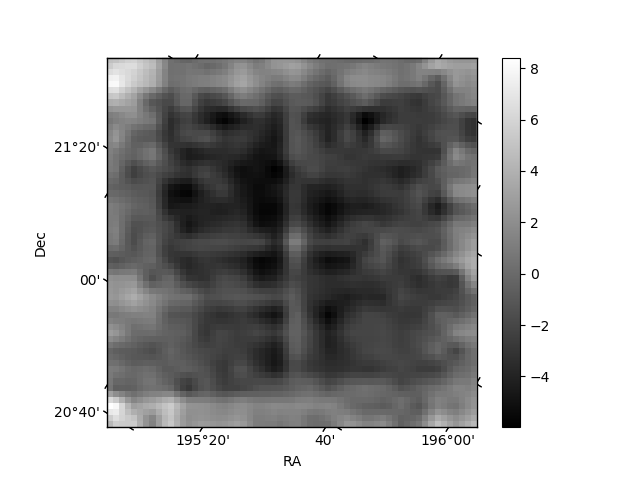
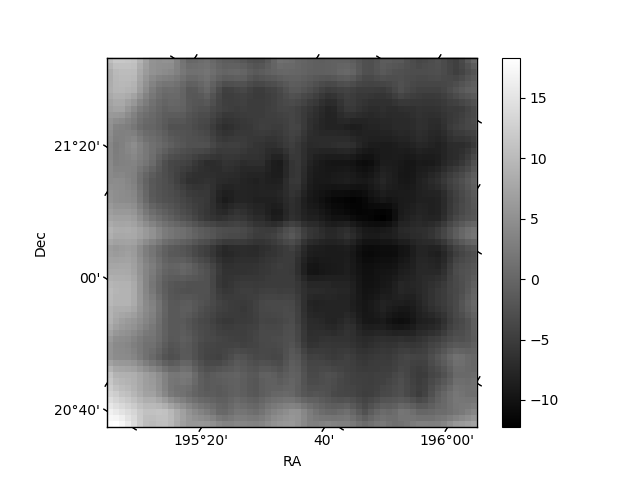
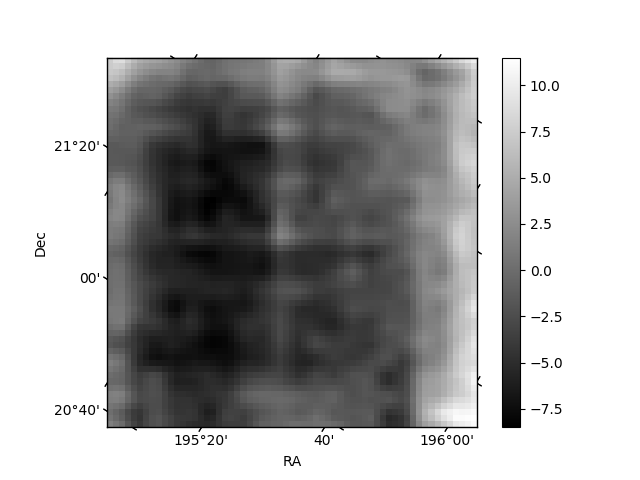
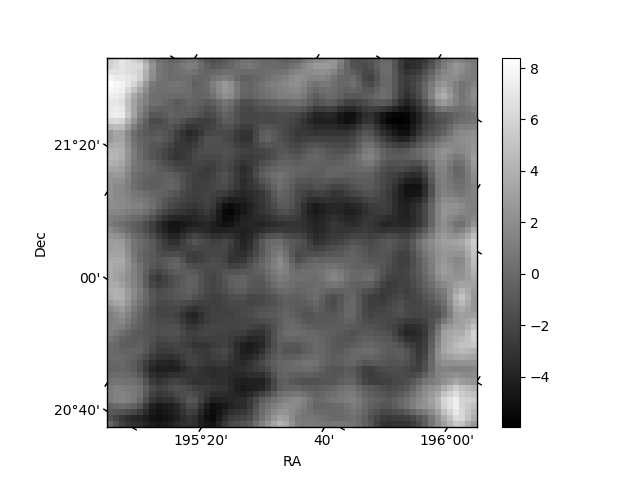
Histogram calculated using DETX and DETY for each event in the final _common_clean file
| Quadrant A | 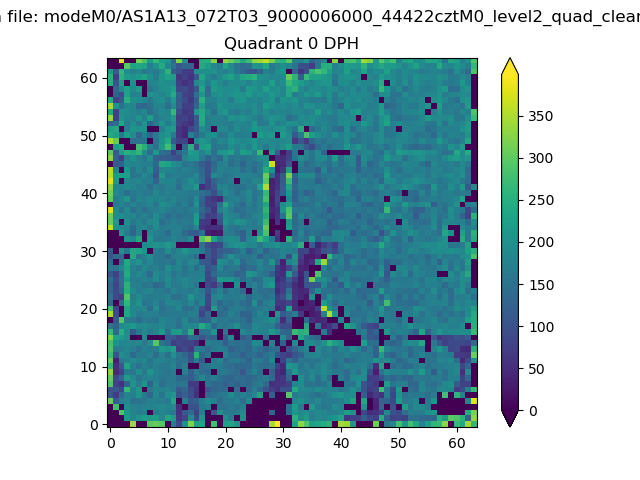 |
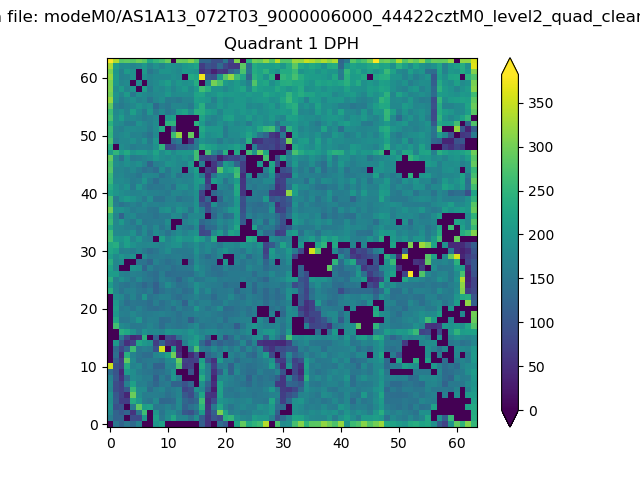 |
Quadrant B |
|---|---|---|---|
| Quadrant D | 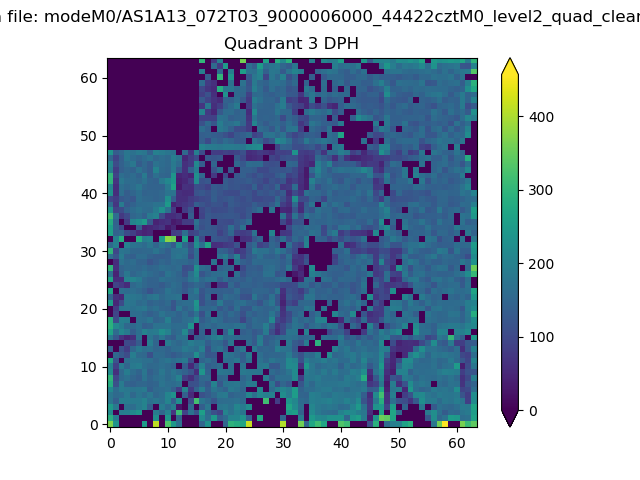 |
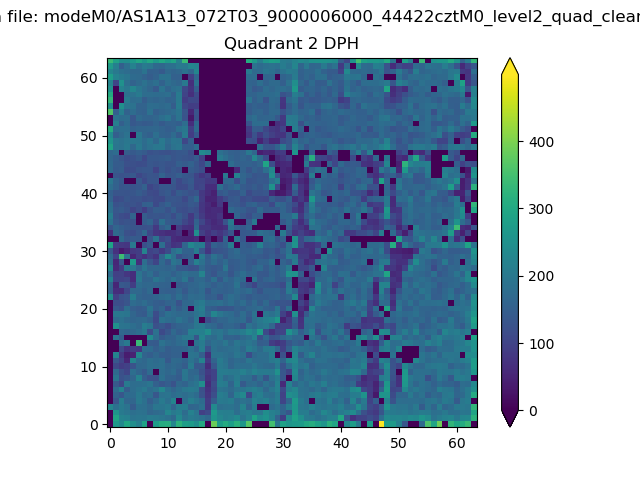 |
Quadrant C |
| Plot type | Count rate plots | Images |
|---|---|---|
| Comparison with Poisson distribution Blue bars denote a histogram of data divided into 1 sec bins. Red curve is a Poisson curve with rate = median count rate of data. |
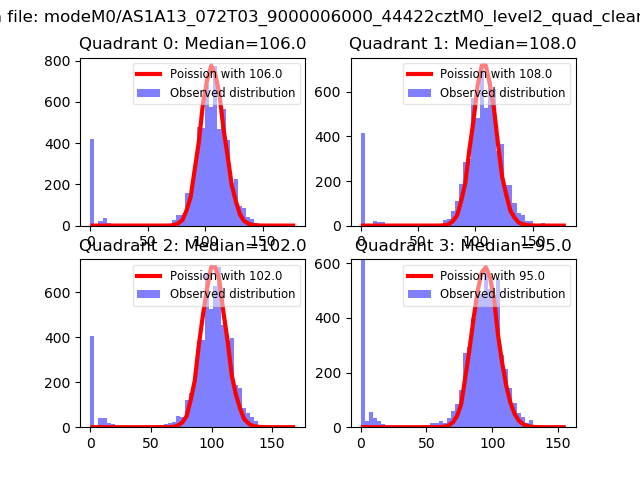 |
 |
| Quadrant-wise count rates Data is divided into 100 sec bins |
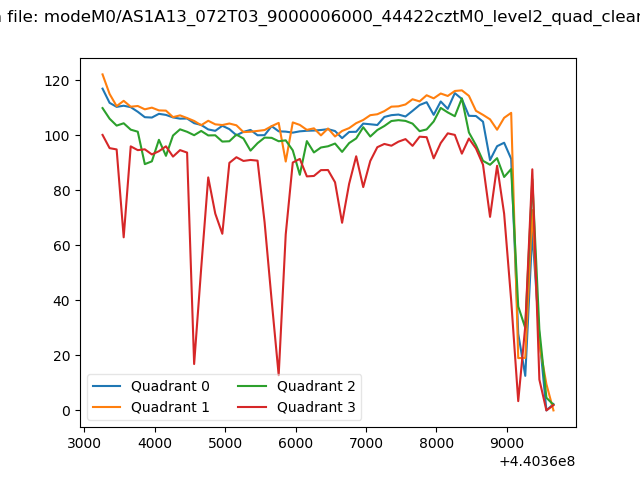 |
|
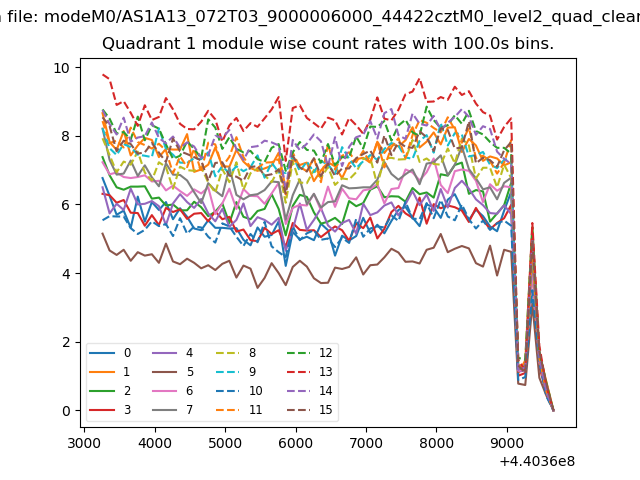
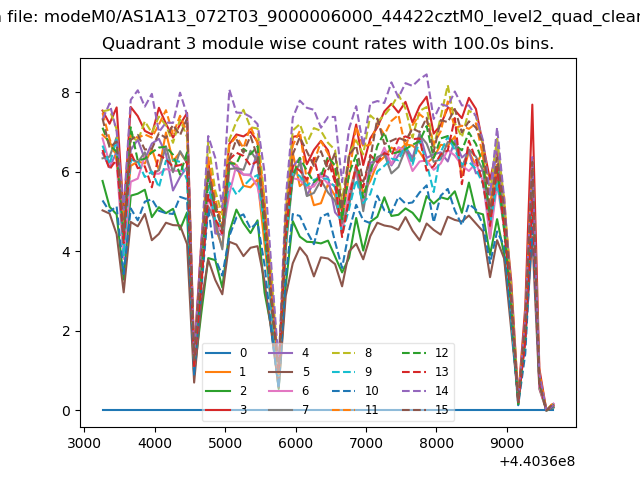
| Module-wise count rates for Quadrant A Data is divided into 100 sec bins |
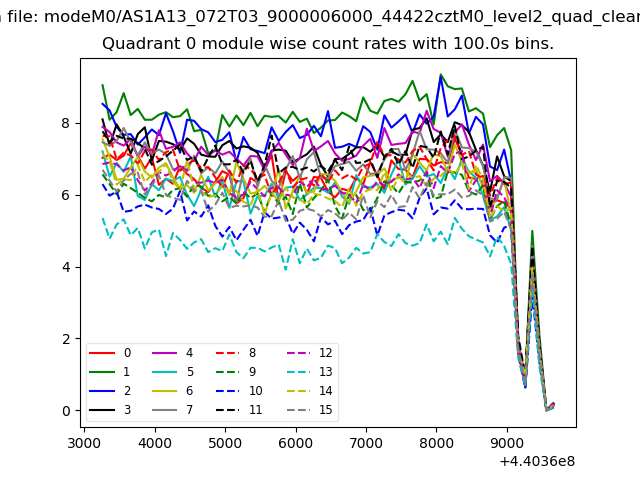 |
 |
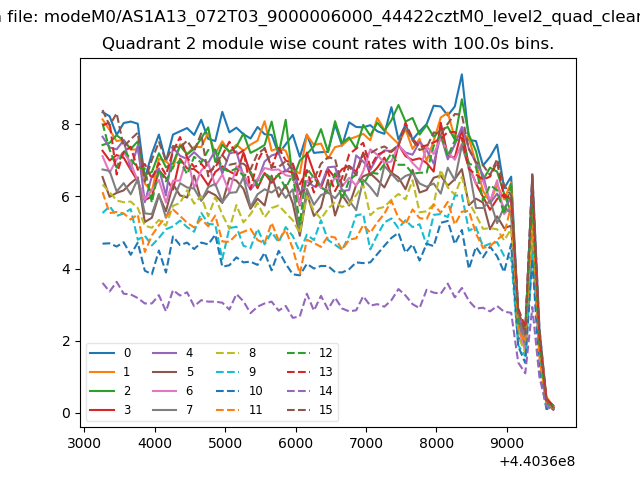
| Module-wise count rates for Quadrant B Data is divided into 100 sec bins |
 |
 |
| Module-wise count rates for Quadrant C Data is divided into 100 sec bins |
 |
 |
| Module-wise count rates for Quadrant D Data is divided into 100 sec bins |
 |
 |
| Parameter | Plot |
|---|---|
| CZT HV Monitor | 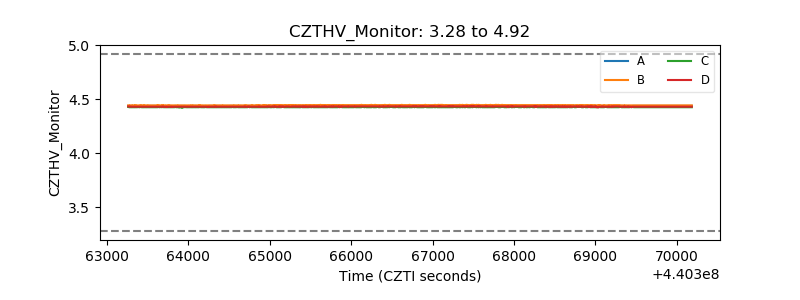 |
| D_VDD | 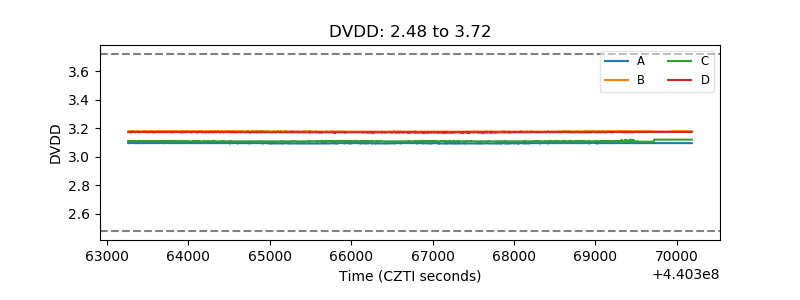 |
| Temperature 1 | 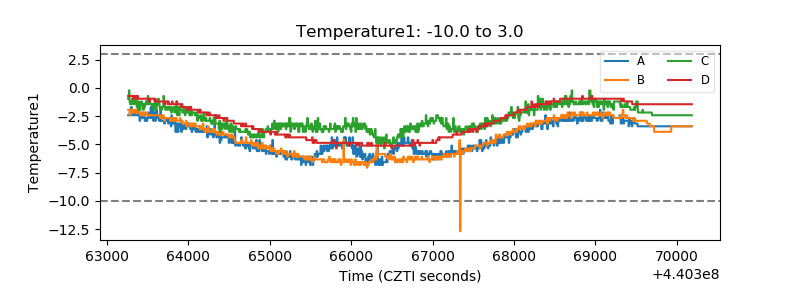 |
| Veto HV Monitor | 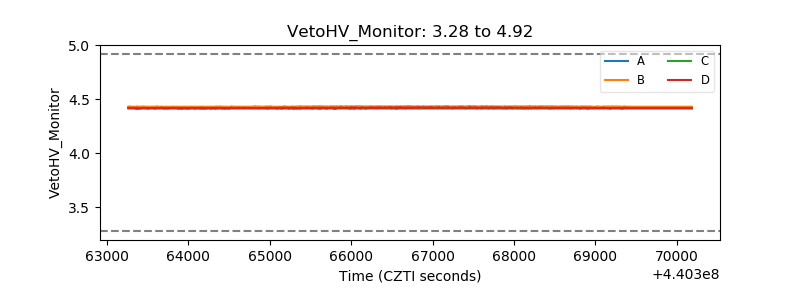 |
| Veto LLD | 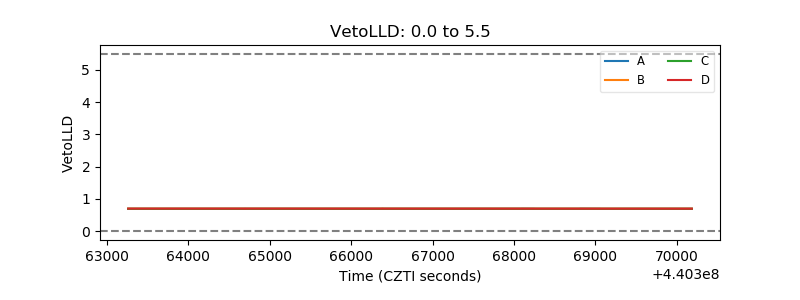 |
| Alpha Counter | 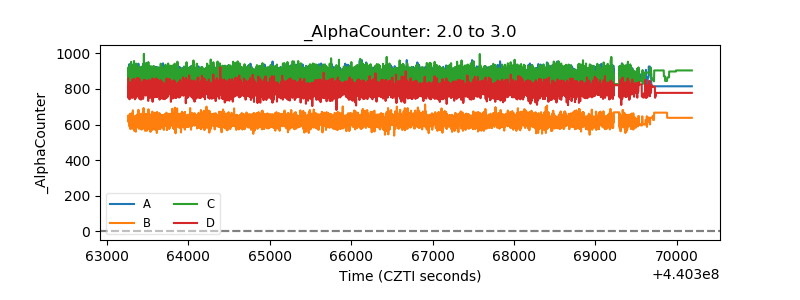 |
| _CPM_Rate | 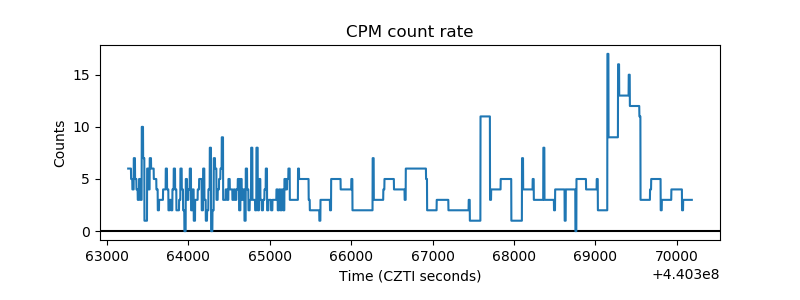 |
| CZT Counter | 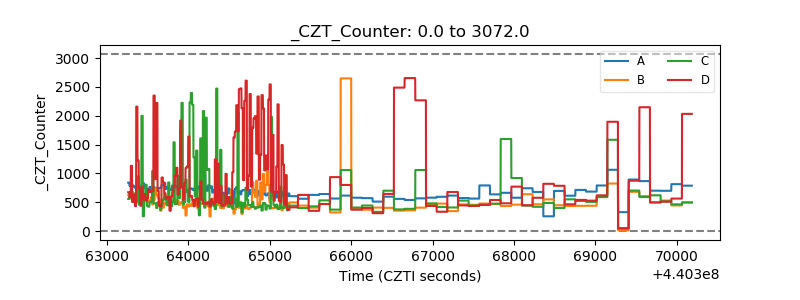 |
| +2.5 Volts monitor | 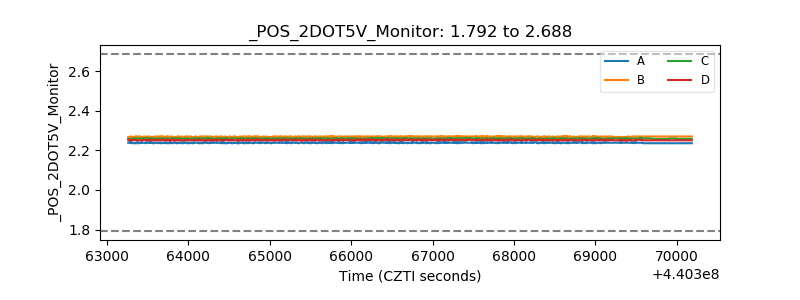 |
| +5 Volts monitor | 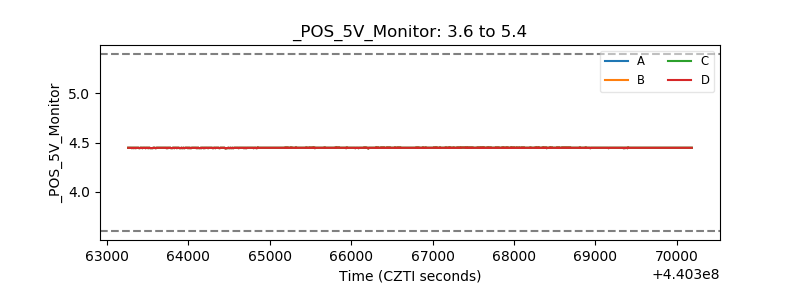 |
| _ROLL_ROT | 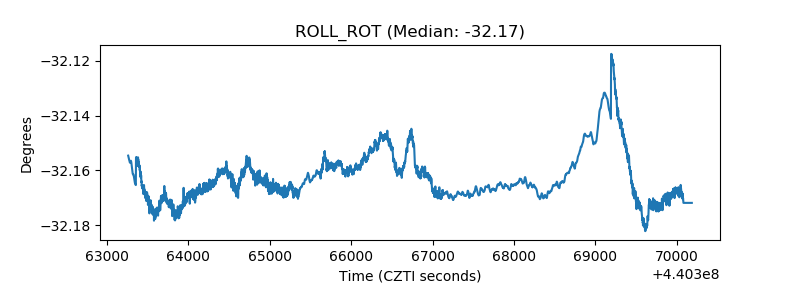 |
| _Roll_DEC | 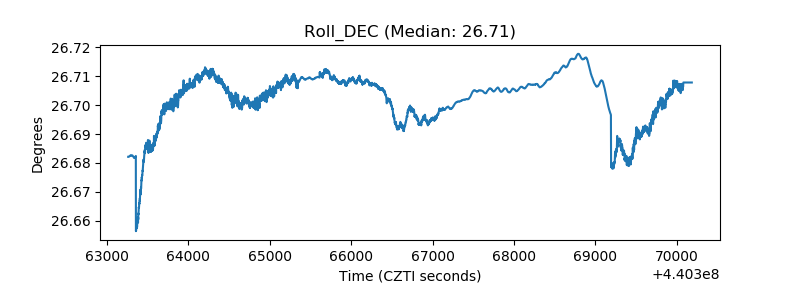 |
| _Roll_RA | 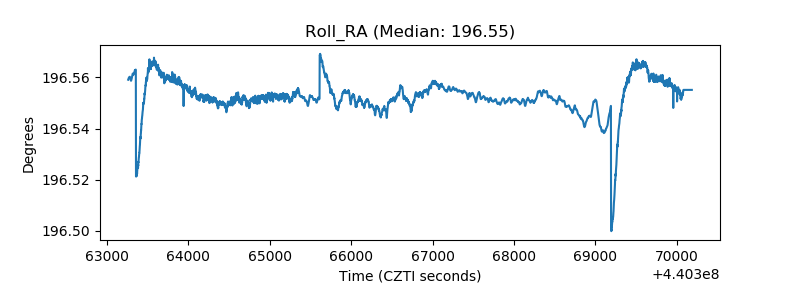 |
| Veto Counter | 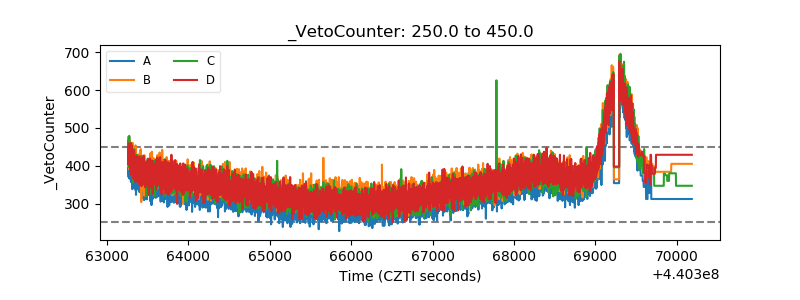 |