| Param | Original file | Final file |
|---|---|---|
| Filename | modeM0/AS1A13_072T03_9000006000_44426cztM0_level2.fits | modeM0/AS1A13_072T03_9000006000_44426cztM0_level2_quad_clean.evt |
| Size (bytes) | 421,908,480 | 108,380,160 |
| Size | 402.4 MB | 103.4 MB |
| Events in quadrant A | 4,641,007 | 724,429 |
| Events in quadrant B | 3,413,174 | 742,580 |
| Events in quadrant C | 3,575,616 | 699,025 |
| Events in quadrant D | 3,462,717 | 645,049 |
| Mode SS | |||
|---|---|---|---|
| Quadrant | BADHDUFLAG | Total packets | Discarded packets |
| A | 0 | 136 | 0 |
| B | 0 | 136 | 0 |
| C | 0 | 136 | 0 |
| D | 0 | 136 | 0 |
| Mode M9 | |||
|---|---|---|---|
| Quadrant | BADHDUFLAG | Total packets | Discarded packets |
| A | 0 | 10 | 0 |
| B | 0 | 10 | 0 |
| C | 0 | 10 | 0 |
| D | 0 | 10 | 0 |
| Mode M0 | |||
|---|---|---|---|
| Quadrant | BADHDUFLAG | Total packets | Discarded packets |
| A | 0 | 19035 | 1 |
| B | 0 | 14904 | 1 |
| C | 0 | 15572 | 1 |
| D | 0 | 15415 | 1 |
| Quadrant | Total seconds | Saturated seconds | Saturation percentage |
|---|---|---|---|
| A | 6754 | 57 | 0.843944% |
| B | 6754 | 125 | 1.850755% |
| C | 6754 | 210 | 3.109269% |
| D | 6754 | 89 | 1.317738% |
Noise dominated data is calculated using 1-second bins in cleaned event files. If a bin has >2000 counts, and if more than 50% of those come from <1% of pixels, then it is considered to be noise-dominated and hence unusable.
| Quadrant | # 1 sec bins | Bins with >0 counts | Bins with >2000 counts | High rate bins dominated by noise | Noise dominated (total time) | Noise dominated (detector-on time) | Marked lightcurve |
|---|---|---|---|---|---|---|---|
| A | 7734 | 6755 | 3 | 3 | 0.04% | 0.04% | 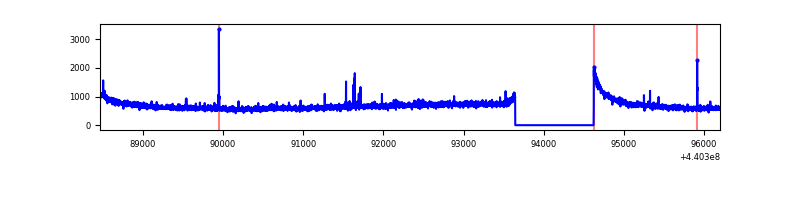 |
| B | 7734 | 6755 | 74 | 74 | 0.96% | 1.10% | 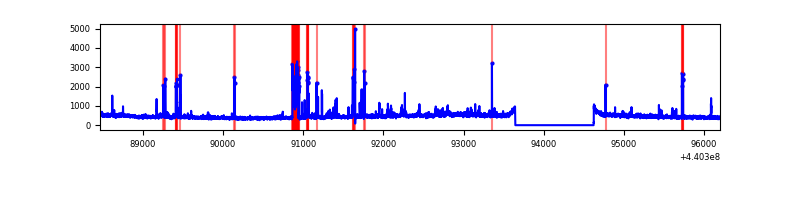 |
| C | 7734 | 6755 | 39 | 39 | 0.50% | 0.58% | 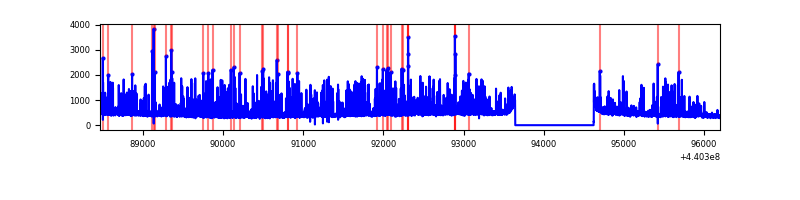 |
| D | 7734 | 6755 | 70 | 70 | 0.91% | 1.04% | 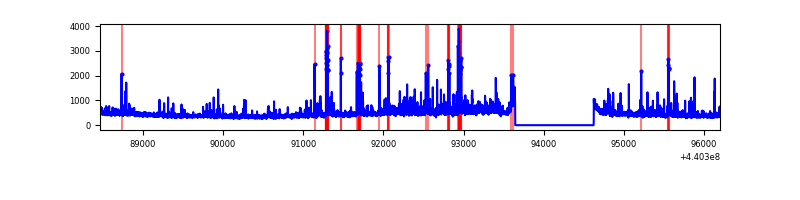 |
Top three noisy pixels from each quadrant. If the there are fewer than three noisy pixels in the level2.evt file, extra rows are filled as -1
| Pixel properties | Quadrant properties | ||||||
|---|---|---|---|---|---|---|---|
| Quadrant | DetID | PixID | Counts | Sigma | Mean | Median | Sigma |
| A | 10 | 83 | 1727633 | 11206.1 | 737 | 722 | 154.1 |
| A | 8 | 4 | 24482 | 154.18 | 737 | 722 | 154.1 |
| A | 15 | 235 | 18231 | 113.61 | 737 | 722 | 154.1 |
| B | 5 | 172 | 265371 | 1823.53 | 734 | 711 | 145.1 |
| B | 4 | 170 | 84645 | 578.31 | 734 | 711 | 145.1 |
| B | 0 | 229 | 72845 | 497.01 | 734 | 711 | 145.1 |
| C | 12 | 16 | 562993 | 3356.67 | 710 | 714 | 167.5 |
| C | 14 | 254 | 113976 | 676.15 | 710 | 714 | 167.5 |
| C | 3 | 233 | 65203 | 384.98 | 710 | 714 | 167.5 |
| D | 1 | 52 | 195828 | 1094.19 | 710 | 689 | 178.3 |
| D | 13 | 249 | 170629 | 952.89 | 710 | 689 | 178.3 |
| D | 4 | 221 | 78018 | 433.6 | 710 | 689 | 178.3 |
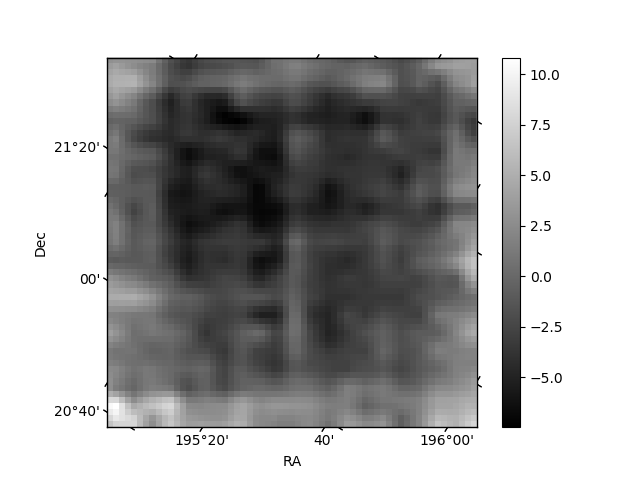
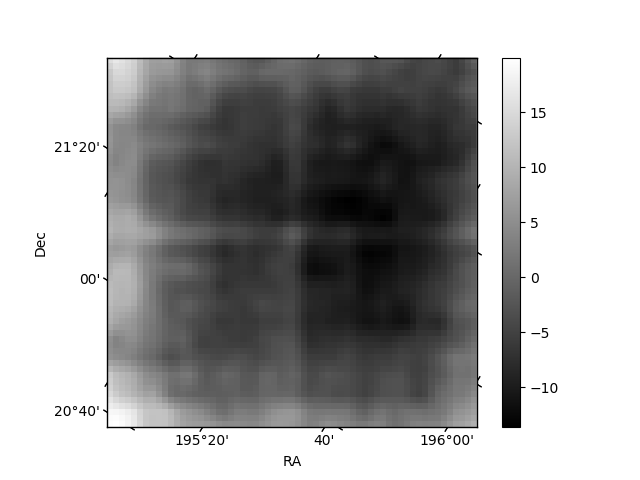
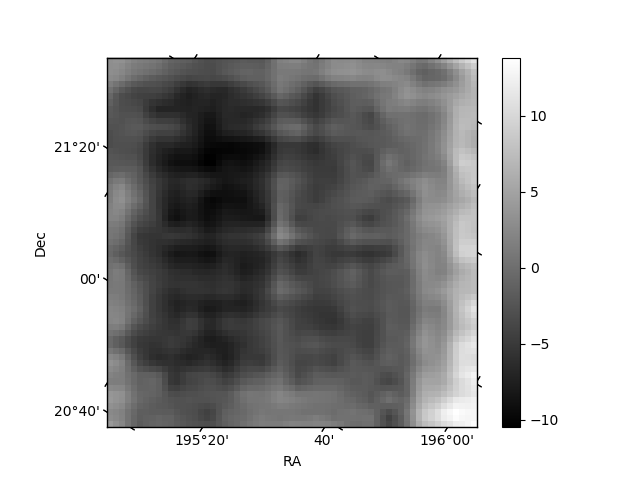
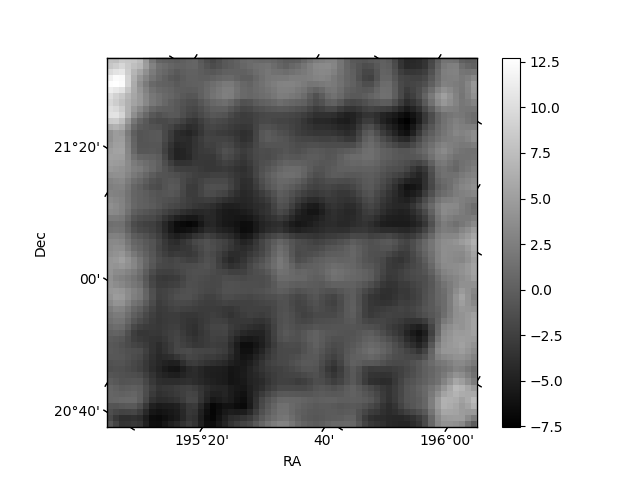
Histogram calculated using DETX and DETY for each event in the final _common_clean file
| Quadrant A | 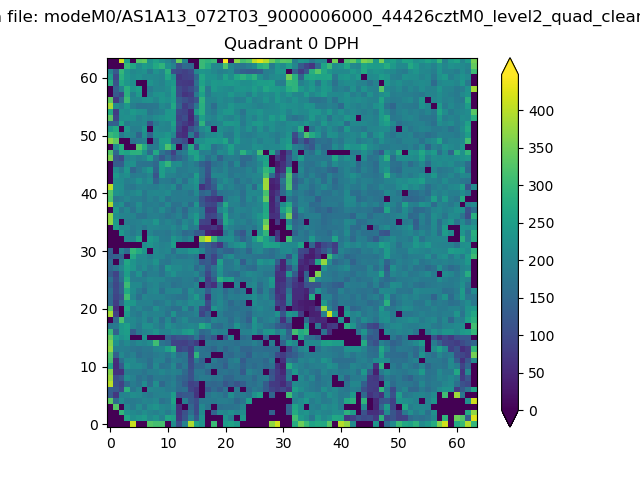 |
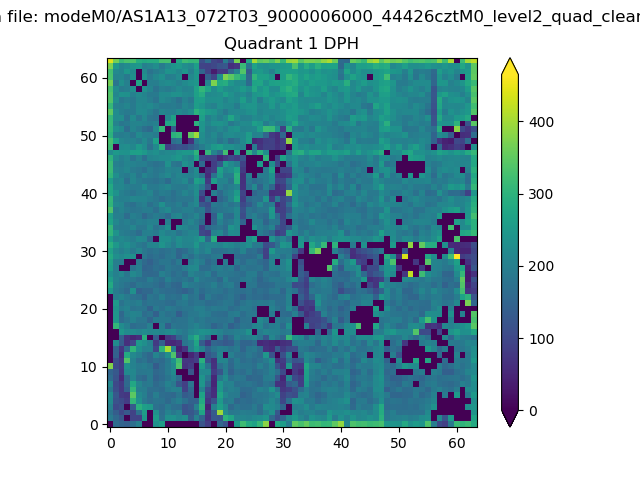 |
Quadrant B |
|---|---|---|---|
| Quadrant D | 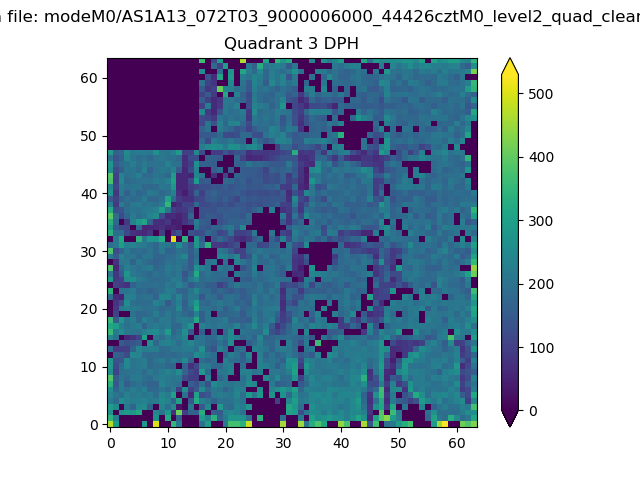 |
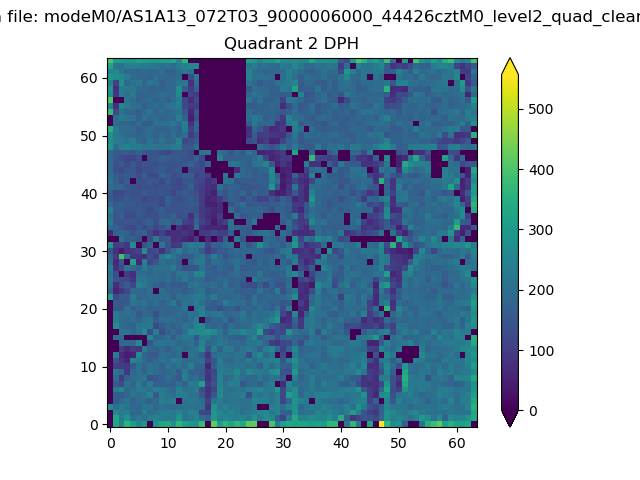 |
Quadrant C |
| Plot type | Count rate plots | Images |
|---|---|---|
| Comparison with Poisson distribution Blue bars denote a histogram of data divided into 1 sec bins. Red curve is a Poisson curve with rate = median count rate of data. |
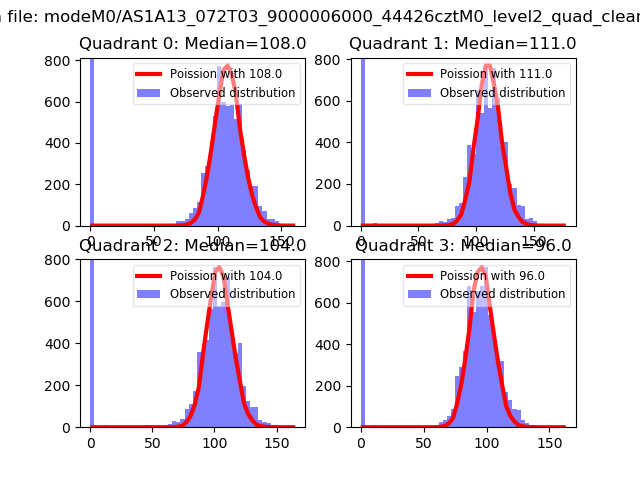 |
 |
| Quadrant-wise count rates Data is divided into 100 sec bins |
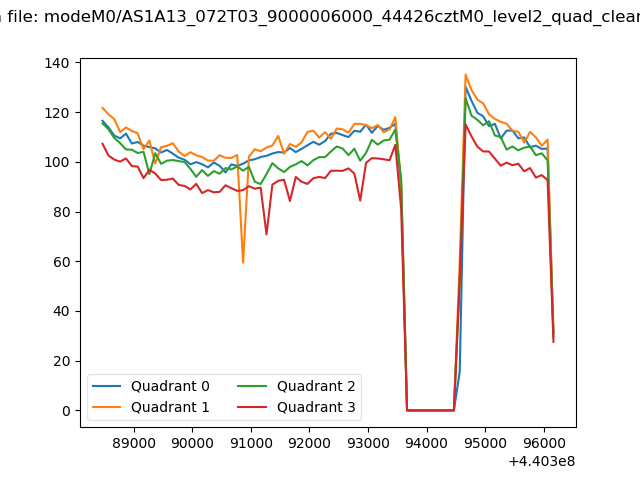 |
|
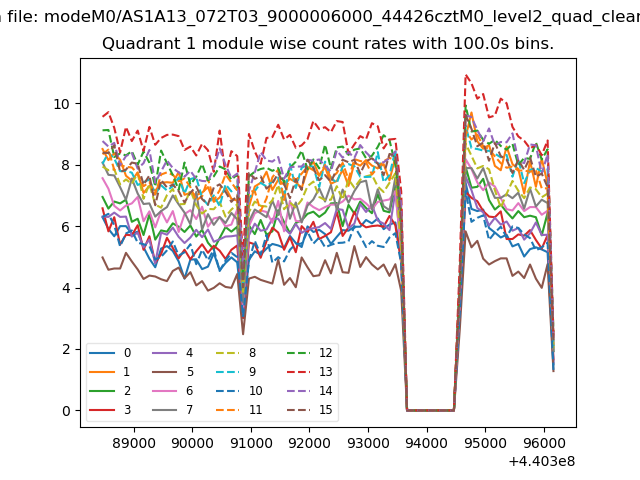
| Module-wise count rates for Quadrant A Data is divided into 100 sec bins |
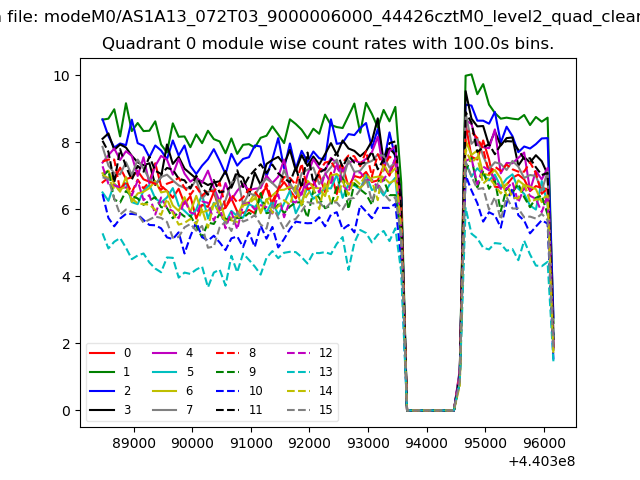 |
 |
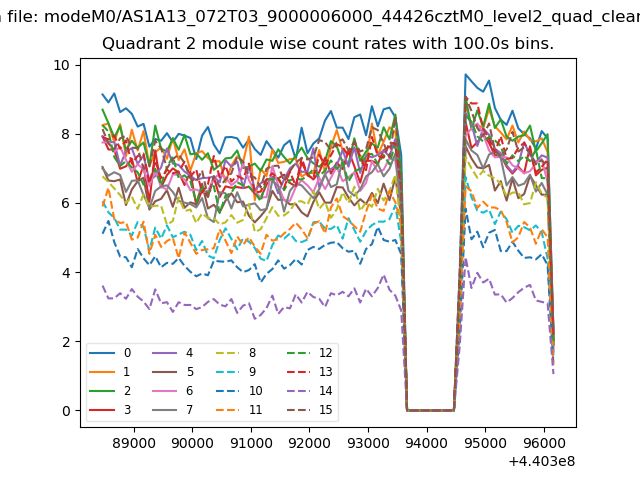
| Module-wise count rates for Quadrant B Data is divided into 100 sec bins |
 |
 |
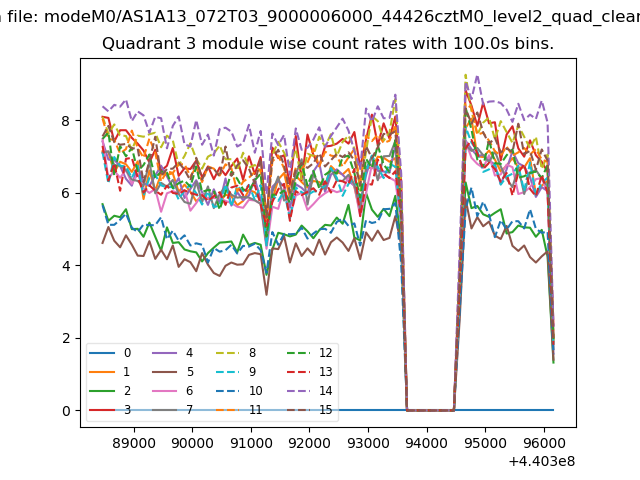
| Module-wise count rates for Quadrant C Data is divided into 100 sec bins |
 |
 |
| Module-wise count rates for Quadrant D Data is divided into 100 sec bins |
 |
 |
| Parameter | Plot |
|---|---|
| CZT HV Monitor | 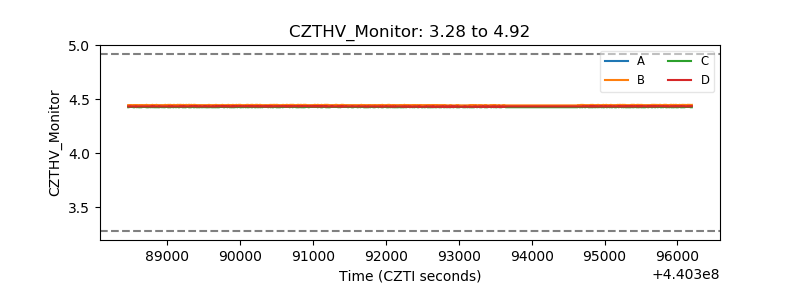 |
| D_VDD | 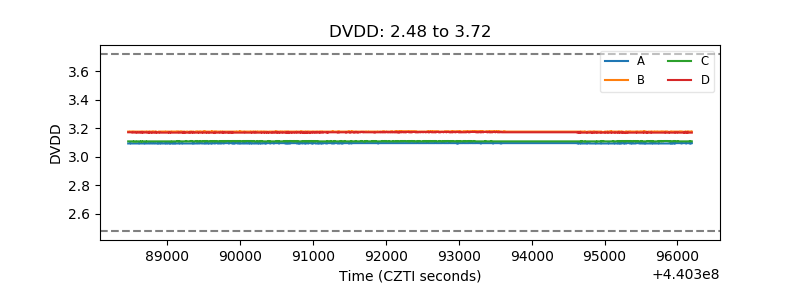 |
| Temperature 1 | 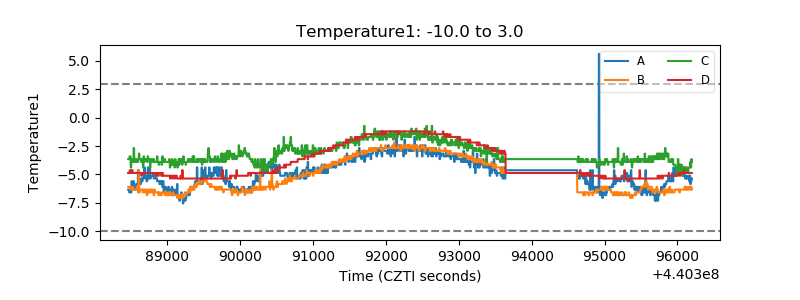 |
| Veto HV Monitor |  |
| Veto LLD | 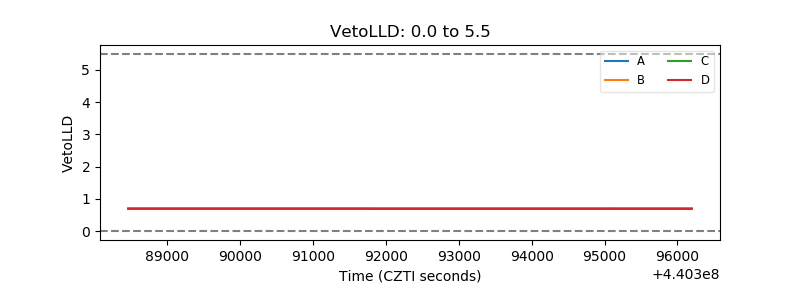 |
| Alpha Counter | 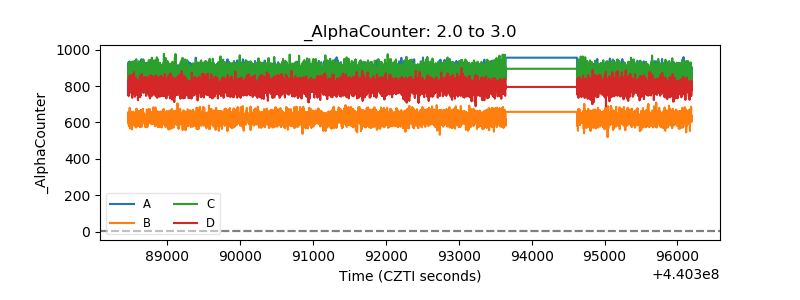 |
| _CPM_Rate | 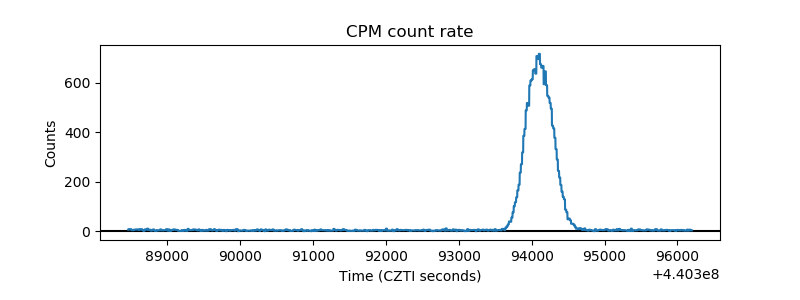 |
| CZT Counter | 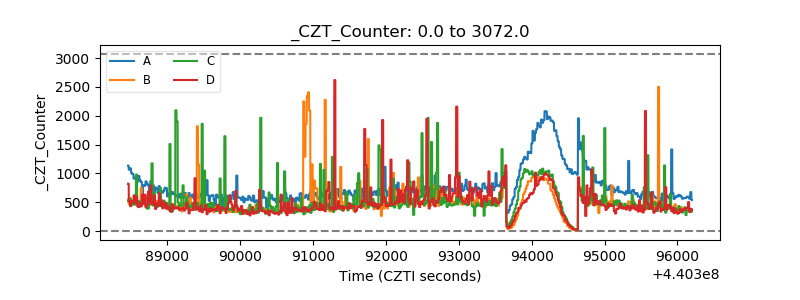 |
| +2.5 Volts monitor | 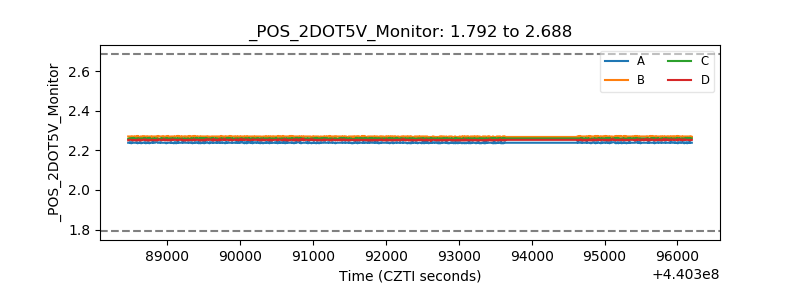 |
| +5 Volts monitor | 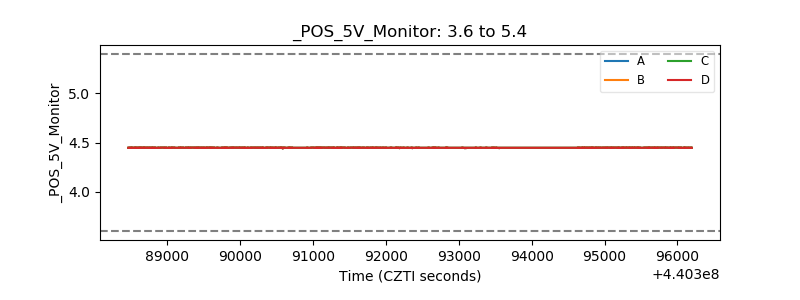 |
| _ROLL_ROT | 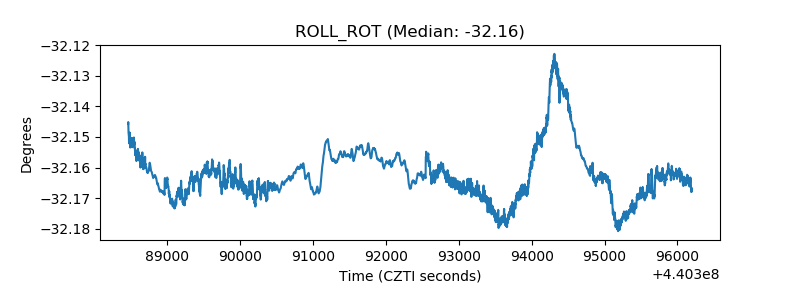 |
| _Roll_DEC | 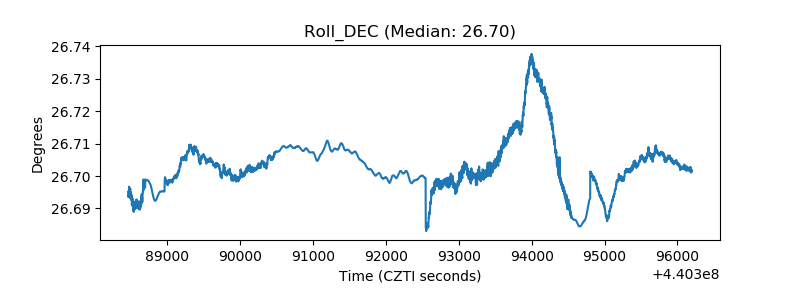 |
| _Roll_RA |  |
| Veto Counter | 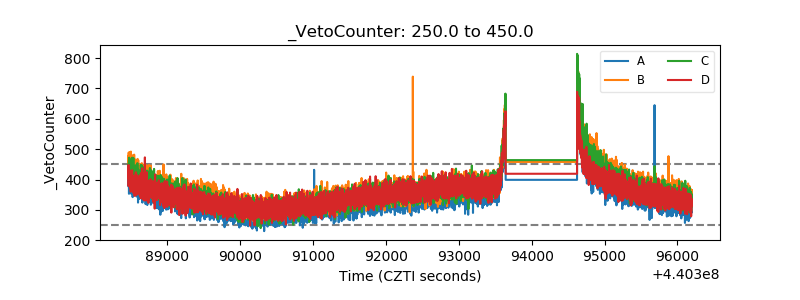 |