| Param | Original file | Final file |
|---|---|---|
| Filename | modeM0/AS1A13_072T03_9000006000_44428cztM0_level2.fits | modeM0/AS1A13_072T03_9000006000_44428cztM0_level2_quad_clean.evt |
| Size (bytes) | 410,100,480 | 109,008,000 |
| Size | 391.1 MB | 104.0 MB |
| Events in quadrant A | 4,523,364 | 732,053 |
| Events in quadrant B | 3,128,672 | 754,505 |
| Events in quadrant C | 2,964,074 | 712,549 |
| Events in quadrant D | 4,053,244 | 642,951 |
| Mode SS | |||
|---|---|---|---|
| Quadrant | BADHDUFLAG | Total packets | Discarded packets |
| A | 0 | 134 | 0 |
| B | 0 | 134 | 0 |
| C | 0 | 134 | 0 |
| D | 0 | 134 | 0 |
| Mode M9 | |||
|---|---|---|---|
| Quadrant | BADHDUFLAG | Total packets | Discarded packets |
| A | 0 | 11 | 0 |
| B | 0 | 11 | 0 |
| C | 0 | 11 | 0 |
| D | 0 | 11 | 0 |
| Mode M0 | |||
|---|---|---|---|
| Quadrant | BADHDUFLAG | Total packets | Discarded packets |
| A | 0 | 18683 | 1 |
| B | 0 | 13875 | 1 |
| C | 0 | 13630 | 2 |
| D | 0 | 16839 | 1 |
| Quadrant | Total seconds | Saturated seconds | Saturation percentage |
|---|---|---|---|
| A | 6575 | 48 | 0.730038% |
| B | 6575 | 46 | 0.699620% |
| C | 6575 | 21 | 0.319392% |
| D | 6575 | 183 | 2.783270% |
Noise dominated data is calculated using 1-second bins in cleaned event files. If a bin has >2000 counts, and if more than 50% of those come from <1% of pixels, then it is considered to be noise-dominated and hence unusable.
| Quadrant | # 1 sec bins | Bins with >0 counts | Bins with >2000 counts | High rate bins dominated by noise | Noise dominated (total time) | Noise dominated (detector-on time) | Marked lightcurve |
|---|---|---|---|---|---|---|---|
| A | 7700 | 6576 | 8 | 8 | 0.10% | 0.12% | 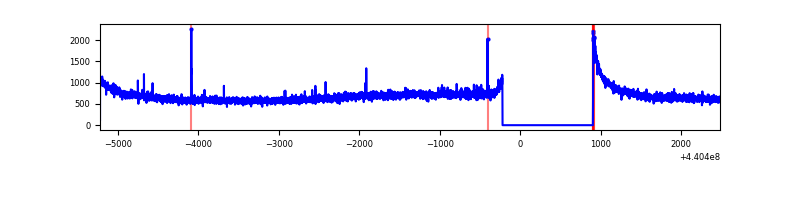 |
| B | 7700 | 6576 | 13 | 13 | 0.17% | 0.20% | 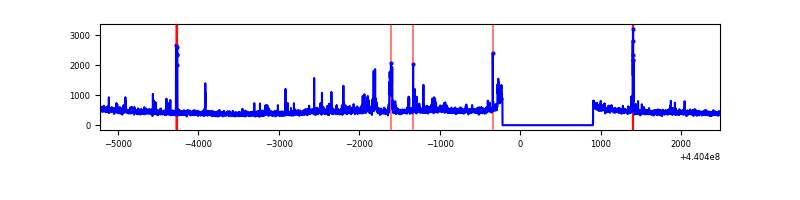 |
| C | 7700 | 6576 | 5 | 5 | 0.06% | 0.08% | 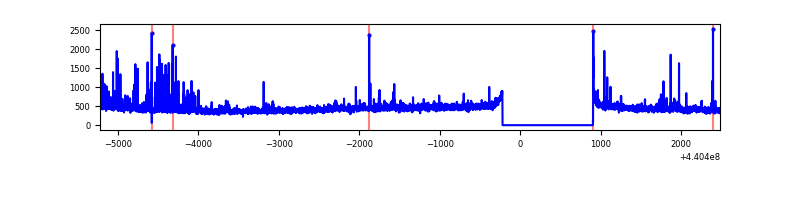 |
| D | 7700 | 6576 | 163 | 163 | 2.12% | 2.48% | 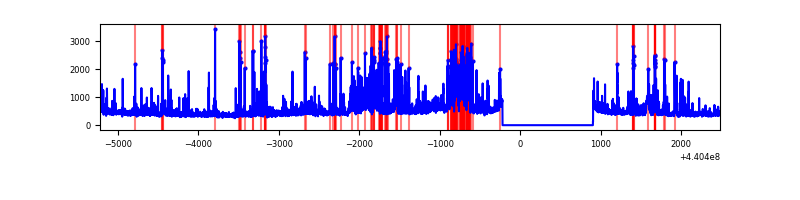 |
Top three noisy pixels from each quadrant. If the there are fewer than three noisy pixels in the level2.evt file, extra rows are filled as -1
| Pixel properties | Quadrant properties | ||||||
|---|---|---|---|---|---|---|---|
| Quadrant | DetID | PixID | Counts | Sigma | Mean | Median | Sigma |
| A | 10 | 83 | 1667948 | 11086.04 | 725 | 710 | 150.4 |
| A | 8 | 4 | 31123 | 202.23 | 725 | 710 | 150.4 |
| A | 10 | 248 | 15815 | 100.44 | 725 | 710 | 150.4 |
| B | 0 | 229 | 64873 | 450.22 | 725 | 705 | 142.5 |
| B | 4 | 170 | 54222 | 375.49 | 725 | 705 | 142.5 |
| B | 0 | 168 | 49856 | 344.86 | 725 | 705 | 142.5 |
| C | 12 | 16 | 76269 | 455.57 | 706 | 710 | 165.9 |
| C | 3 | 233 | 48997 | 291.14 | 706 | 710 | 165.9 |
| C | 14 | 254 | 44153 | 261.93 | 706 | 710 | 165.9 |
| D | 1 | 52 | 469470 | 2678.66 | 697 | 677 | 175.0 |
| D | 2 | 249 | 304692 | 1737.12 | 697 | 677 | 175.0 |
| D | 13 | 249 | 140111 | 796.72 | 697 | 677 | 175.0 |
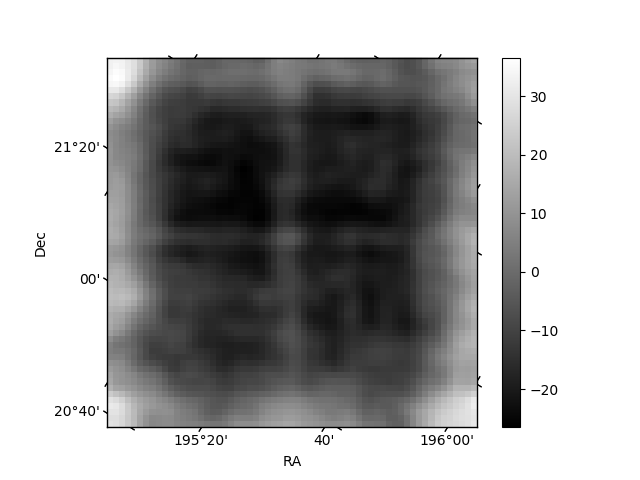
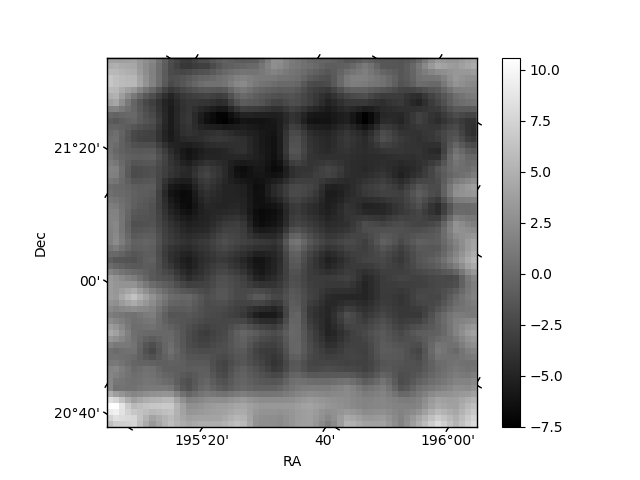
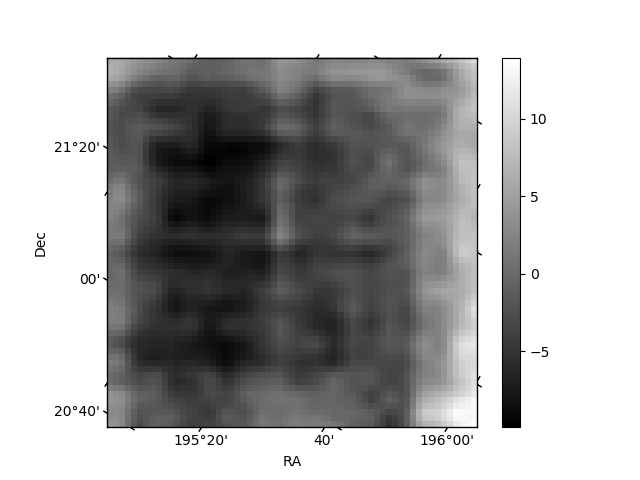
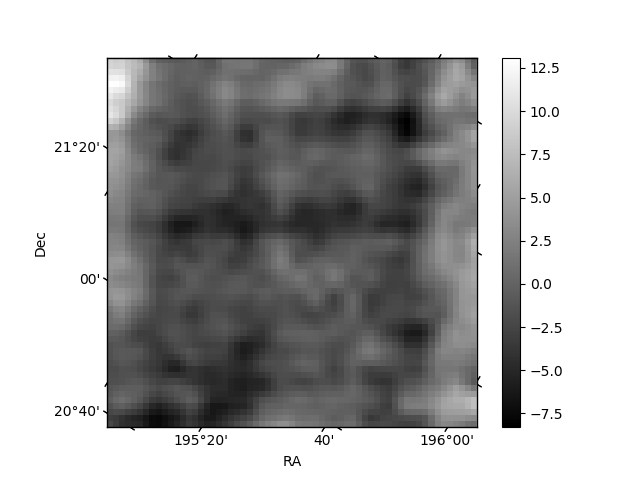
Histogram calculated using DETX and DETY for each event in the final _common_clean file
| Quadrant A | 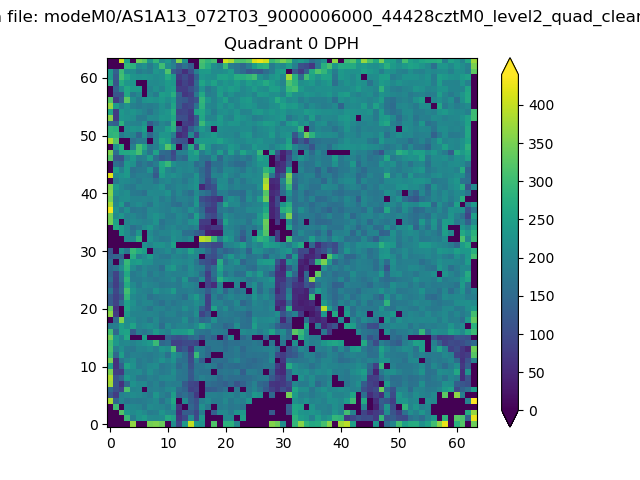 |
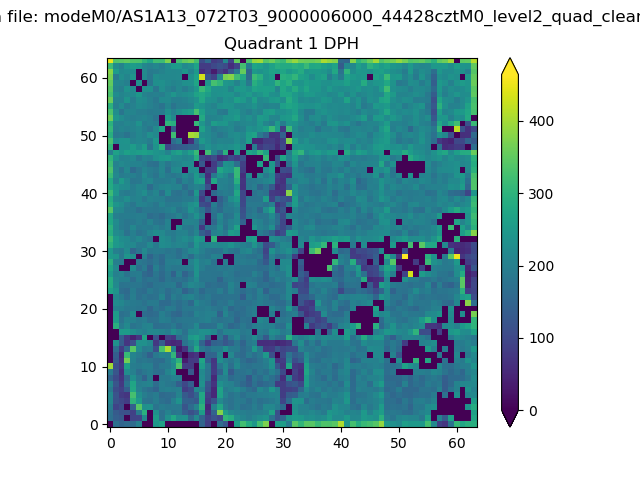 |
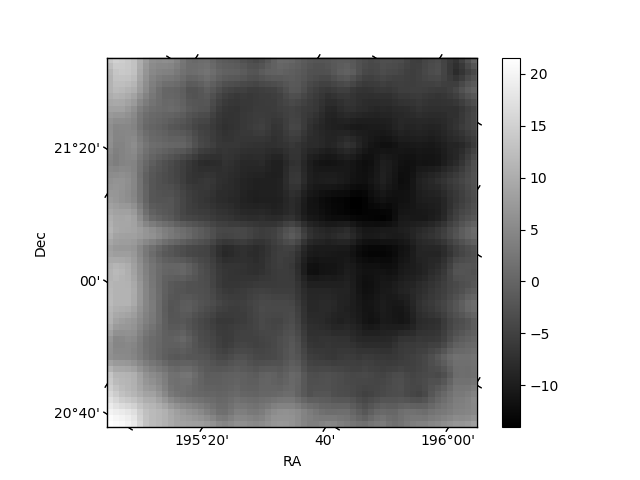
Quadrant B |
|---|---|---|---|
| Quadrant D | 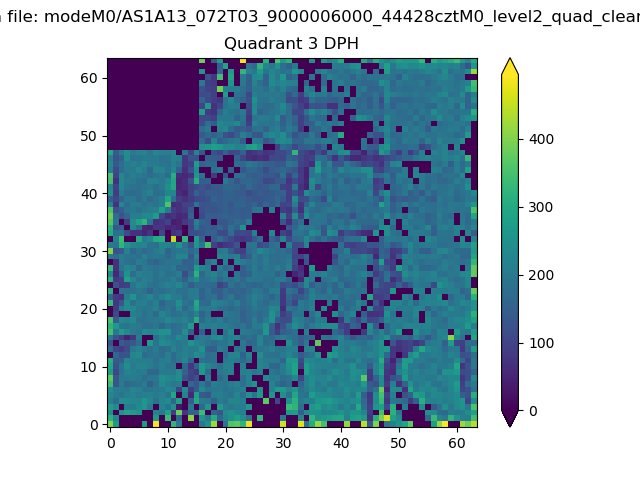 |
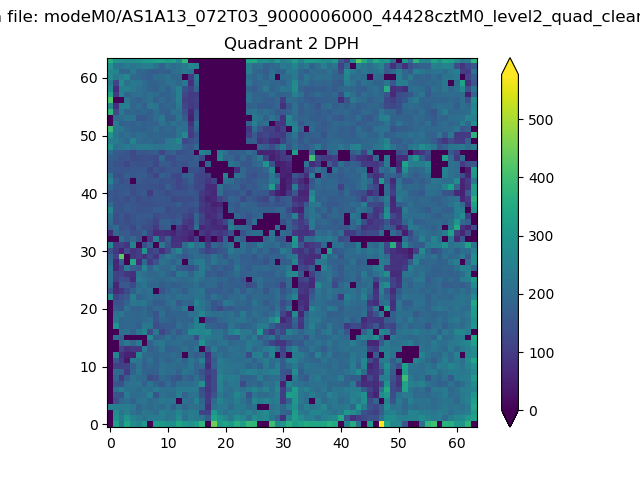 |
Quadrant C |
| Plot type | Count rate plots | Images |
|---|---|---|
| Comparison with Poisson distribution Blue bars denote a histogram of data divided into 1 sec bins. Red curve is a Poisson curve with rate = median count rate of data. |
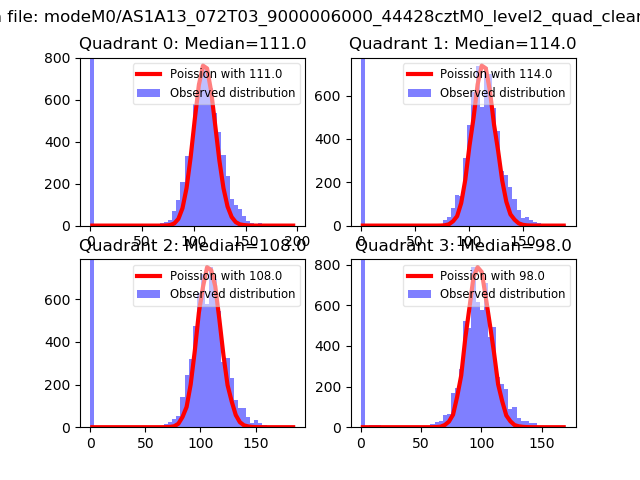 |
 |
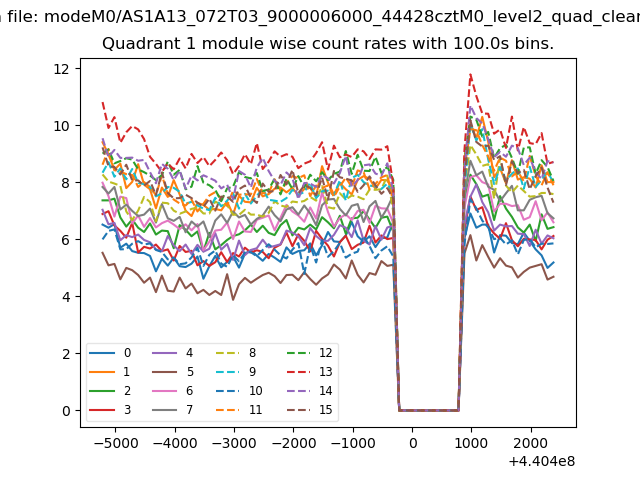
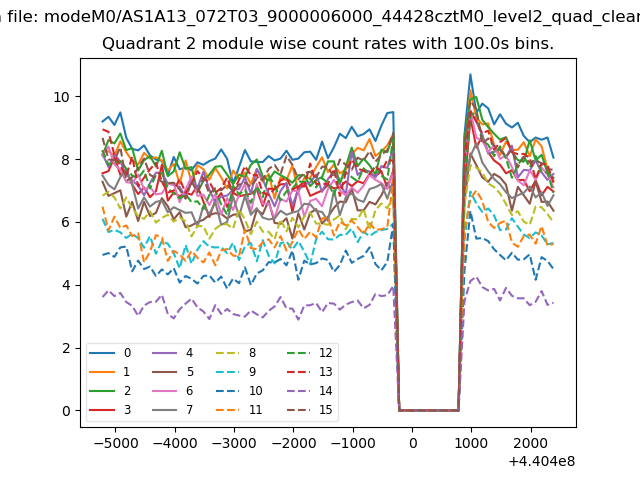
| Quadrant-wise count rates Data is divided into 100 sec bins |
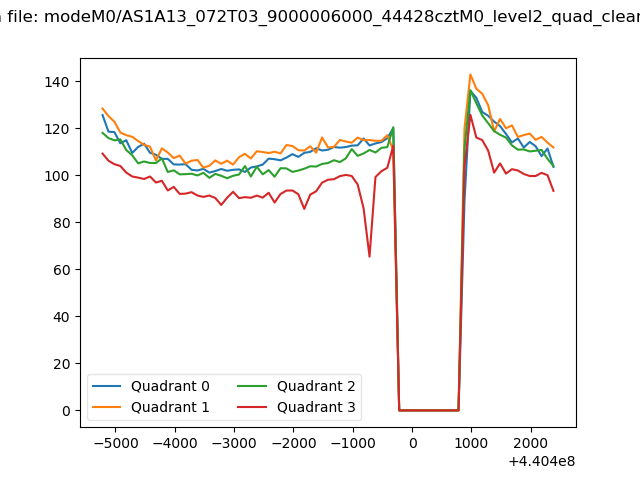 |
|
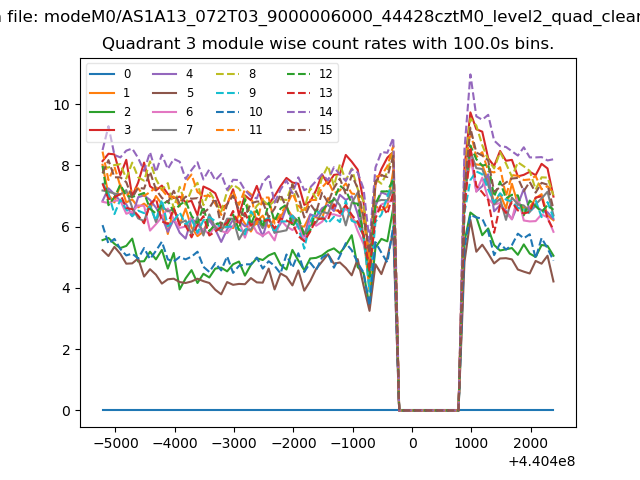
| Module-wise count rates for Quadrant A Data is divided into 100 sec bins |
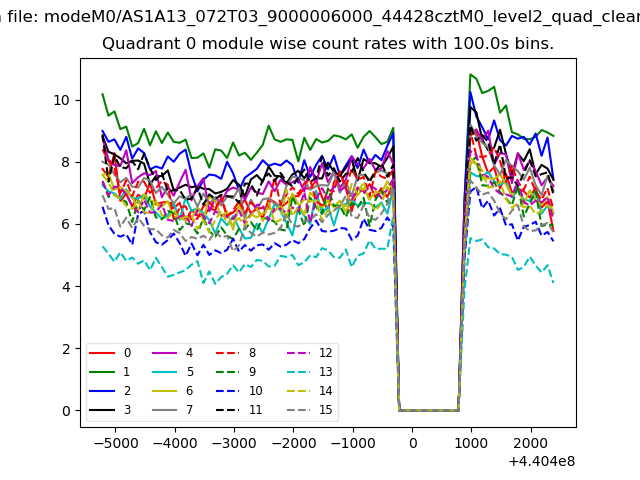 |
 |
| Module-wise count rates for Quadrant B Data is divided into 100 sec bins |
 |
 |
| Module-wise count rates for Quadrant C Data is divided into 100 sec bins |
 |
 |
| Module-wise count rates for Quadrant D Data is divided into 100 sec bins |
 |
 |
| Parameter | Plot |
|---|---|
| CZT HV Monitor | 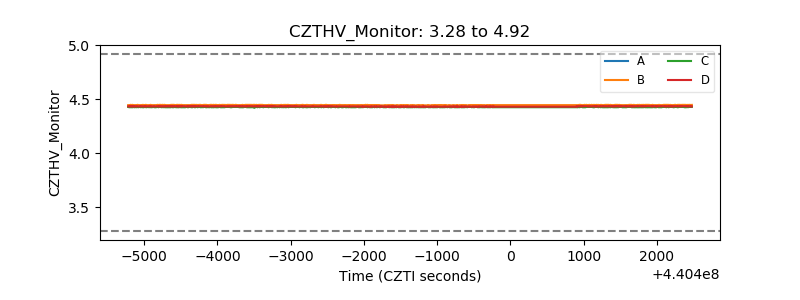 |
| D_VDD | 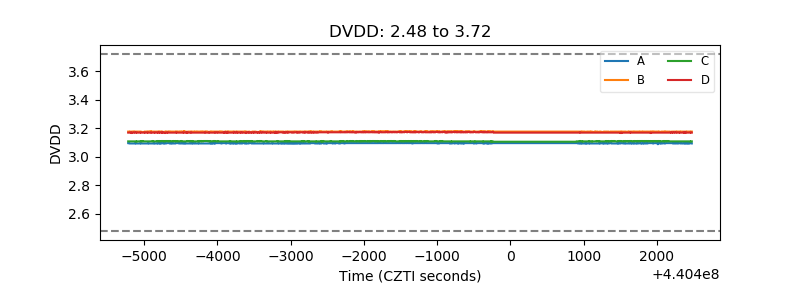 |
| Temperature 1 | 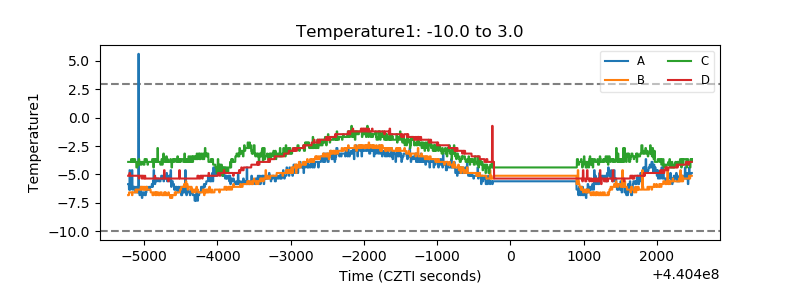 |
| Veto HV Monitor | 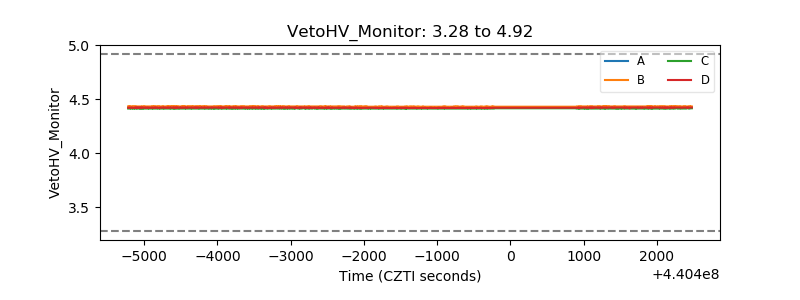 |
| Veto LLD | 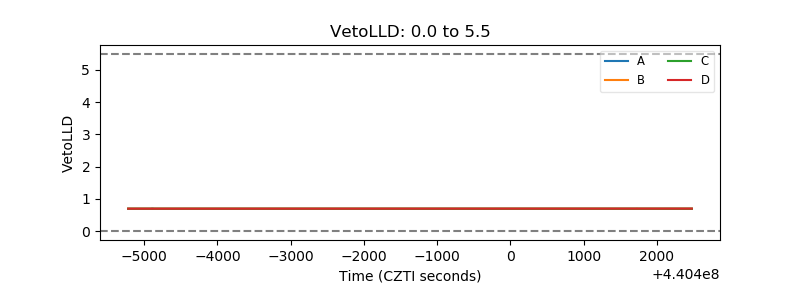 |
| Alpha Counter | 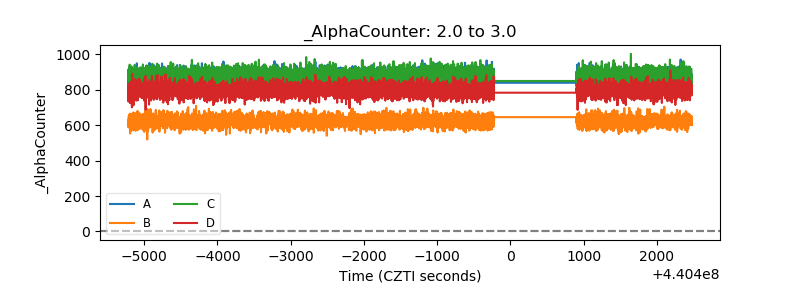 |
| _CPM_Rate | 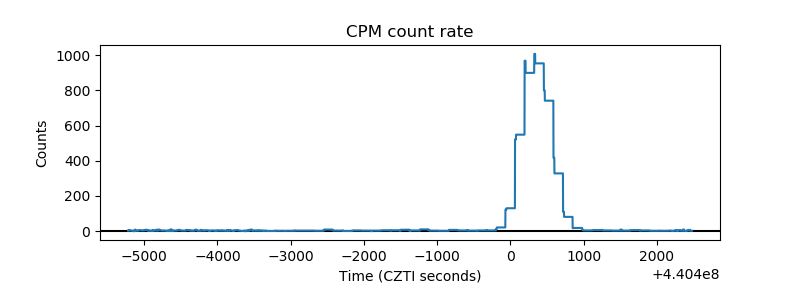 |
| CZT Counter | 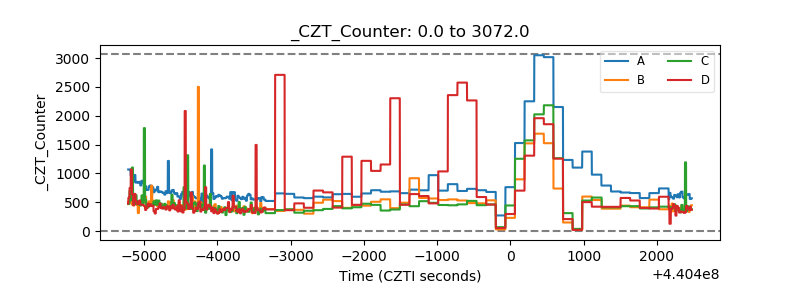 |
| +2.5 Volts monitor | 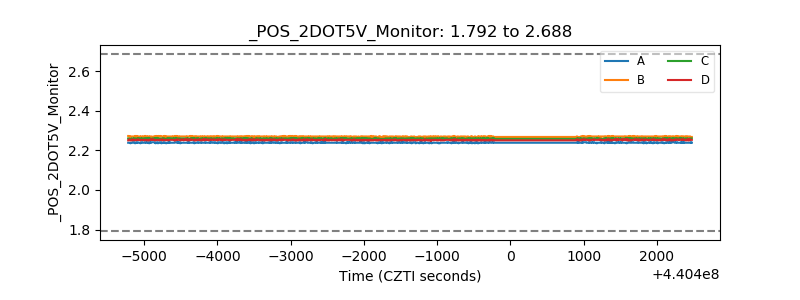 |
| +5 Volts monitor | 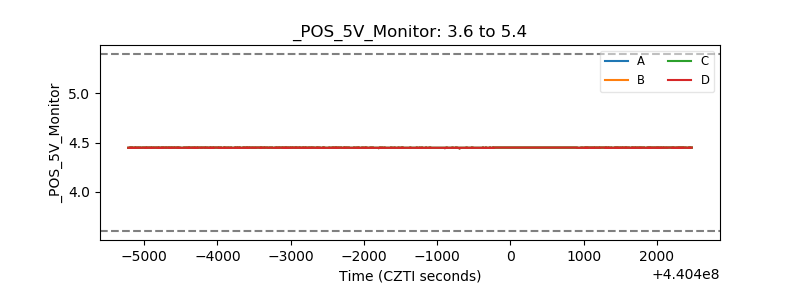 |
| _ROLL_ROT | 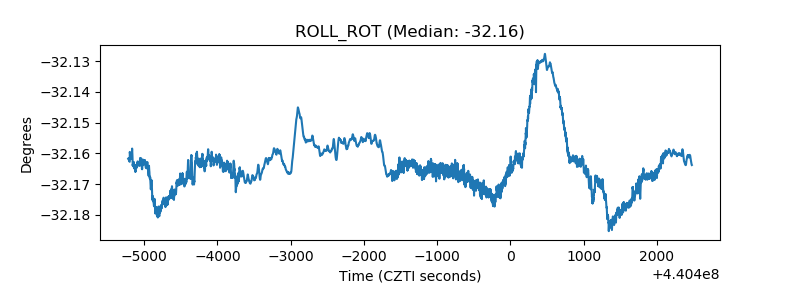 |
| _Roll_DEC | 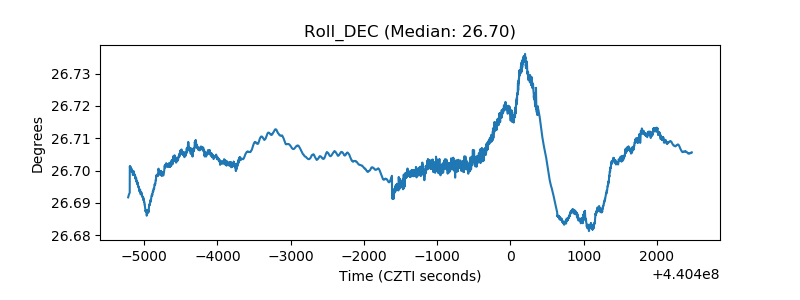 |
| _Roll_RA | 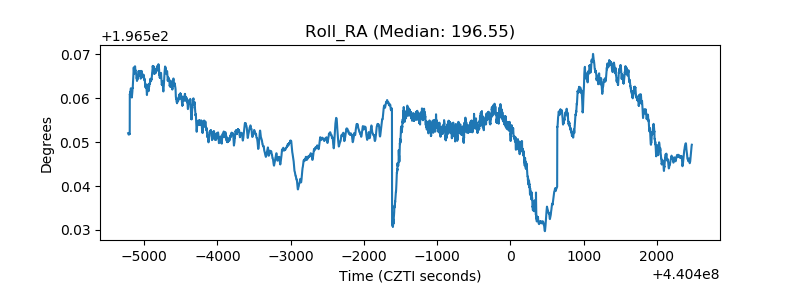 |
| Veto Counter | 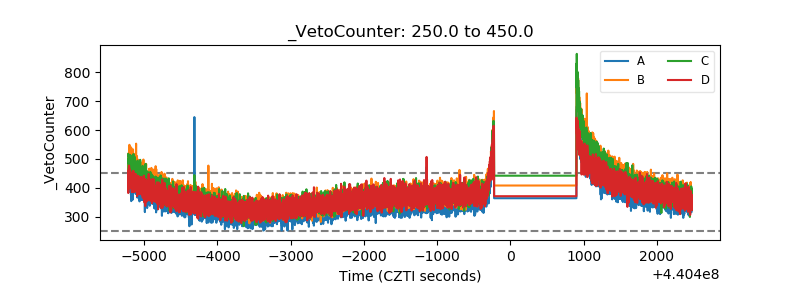 |