| Param | Original file | Final file |
|---|---|---|
| Filename | modeM0/AS1A13_072T03_9000006000_44429cztM0_level2.fits | modeM0/AS1A13_072T03_9000006000_44429cztM0_level2_quad_clean.evt |
| Size (bytes) | 366,128,640 | 98,622,720 |
| Size | 349.2 MB | 94.1 MB |
| Events in quadrant A | 4,076,021 | 658,677 |
| Events in quadrant B | 2,799,587 | 685,119 |
| Events in quadrant C | 2,698,905 | 650,304 |
| Events in quadrant D | 3,528,676 | 588,150 |
| Mode SS | |||
|---|---|---|---|
| Quadrant | BADHDUFLAG | Total packets | Discarded packets |
| A | 0 | 118 | 0 |
| B | 0 | 118 | 0 |
| C | 0 | 118 | 0 |
| D | 0 | 118 | 0 |
| Mode M9 | |||
|---|---|---|---|
| Quadrant | BADHDUFLAG | Total packets | Discarded packets |
| A | 0 | 11 | 0 |
| B | 0 | 11 | 0 |
| C | 0 | 11 | 0 |
| D | 0 | 11 | 0 |
| Mode M0 | |||
|---|---|---|---|
| Quadrant | BADHDUFLAG | Total packets | Discarded packets |
| A | 0 | 17064 | 1 |
| B | 0 | 12237 | 1 |
| C | 0 | 12048 | 1 |
| D | 0 | 14478 | 1 |
| Quadrant | Total seconds | Saturated seconds | Saturation percentage |
|---|---|---|---|
| A | 5779 | 89 | 1.540059% |
| B | 5780 | 73 | 1.262976% |
| C | 5780 | 13 | 0.224913% |
| D | 5780 | 99 | 1.712803% |
Noise dominated data is calculated using 1-second bins in cleaned event files. If a bin has >2000 counts, and if more than 50% of those come from <1% of pixels, then it is considered to be noise-dominated and hence unusable.
| Quadrant | # 1 sec bins | Bins with >0 counts | Bins with >2000 counts | High rate bins dominated by noise | Noise dominated (total time) | Noise dominated (detector-on time) | Marked lightcurve |
|---|---|---|---|---|---|---|---|
| A | 6934 | 5780 | 5 | 5 | 0.07% | 0.09% | 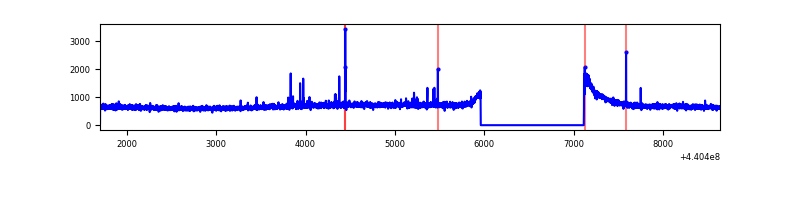 |
| B | 6935 | 5781 | 23 | 23 | 0.33% | 0.40% | 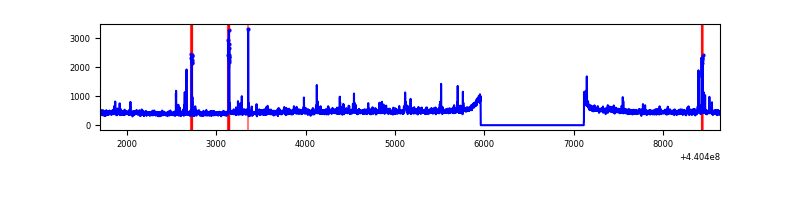 |
| C | 6935 | 5781 | 1 | 1 | 0.01% | 0.02% | 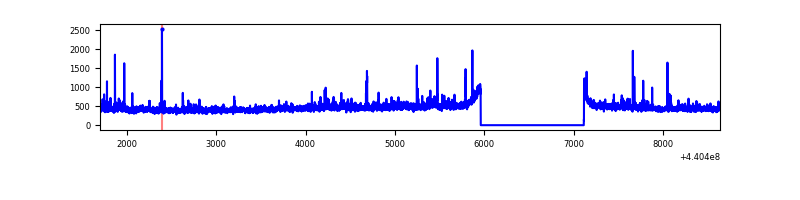 |
| D | 6935 | 5781 | 69 | 69 | 0.99% | 1.19% | 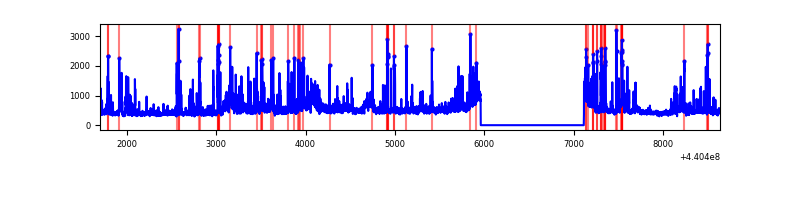 |
Top three noisy pixels from each quadrant. If the there are fewer than three noisy pixels in the level2.evt file, extra rows are filled as -1
| Pixel properties | Quadrant properties | ||||||
|---|---|---|---|---|---|---|---|
| Quadrant | DetID | PixID | Counts | Sigma | Mean | Median | Sigma |
| A | 10 | 83 | 1457283 | 10626.12 | 662 | 650 | 137.1 |
| A | 10 | 248 | 24755 | 175.85 | 662 | 650 | 137.1 |
| A | 0 | 243 | 13748 | 95.55 | 662 | 650 | 137.1 |
| B | 0 | 168 | 58590 | 447.32 | 658 | 640 | 129.5 |
| B | 5 | 172 | 49259 | 375.29 | 658 | 640 | 129.5 |
| B | 0 | 155 | 34472 | 261.15 | 658 | 640 | 129.5 |
| C | 3 | 233 | 97597 | 640.55 | 645 | 648 | 151.4 |
| C | 14 | 254 | 41972 | 273.03 | 645 | 648 | 151.4 |
| C | 2 | 14 | 24711 | 158.99 | 645 | 648 | 151.4 |
| D | 5 | 222 | 322010 | 2003.4 | 641 | 623 | 160.4 |
| D | 5 | 235 | 284946 | 1772.36 | 641 | 623 | 160.4 |
| D | 2 | 249 | 137411 | 852.68 | 641 | 623 | 160.4 |
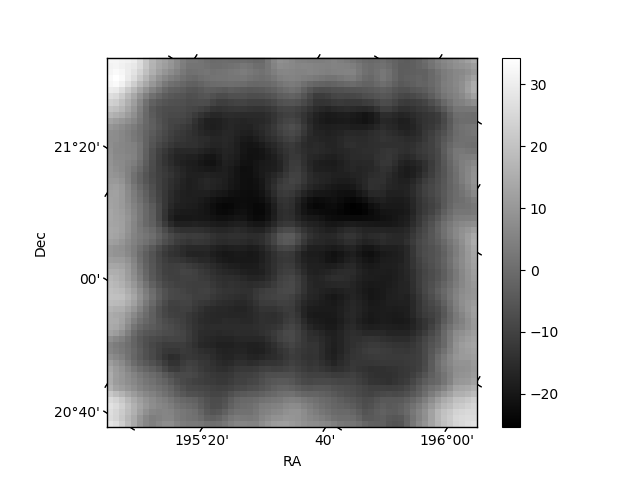
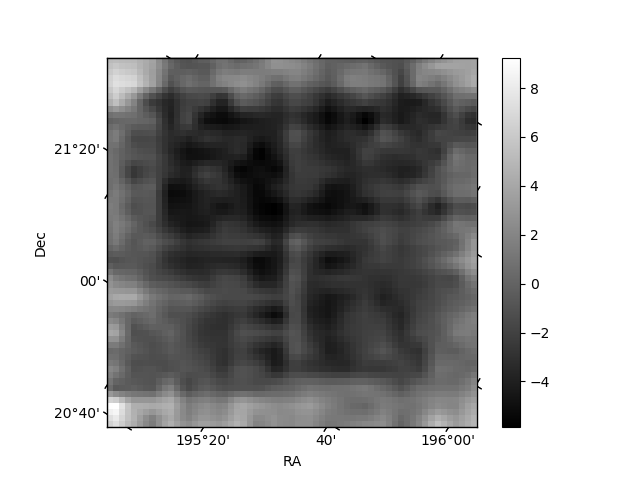
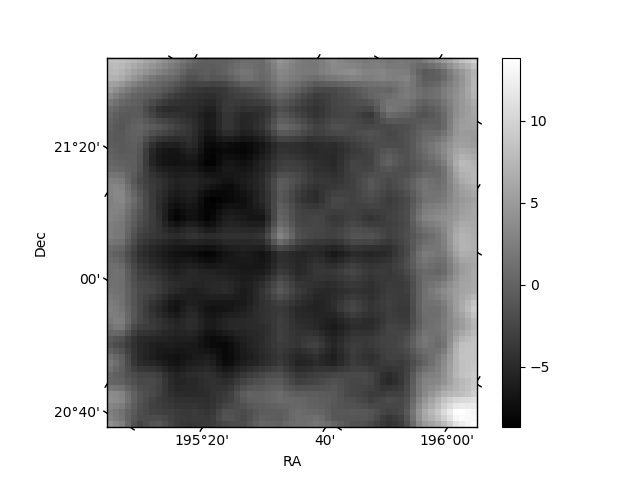
Histogram calculated using DETX and DETY for each event in the final _common_clean file
| Quadrant A | 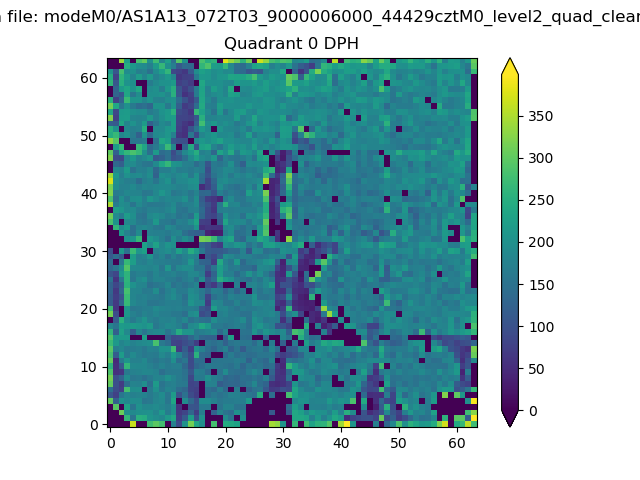 |
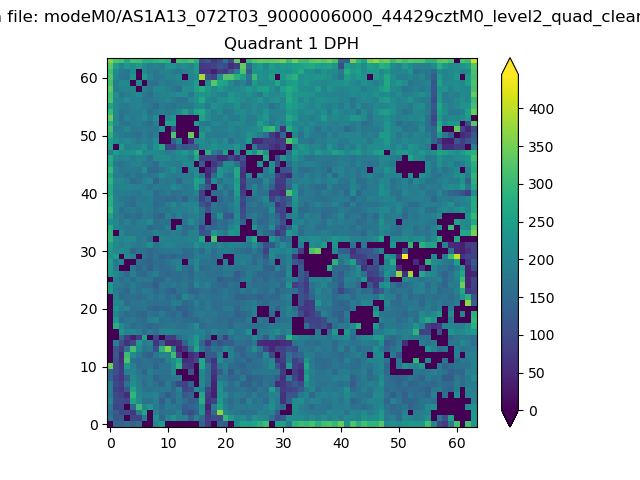 |
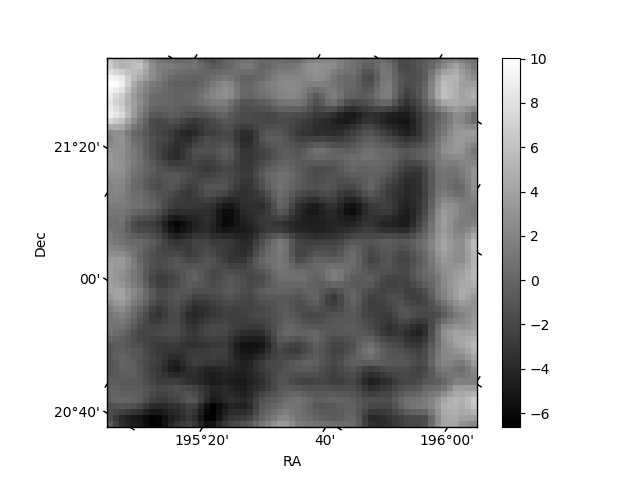
Quadrant B |
|---|---|---|---|
| Quadrant D | 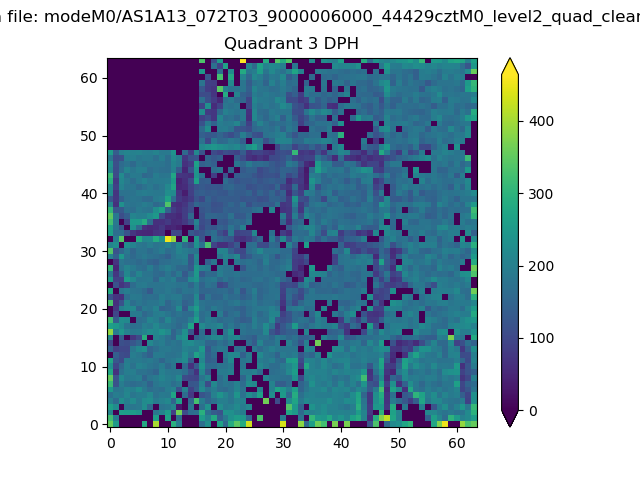 |
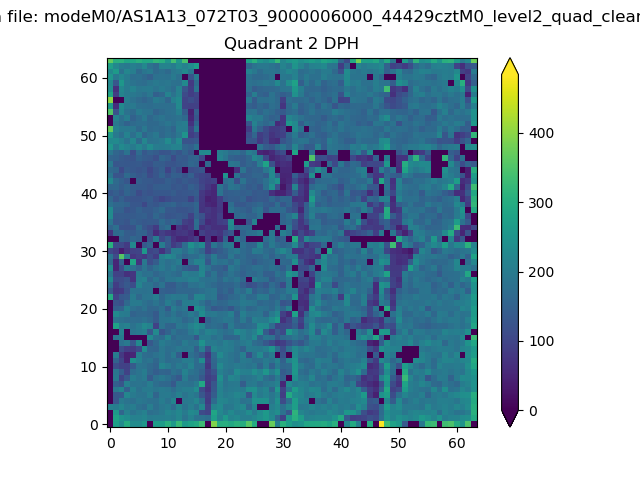 |
Quadrant C |
| Plot type | Count rate plots | Images |
|---|---|---|
| Comparison with Poisson distribution Blue bars denote a histogram of data divided into 1 sec bins. Red curve is a Poisson curve with rate = median count rate of data. |
 |
 |
| Quadrant-wise count rates Data is divided into 100 sec bins |
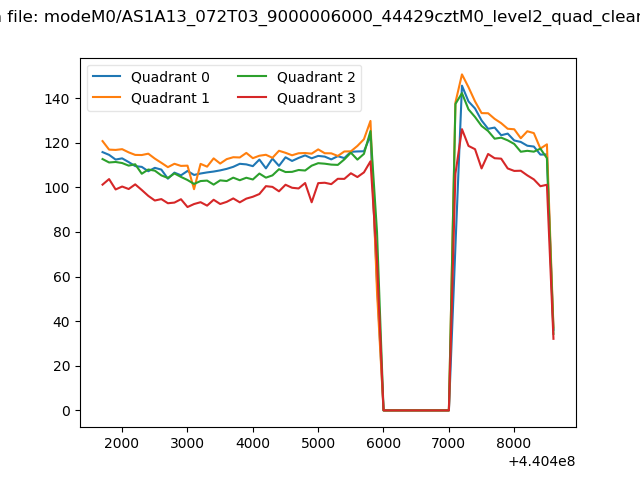 |
|
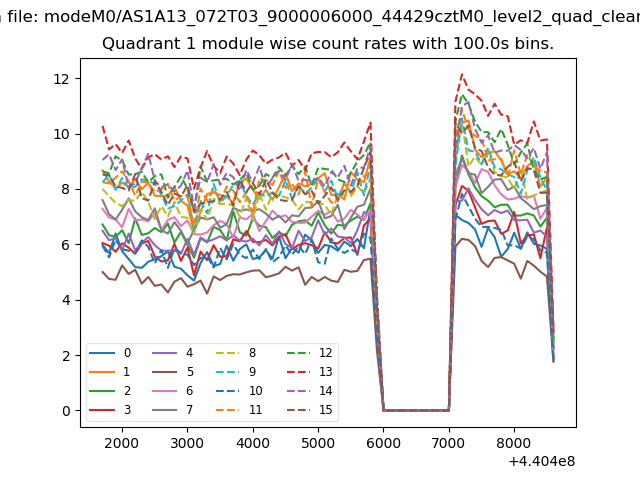
| Module-wise count rates for Quadrant A Data is divided into 100 sec bins |
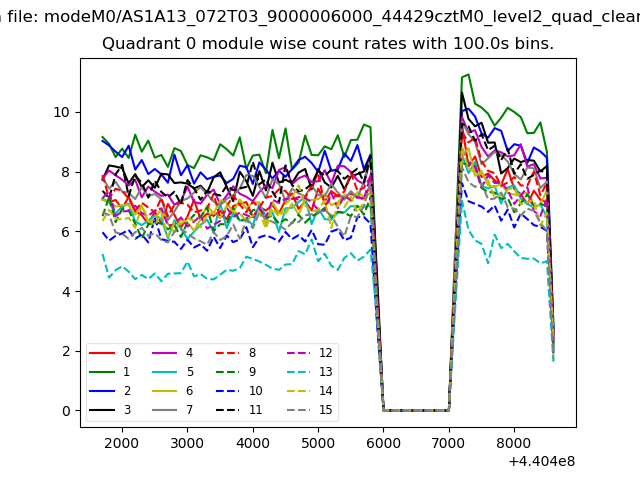 |
 |
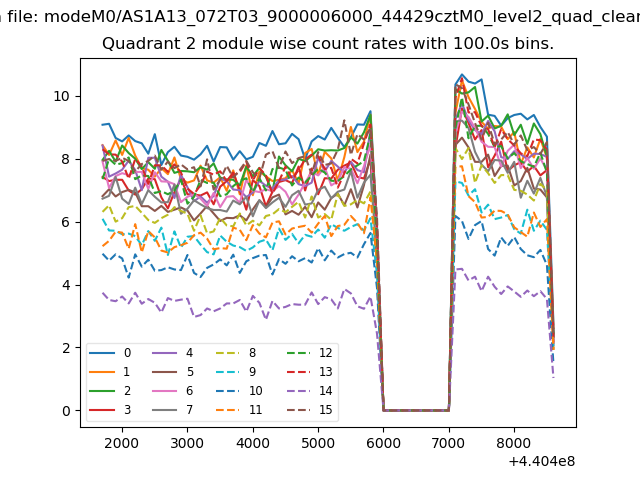
| Module-wise count rates for Quadrant B Data is divided into 100 sec bins |
 |
 |
| Module-wise count rates for Quadrant C Data is divided into 100 sec bins |
 |
 |
| Module-wise count rates for Quadrant D Data is divided into 100 sec bins |
 |
 |
| Parameter | Plot |
|---|---|
| CZT HV Monitor | 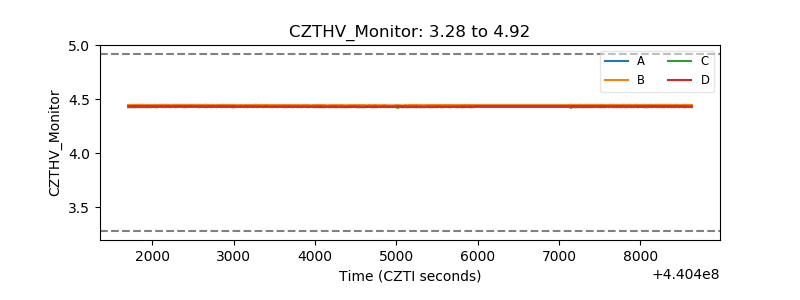 |
| D_VDD | 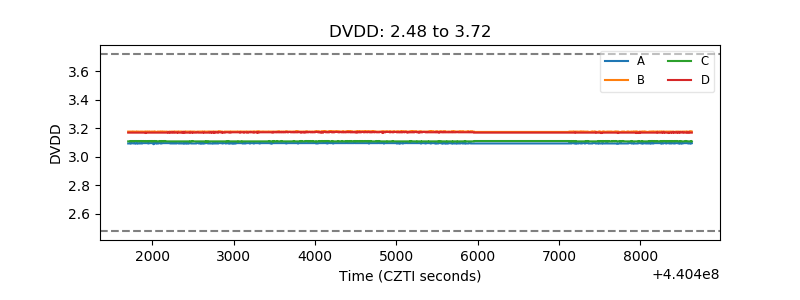 |
| Temperature 1 | 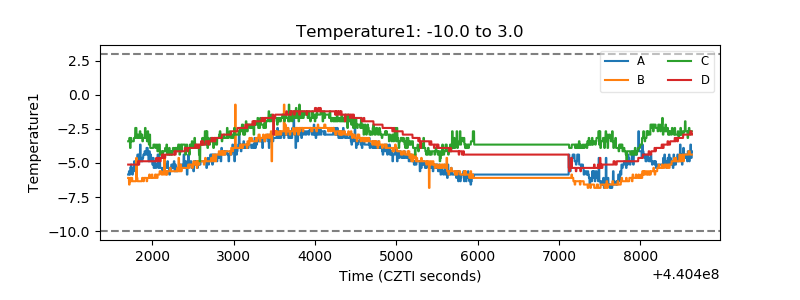 |
| Veto HV Monitor | 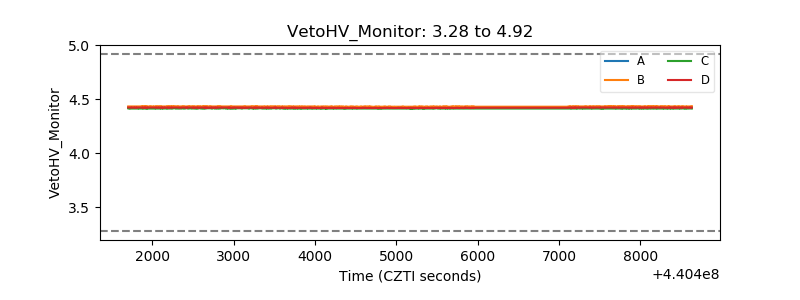 |
| Veto LLD | 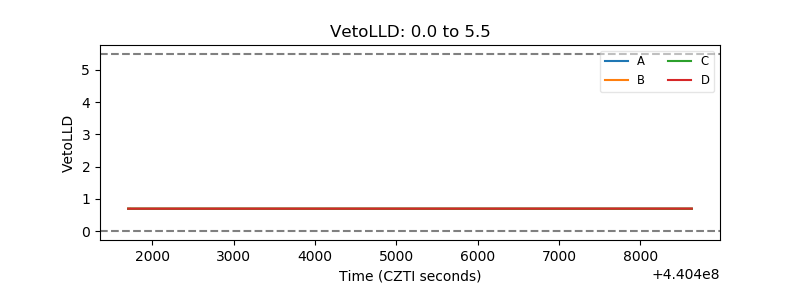 |
| Alpha Counter | 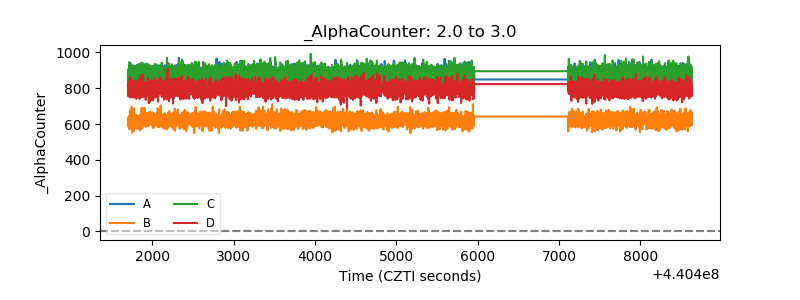 |
| _CPM_Rate | 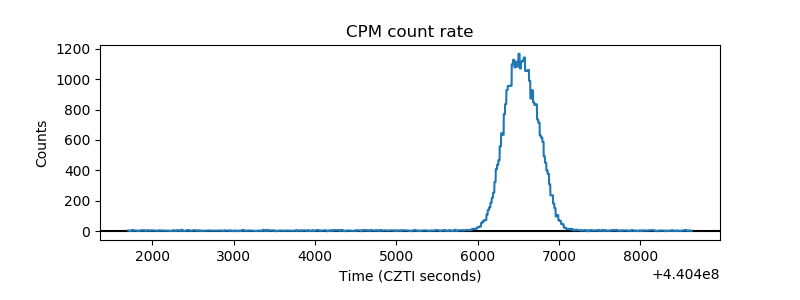 |
| CZT Counter | 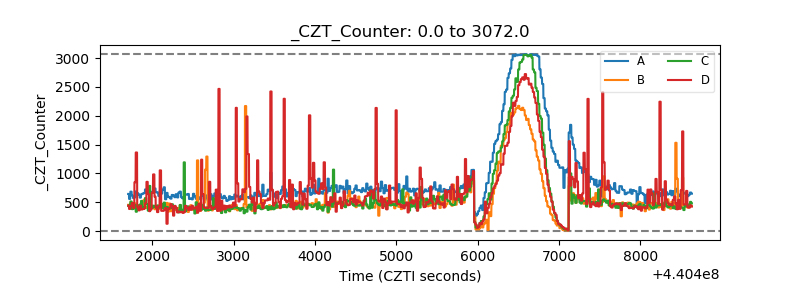 |
| +2.5 Volts monitor | 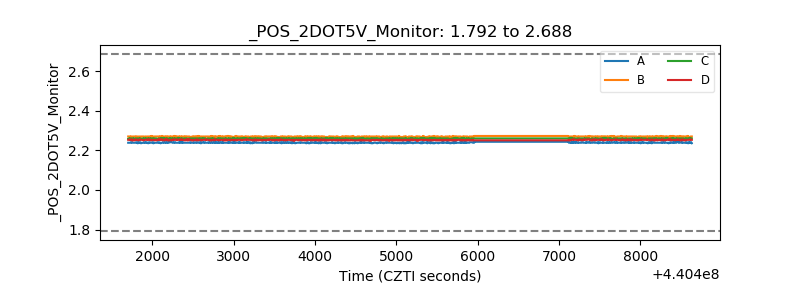 |
| +5 Volts monitor | 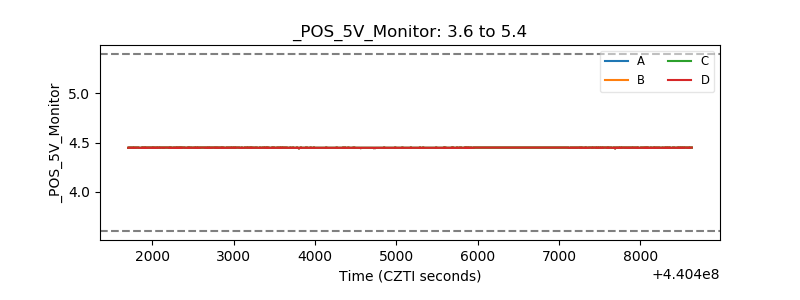 |
| _ROLL_ROT | 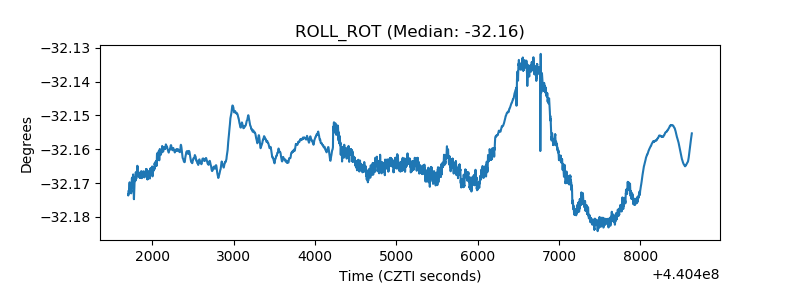 |
| _Roll_DEC | 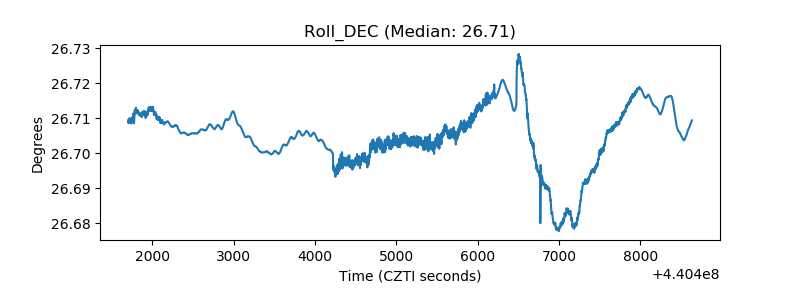 |
| _Roll_RA | 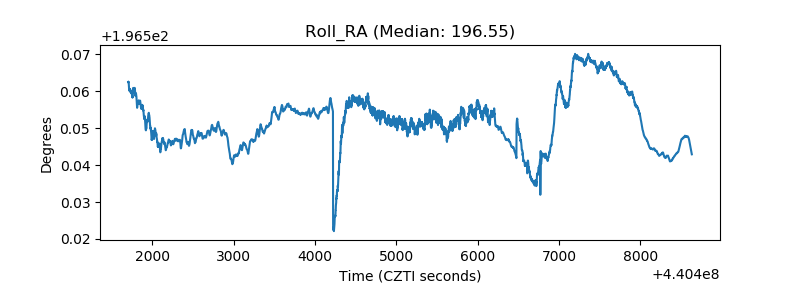 |
| Veto Counter | 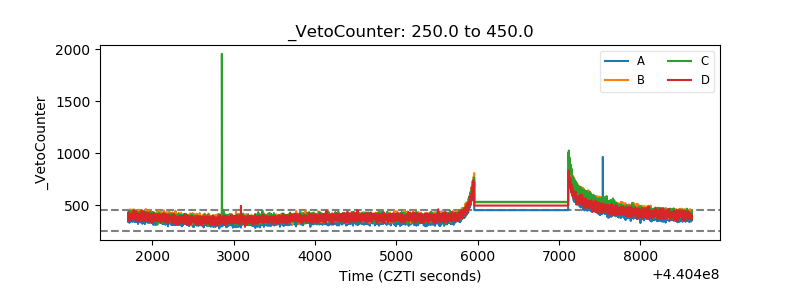 |