| Param | Original file | Final file |
|---|---|---|
| Filename | modeM0/AS1A13_072T03_9000006000_44431cztM0_level2.fits | modeM0/AS1A13_072T03_9000006000_44431cztM0_level2_quad_clean.evt |
| Size (bytes) | 396,190,080 | 100,661,760 |
| Size | 377.8 MB | 96.0 MB |
| Events in quadrant A | 4,321,292 | 675,469 |
| Events in quadrant B | 3,025,887 | 697,665 |
| Events in quadrant C | 3,148,927 | 666,354 |
| Events in quadrant D | 3,712,450 | 598,374 |
| Mode SS | |||
|---|---|---|---|
| Quadrant | BADHDUFLAG | Total packets | Discarded packets |
| A | 0 | 118 | 0 |
| B | 0 | 118 | 0 |
| C | 0 | 118 | 0 |
| D | 0 | 118 | 0 |
| Mode M9 | |||
|---|---|---|---|
| Quadrant | BADHDUFLAG | Total packets | Discarded packets |
| A | 0 | 12 | 0 |
| B | 0 | 12 | 0 |
| C | 0 | 12 | 0 |
| D | 0 | 12 | 0 |
| Mode M0 | |||
|---|---|---|---|
| Quadrant | BADHDUFLAG | Total packets | Discarded packets |
| A | 0 | 18043 | 1 |
| B | 0 | 12782 | 1 |
| C | 0 | 13198 | 1 |
| D | 0 | 14994 | 1 |
| Quadrant | Total seconds | Saturated seconds | Saturation percentage |
|---|---|---|---|
| A | 5875 | 161 | 2.740426% |
| B | 5876 | 141 | 2.399592% |
| C | 5876 | 118 | 2.008169% |
| D | 5876 | 247 | 4.203540% |
Noise dominated data is calculated using 1-second bins in cleaned event files. If a bin has >2000 counts, and if more than 50% of those come from <1% of pixels, then it is considered to be noise-dominated and hence unusable.
| Quadrant | # 1 sec bins | Bins with >0 counts | Bins with >2000 counts | High rate bins dominated by noise | Noise dominated (total time) | Noise dominated (detector-on time) | Marked lightcurve |
|---|---|---|---|---|---|---|---|
| A | 7010 | 5877 | 9 | 9 | 0.13% | 0.15% | 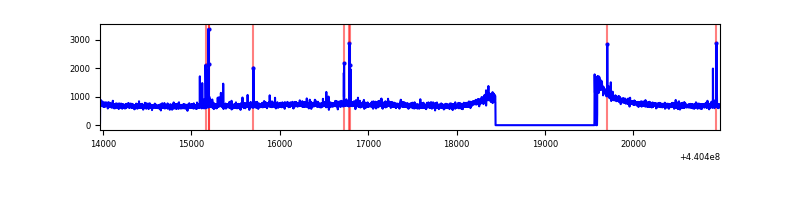 |
| B | 7011 | 5878 | 27 | 27 | 0.39% | 0.46% | 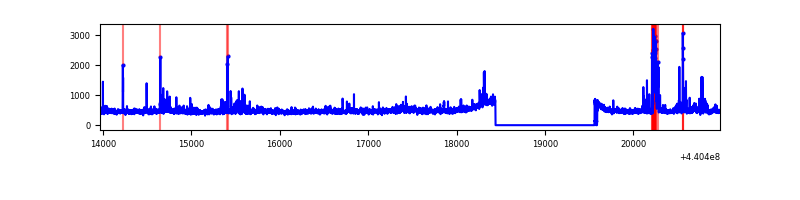 |
| C | 7011 | 5878 | 50 | 50 | 0.71% | 0.85% | 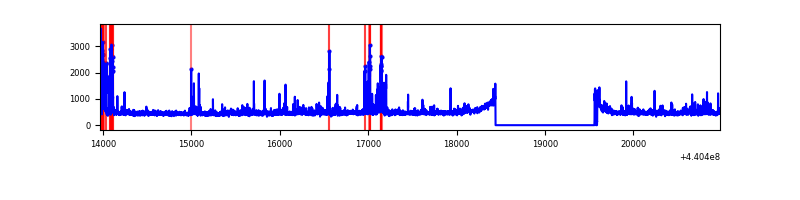 |
| D | 7011 | 5878 | 156 | 156 | 2.23% | 2.65% | 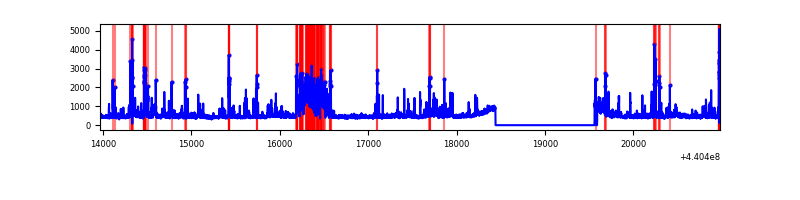 |
Top three noisy pixels from each quadrant. If the there are fewer than three noisy pixels in the level2.evt file, extra rows are filled as -1
| Pixel properties | Quadrant properties | ||||||
|---|---|---|---|---|---|---|---|
| Quadrant | DetID | PixID | Counts | Sigma | Mean | Median | Sigma |
| A | 10 | 83 | 1536553 | 10633.19 | 695 | 682 | 144.4 |
| A | 10 | 248 | 29294 | 198.09 | 695 | 682 | 144.4 |
| A | 7 | 16 | 19342 | 129.19 | 695 | 682 | 144.4 |
| B | 5 | 172 | 119141 | 877.27 | 687 | 668 | 135.0 |
| B | 0 | 229 | 117886 | 867.98 | 687 | 668 | 135.0 |
| B | 0 | 168 | 35233 | 255.95 | 687 | 668 | 135.0 |
| C | 2 | 14 | 282336 | 1770.77 | 679 | 684 | 159.1 |
| C | 3 | 233 | 162039 | 1014.45 | 679 | 684 | 159.1 |
| C | 14 | 254 | 45772 | 283.47 | 679 | 684 | 159.1 |
| D | 12 | 233 | 461778 | 2706.91 | 677 | 654 | 170.4 |
| D | 5 | 235 | 262950 | 1539.74 | 677 | 654 | 170.4 |
| D | 2 | 249 | 96377 | 561.91 | 677 | 654 | 170.4 |
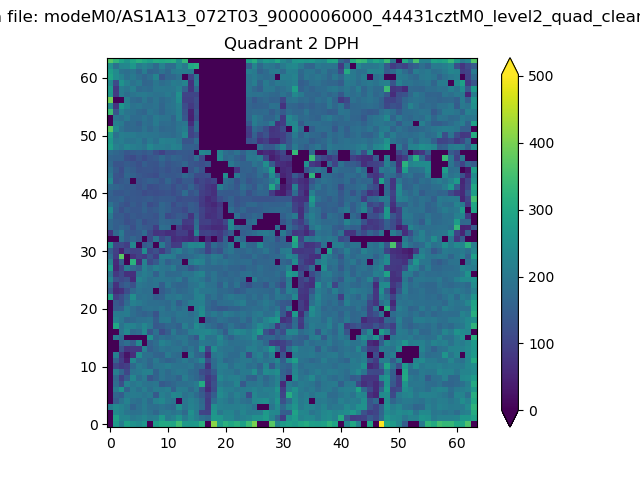
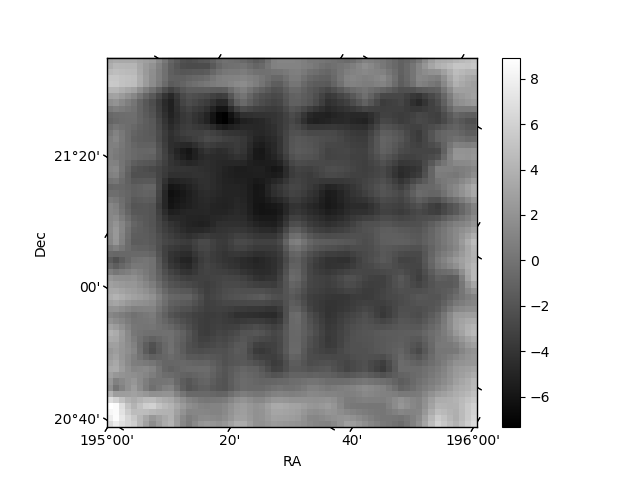
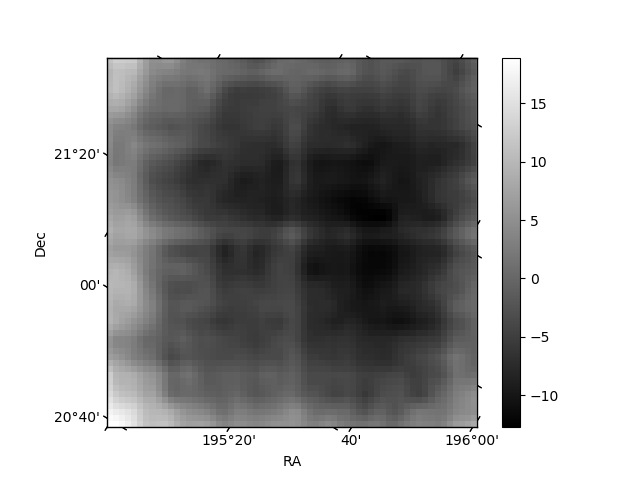
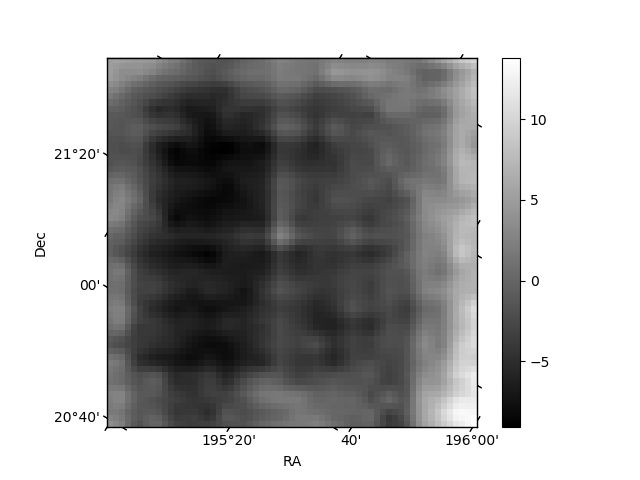
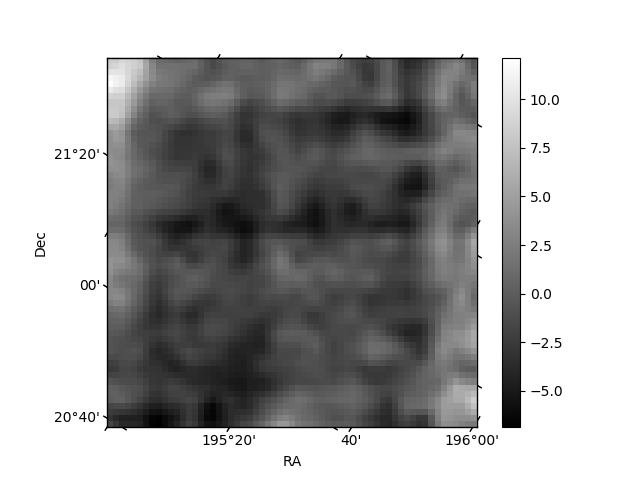
Histogram calculated using DETX and DETY for each event in the final _common_clean file
| Quadrant A | 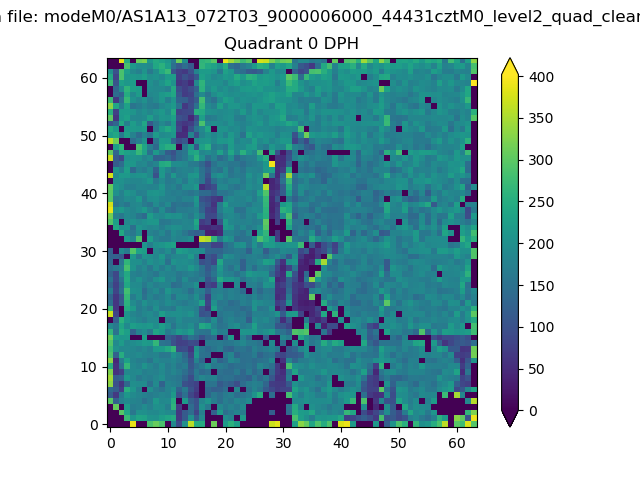 |
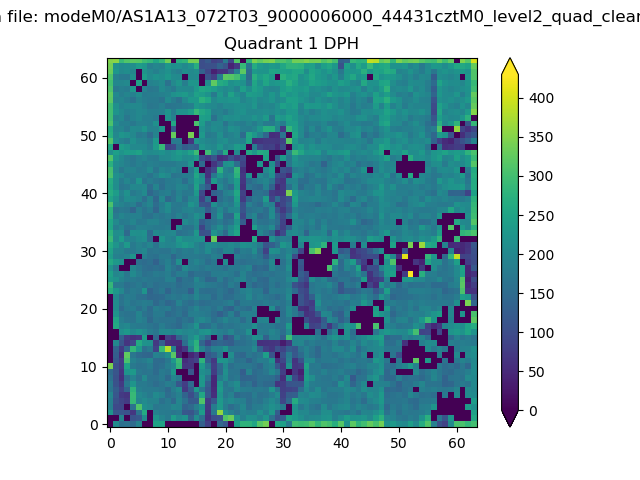 |
Quadrant B |
|---|---|---|---|
| Quadrant D | 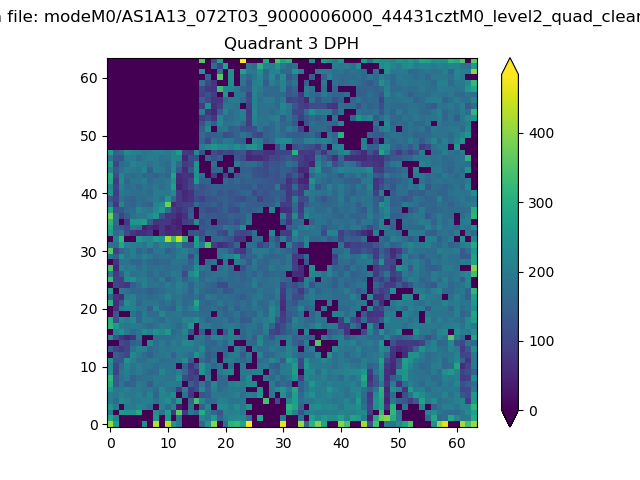 |
 |
Quadrant C |
| Plot type | Count rate plots | Images |
|---|---|---|
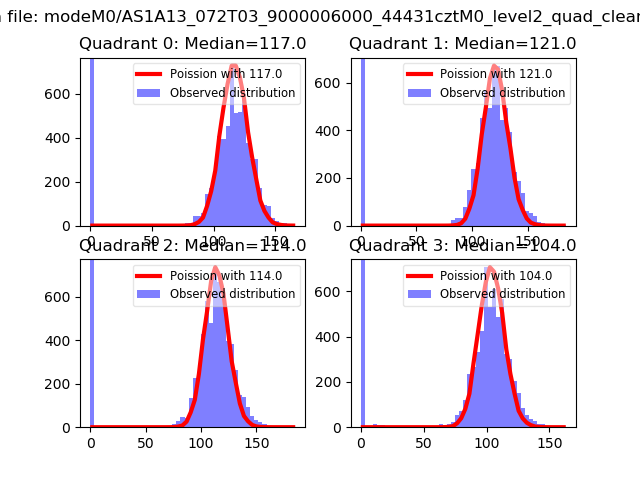
| Comparison with Poisson distribution Blue bars denote a histogram of data divided into 1 sec bins. Red curve is a Poisson curve with rate = median count rate of data. |
 |
 |
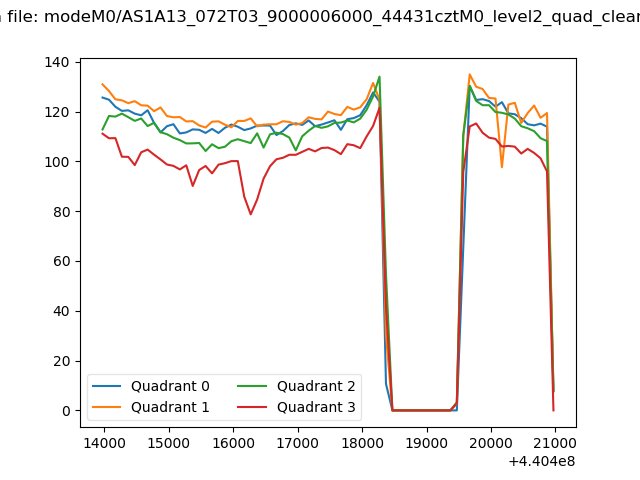
| Quadrant-wise count rates Data is divided into 100 sec bins |
 |
|
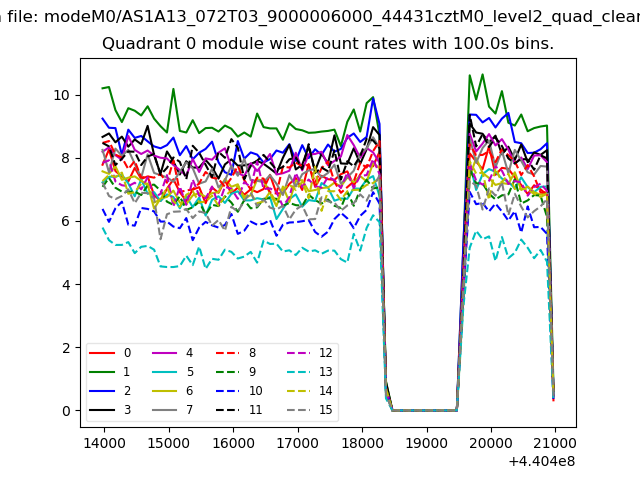
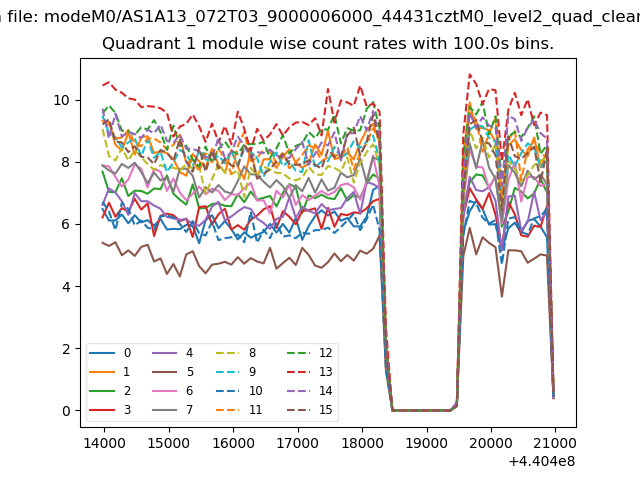
| Module-wise count rates for Quadrant A Data is divided into 100 sec bins |
 |
 |
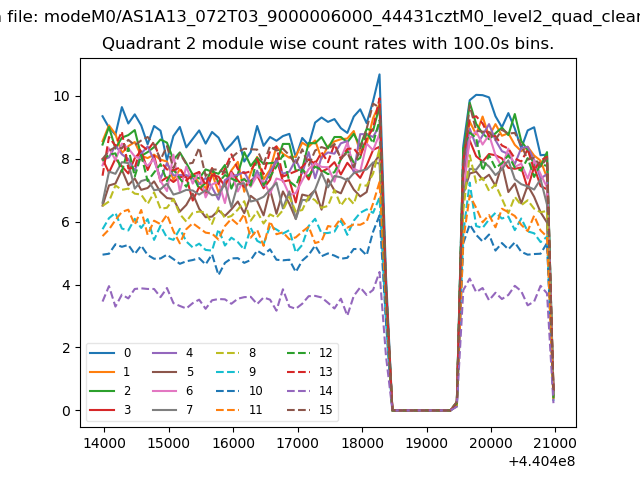
| Module-wise count rates for Quadrant B Data is divided into 100 sec bins |
 |
 |
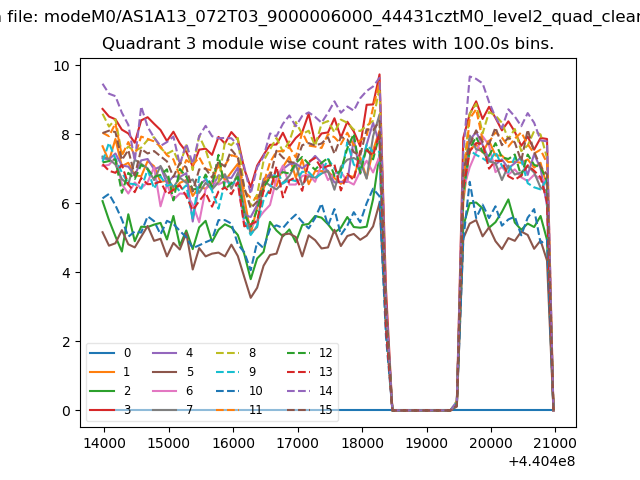
| Module-wise count rates for Quadrant C Data is divided into 100 sec bins |
 |
 |
| Module-wise count rates for Quadrant D Data is divided into 100 sec bins |
 |
 |
| Parameter | Plot |
|---|---|
| CZT HV Monitor |  |
| D_VDD | 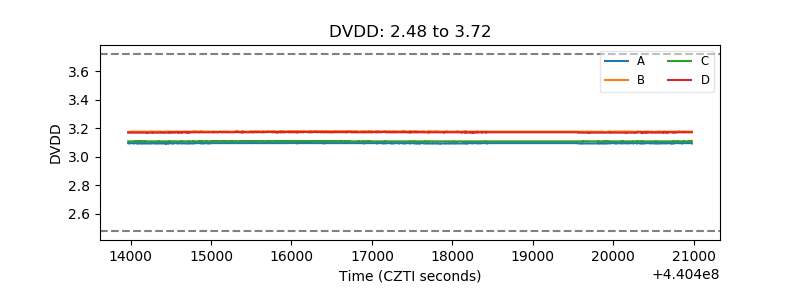 |
| Temperature 1 | 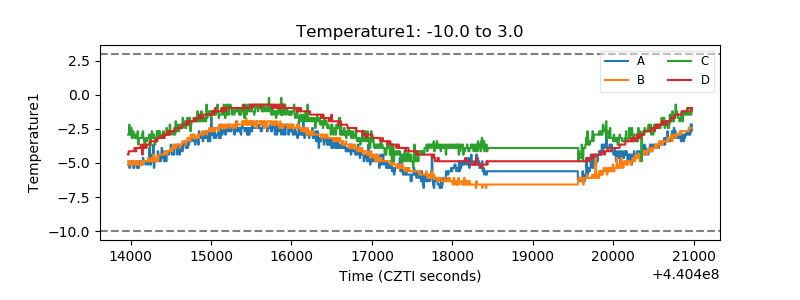 |
| Veto HV Monitor | 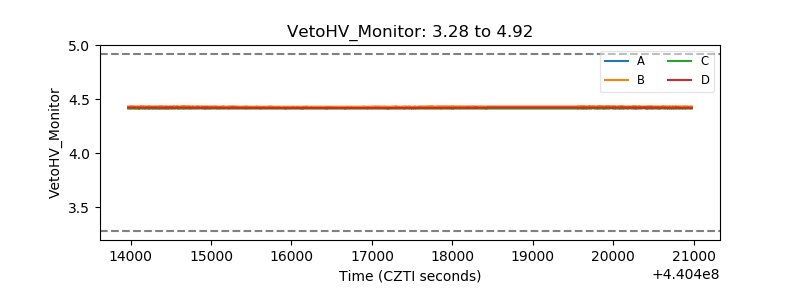 |
| Veto LLD | 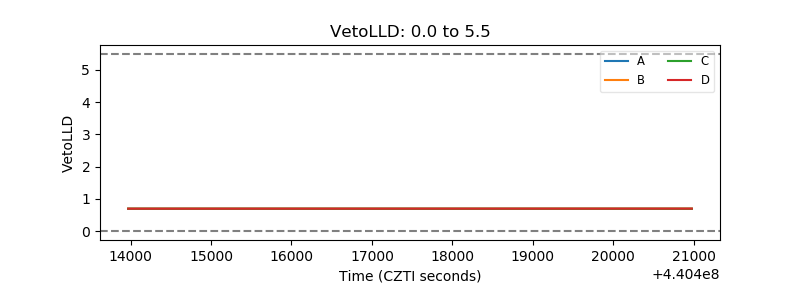 |
| Alpha Counter | 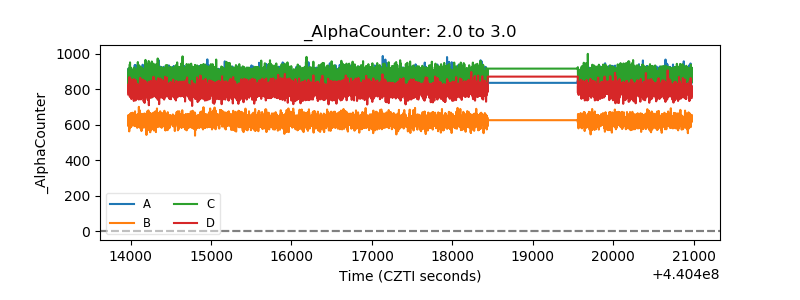 |
| _CPM_Rate | 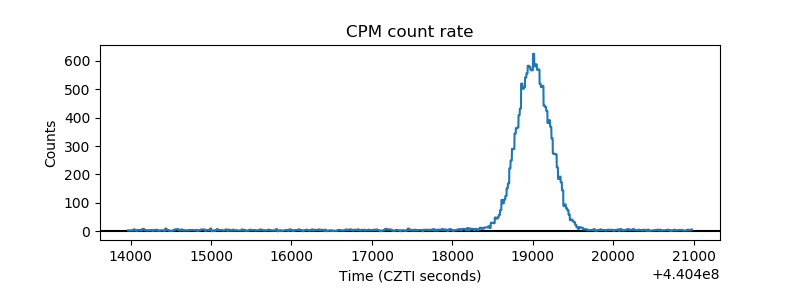 |
| CZT Counter | 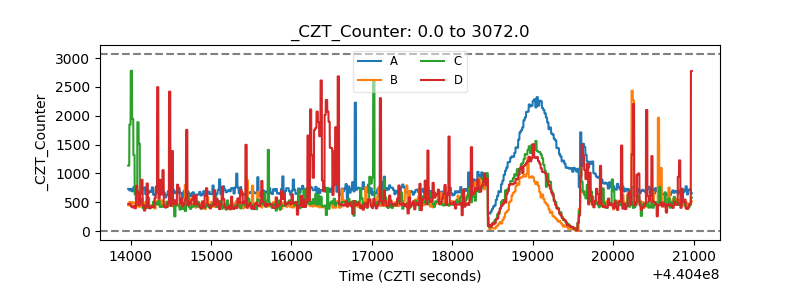 |
| +2.5 Volts monitor | 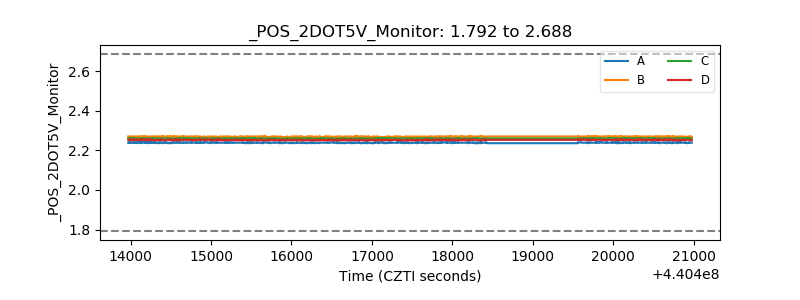 |
| +5 Volts monitor | 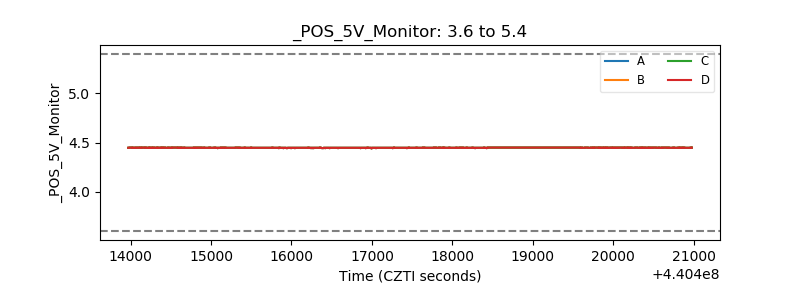 |
| _ROLL_ROT | 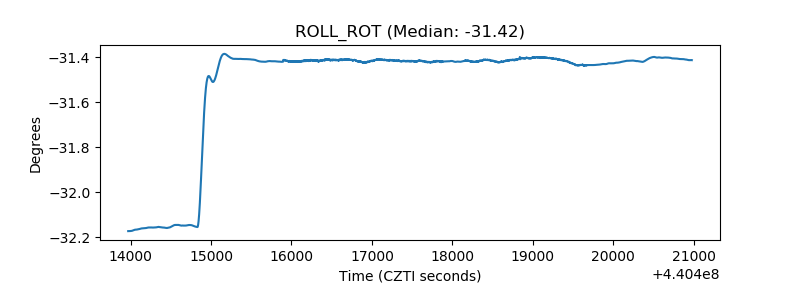 |
| _Roll_DEC | 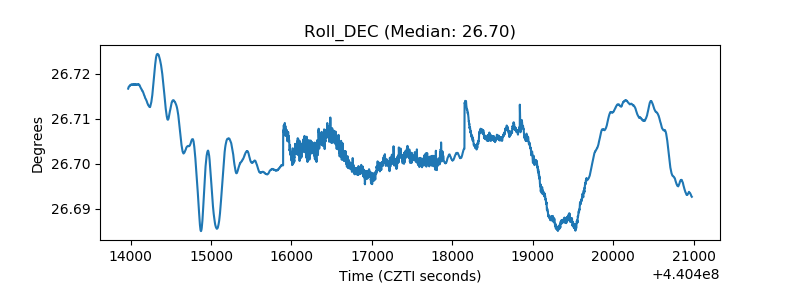 |
| _Roll_RA | 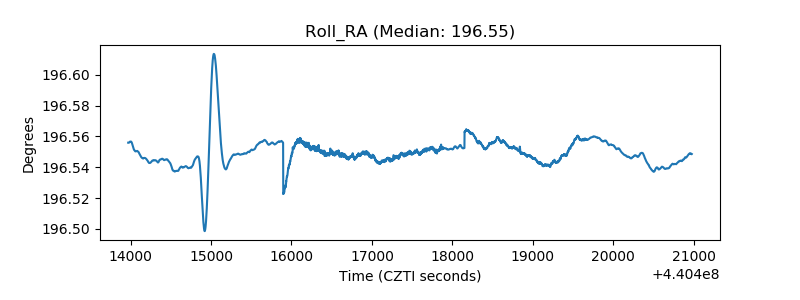 |
| Veto Counter | 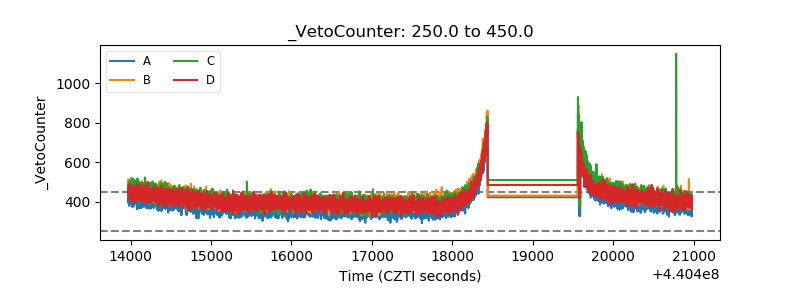 |