| Param | Original file | Final file |
|---|---|---|
| Filename | modeM0/AS1A13_072T03_9000006000_44432cztM0_level2.fits | modeM0/AS1A13_072T03_9000006000_44432cztM0_level2_quad_clean.evt |
| Size (bytes) | 407,315,520 | 97,522,560 |
| Size | 388.4 MB | 93.0 MB |
| Events in quadrant A | 4,225,831 | 654,386 |
| Events in quadrant B | 3,123,570 | 668,285 |
| Events in quadrant C | 3,812,081 | 636,055 |
| Events in quadrant D | 3,456,973 | 581,971 |
| Mode SS | |||
|---|---|---|---|
| Quadrant | BADHDUFLAG | Total packets | Discarded packets |
| A | 0 | 120 | 0 |
| B | 0 | 120 | 0 |
| C | 0 | 120 | 0 |
| D | 0 | 120 | 0 |
| Mode M9 | |||
|---|---|---|---|
| Quadrant | BADHDUFLAG | Total packets | Discarded packets |
| A | 0 | 10 | 0 |
| B | 0 | 10 | 0 |
| C | 0 | 10 | 0 |
| D | 0 | 10 | 0 |
| Mode M0 | |||
|---|---|---|---|
| Quadrant | BADHDUFLAG | Total packets | Discarded packets |
| A | 0 | 17885 | 1 |
| B | 0 | 13107 | 1 |
| C | 0 | 15246 | 1 |
| D | 0 | 14252 | 1 |
| Quadrant | Total seconds | Saturated seconds | Saturation percentage |
|---|---|---|---|
| A | 5900 | 201 | 3.406780% |
| B | 5901 | 215 | 3.643450% |
| C | 5901 | 241 | 4.084054% |
| D | 5900 | 232 | 3.932203% |
Noise dominated data is calculated using 1-second bins in cleaned event files. If a bin has >2000 counts, and if more than 50% of those come from <1% of pixels, then it is considered to be noise-dominated and hence unusable.
| Quadrant | # 1 sec bins | Bins with >0 counts | Bins with >2000 counts | High rate bins dominated by noise | Noise dominated (total time) | Noise dominated (detector-on time) | Marked lightcurve |
|---|---|---|---|---|---|---|---|
| A | 6875 | 5901 | 3 | 3 | 0.04% | 0.05% | 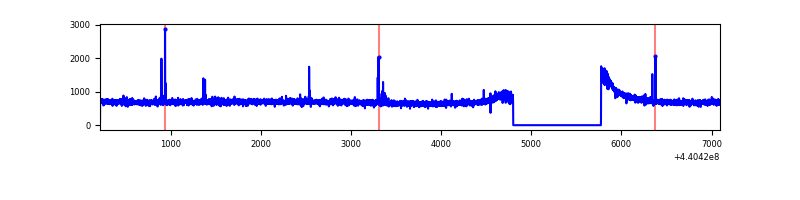 |
| B | 6876 | 5902 | 39 | 39 | 0.57% | 0.66% | 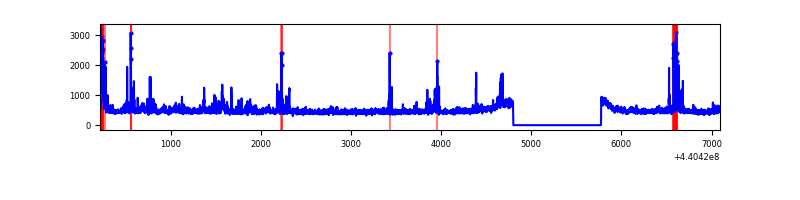 |
| C | 6876 | 5902 | 105 | 105 | 1.53% | 1.78% | 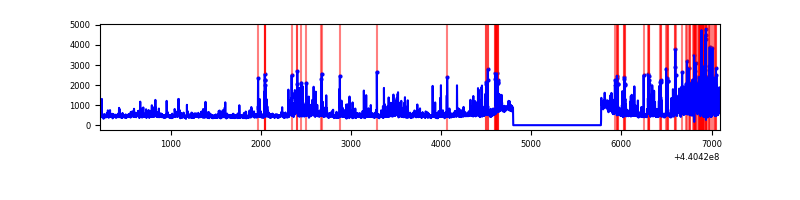 |
| D | 6875 | 5901 | 80 | 80 | 1.16% | 1.36% | 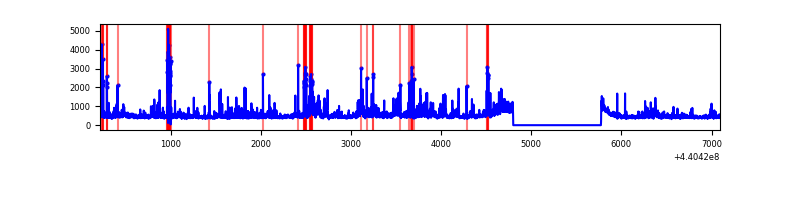 |
Top three noisy pixels from each quadrant. If the there are fewer than three noisy pixels in the level2.evt file, extra rows are filled as -1
| Pixel properties | Quadrant properties | ||||||
|---|---|---|---|---|---|---|---|
| Quadrant | DetID | PixID | Counts | Sigma | Mean | Median | Sigma |
| A | 10 | 83 | 1518762 | 10514.84 | 690 | 674 | 144.4 |
| A | 7 | 3 | 13044 | 85.68 | 690 | 674 | 144.4 |
| A | 13 | 248 | 9067 | 58.13 | 690 | 674 | 144.4 |
| B | 5 | 172 | 188279 | 1378.22 | 682 | 659 | 136.1 |
| B | 0 | 229 | 127180 | 929.4 | 682 | 659 | 136.1 |
| B | 5 | 255 | 46064 | 333.54 | 682 | 659 | 136.1 |
| C | 15 | 208 | 439970 | 2777.67 | 673 | 677 | 158.2 |
| C | 2 | 14 | 341020 | 2152.0 | 673 | 677 | 158.2 |
| C | 3 | 233 | 316941 | 1999.75 | 673 | 677 | 158.2 |
| D | 2 | 249 | 374035 | 2168.95 | 677 | 656 | 172.1 |
| D | 1 | 52 | 97173 | 560.66 | 677 | 656 | 172.1 |
| D | 13 | 249 | 93336 | 538.38 | 677 | 656 | 172.1 |
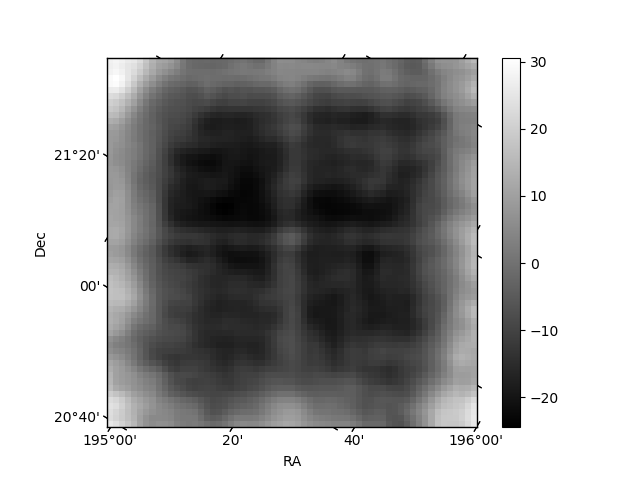
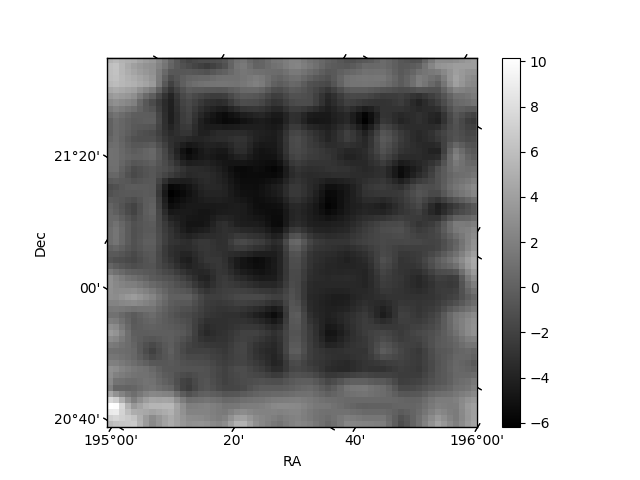
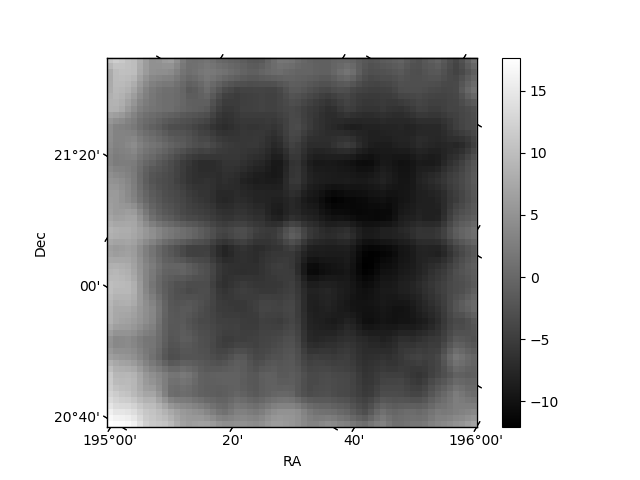
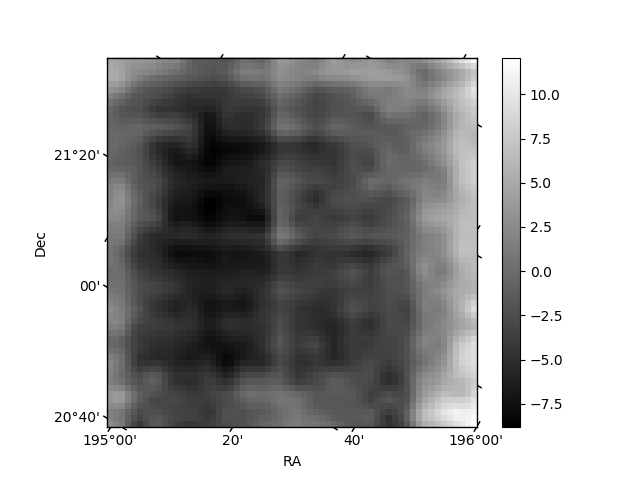
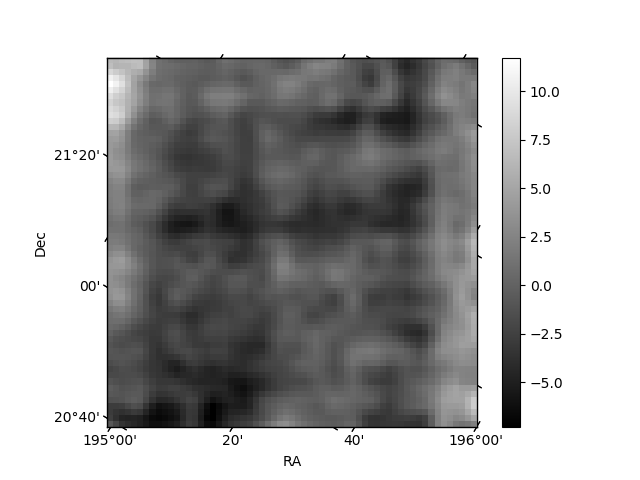
Histogram calculated using DETX and DETY for each event in the final _common_clean file
| Quadrant A | 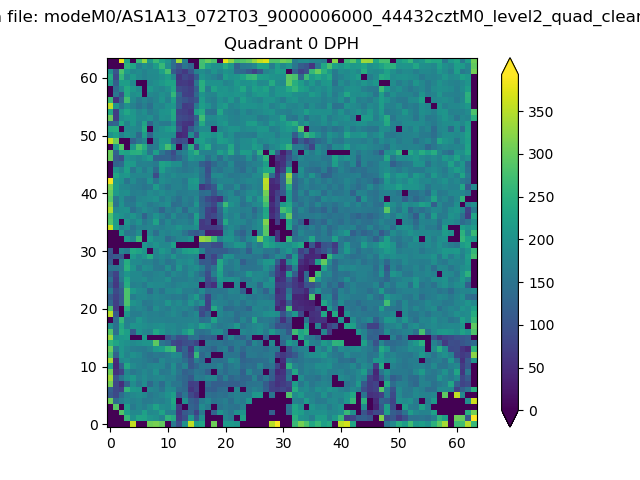 |
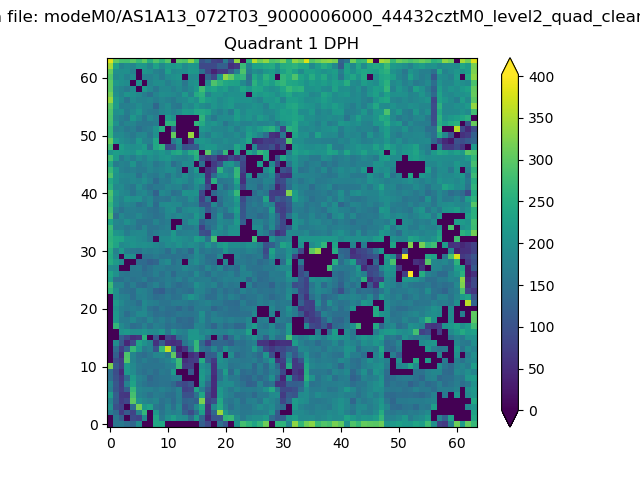 |
Quadrant B |
|---|---|---|---|
| Quadrant D | 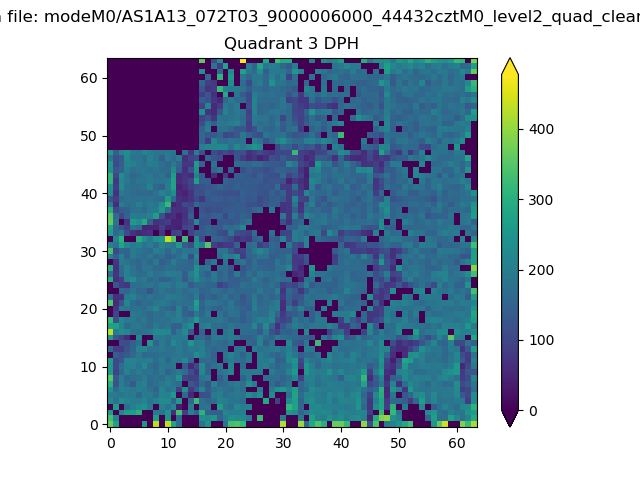 |
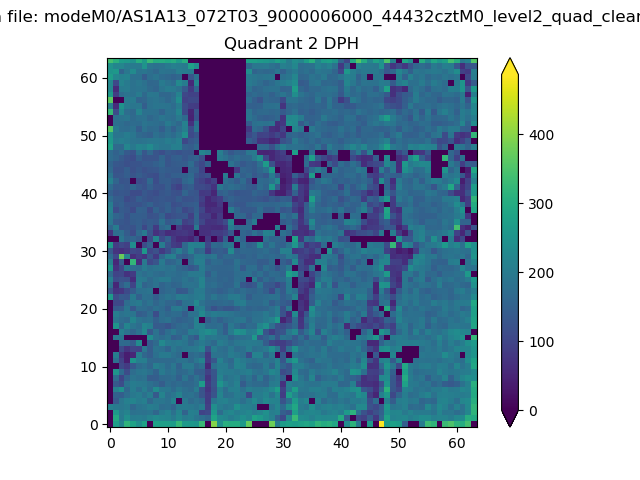 |
Quadrant C |
| Plot type | Count rate plots | Images |
|---|---|---|
| Comparison with Poisson distribution Blue bars denote a histogram of data divided into 1 sec bins. Red curve is a Poisson curve with rate = median count rate of data. |
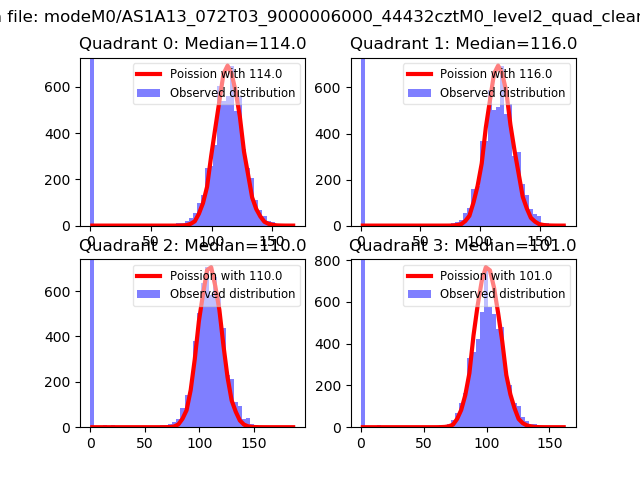 |
 |
| Quadrant-wise count rates Data is divided into 100 sec bins |
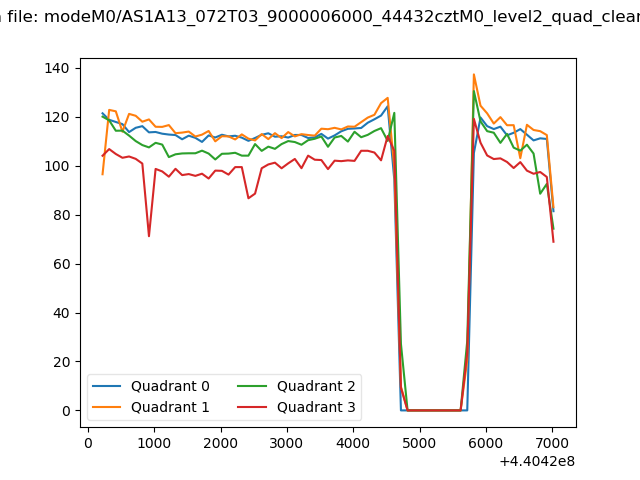 |
|
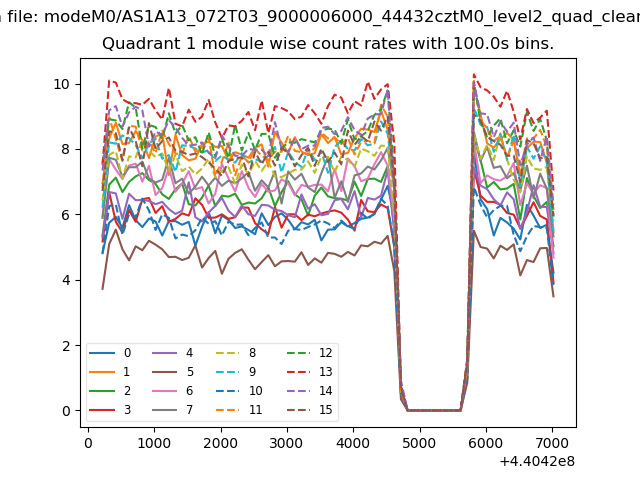
| Module-wise count rates for Quadrant A Data is divided into 100 sec bins |
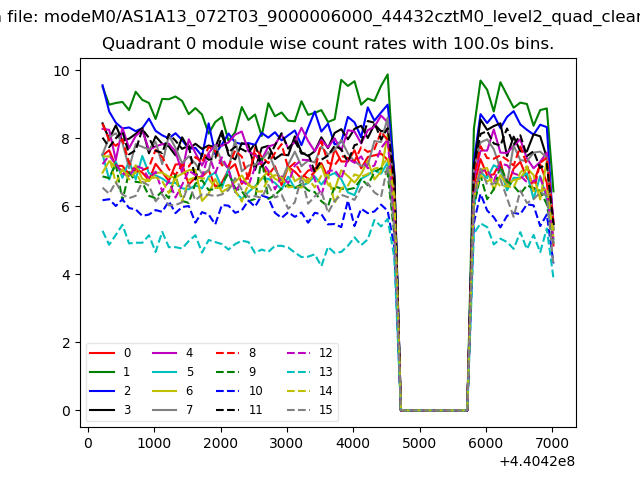 |
 |
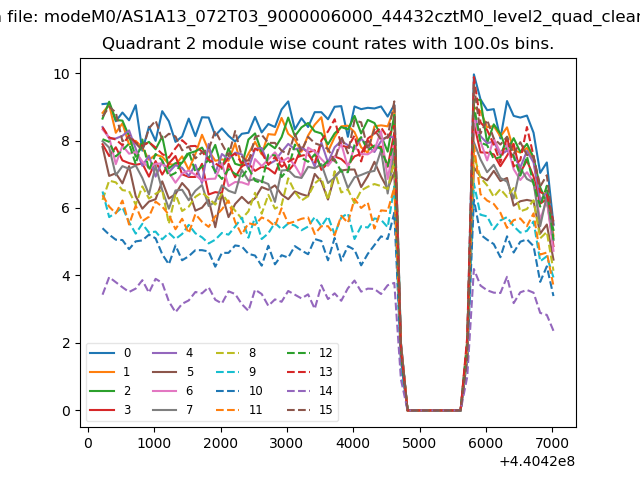
| Module-wise count rates for Quadrant B Data is divided into 100 sec bins |
 |
 |
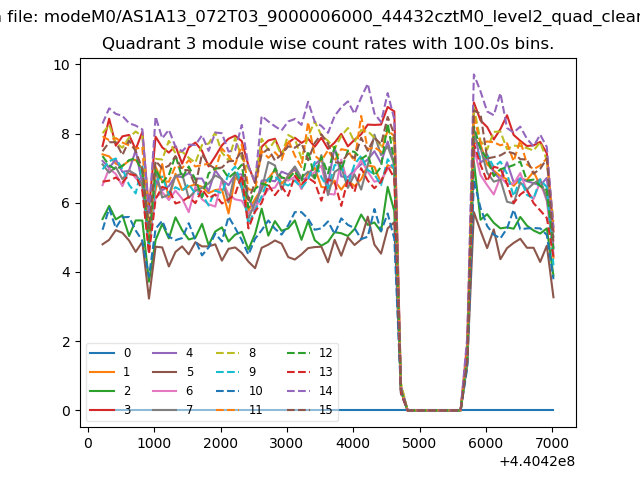
| Module-wise count rates for Quadrant C Data is divided into 100 sec bins |
 |
 |
| Module-wise count rates for Quadrant D Data is divided into 100 sec bins |
 |
 |
| Parameter | Plot |
|---|---|
| CZT HV Monitor | 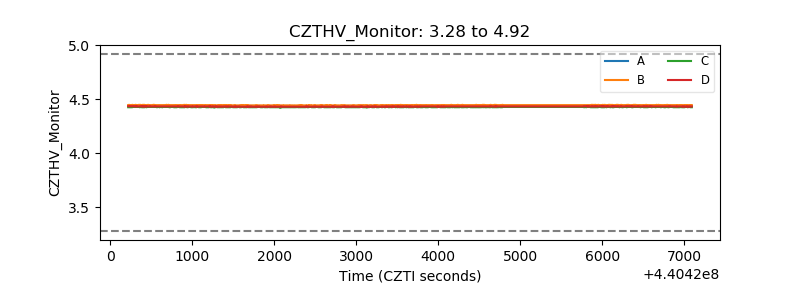 |
| D_VDD | 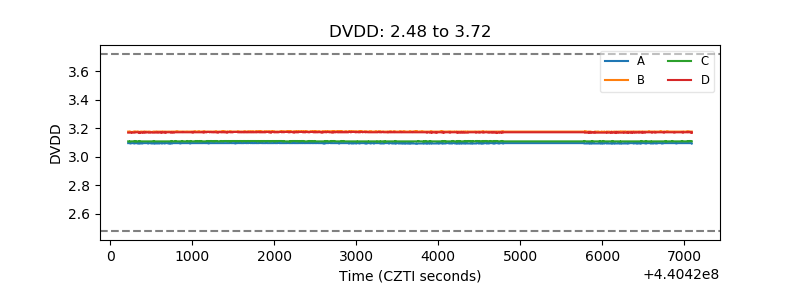 |
| Temperature 1 | 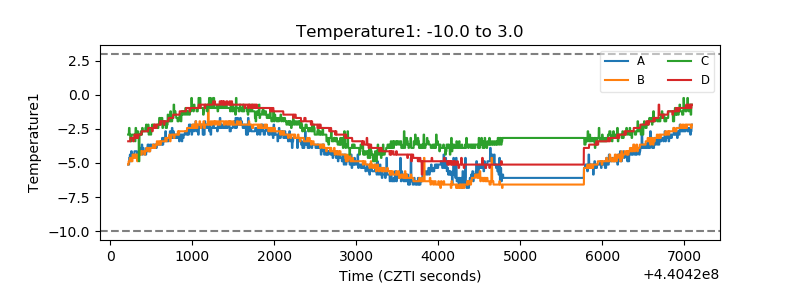 |
| Veto HV Monitor |  |
| Veto LLD | 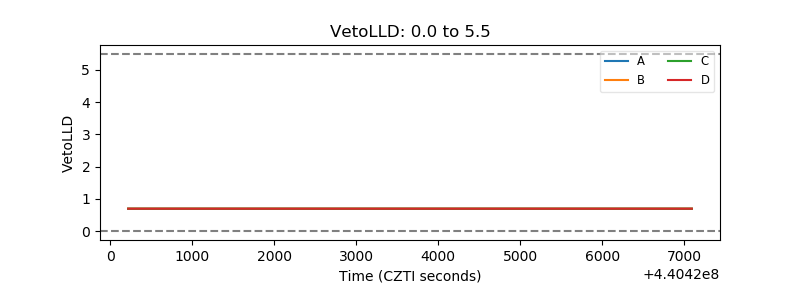 |
| Alpha Counter | 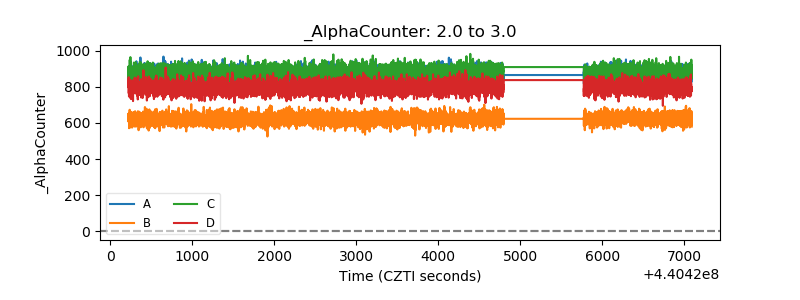 |
| _CPM_Rate | 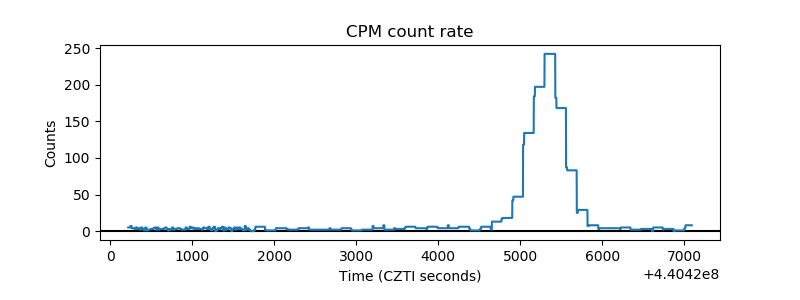 |
| CZT Counter | 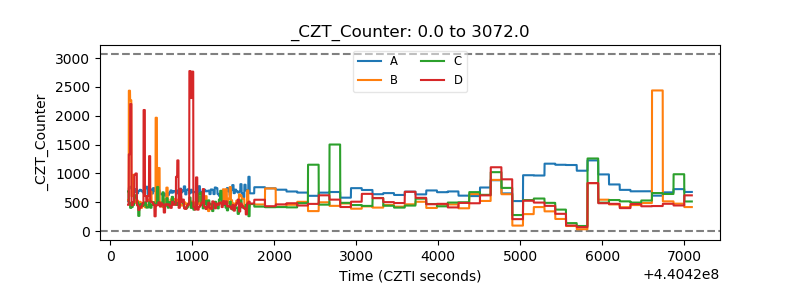 |
| +2.5 Volts monitor | 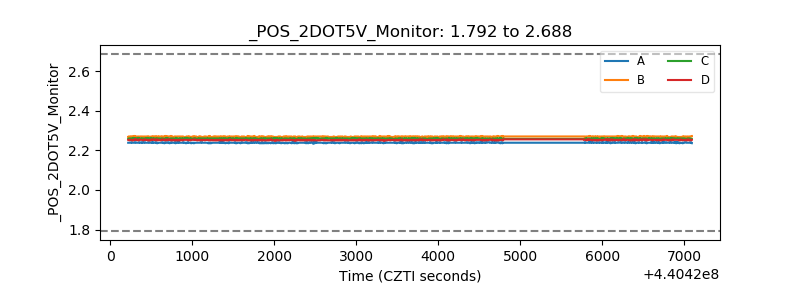 |
| +5 Volts monitor | 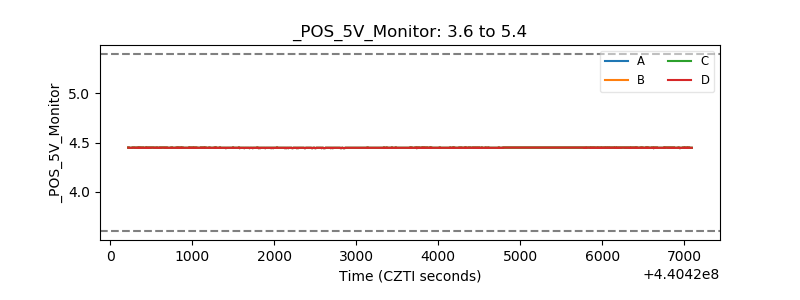 |
| _ROLL_ROT | 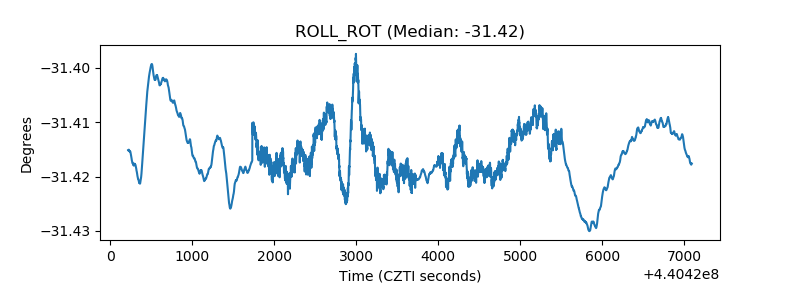 |
| _Roll_DEC | 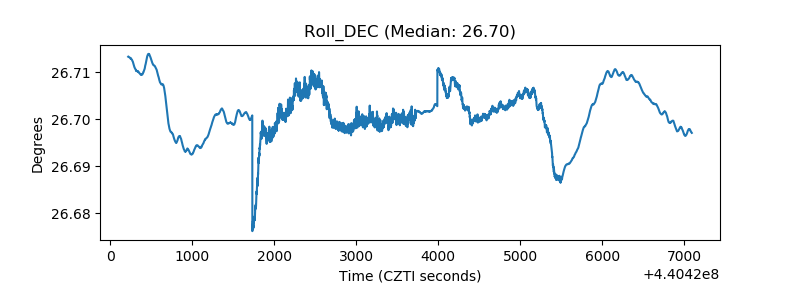 |
| _Roll_RA | 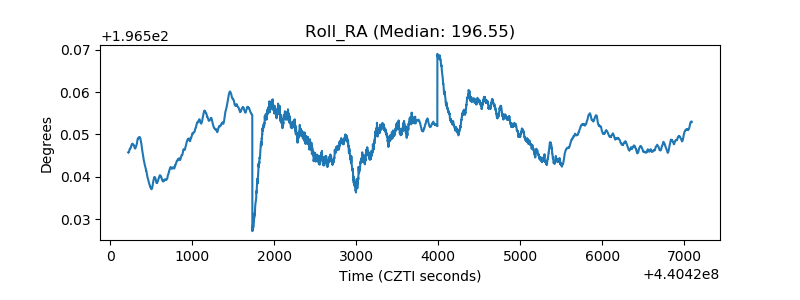 |
| Veto Counter | 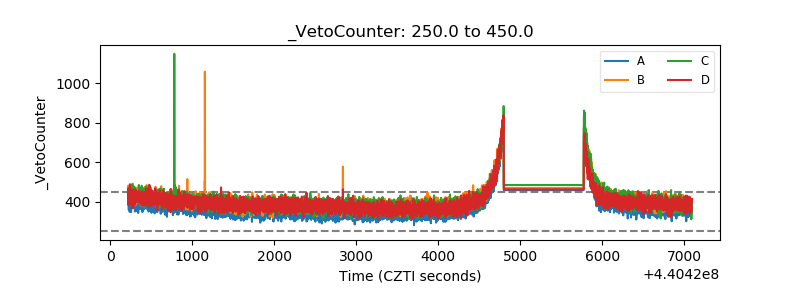 |