| Param | Original file | Final file |
|---|---|---|
| Filename | modeM0/AS1A13_072T03_9000006000_44433cztM0_level2.fits | modeM0/AS1A13_072T03_9000006000_44433cztM0_level2_quad_clean.evt |
| Size (bytes) | 495,103,680 | 112,011,840 |
| Size | 472.2 MB | 106.8 MB |
| Events in quadrant A | 5,030,608 | 749,058 |
| Events in quadrant B | 3,512,662 | 774,311 |
| Events in quadrant C | 4,497,839 | 730,345 |
| Events in quadrant D | 4,743,365 | 651,063 |
| Mode SS | |||
|---|---|---|---|
| Quadrant | BADHDUFLAG | Total packets | Discarded packets |
| A | 0 | 142 | 0 |
| B | 0 | 142 | 0 |
| C | 0 | 142 | 0 |
| D | 0 | 142 | 0 |
| Mode M9 | |||
|---|---|---|---|
| Quadrant | BADHDUFLAG | Total packets | Discarded packets |
| A | 0 | 8 | 0 |
| B | 0 | 9 | 0 |
| C | 0 | 9 | 0 |
| D | 0 | 9 | 0 |
| Mode M0 | |||
|---|---|---|---|
| Quadrant | BADHDUFLAG | Total packets | Discarded packets |
| A | 0 | 21103 | 2 |
| B | 0 | 15024 | 2 |
| C | 0 | 18014 | 2 |
| D | 0 | 18833 | 2 |
| Quadrant | Total seconds | Saturated seconds | Saturation percentage |
|---|---|---|---|
| A | 6987 | 256 | 3.663947% |
| B | 6987 | 229 | 3.277515% |
| C | 6987 | 275 | 3.935881% |
| D | 6987 | 479 | 6.855589% |
Noise dominated data is calculated using 1-second bins in cleaned event files. If a bin has >2000 counts, and if more than 50% of those come from <1% of pixels, then it is considered to be noise-dominated and hence unusable.
| Quadrant | # 1 sec bins | Bins with >0 counts | Bins with >2000 counts | High rate bins dominated by noise | Noise dominated (total time) | Noise dominated (detector-on time) | Marked lightcurve |
|---|---|---|---|---|---|---|---|
| A | 7717 | 6989 | 2 | 2 | 0.03% | 0.03% | 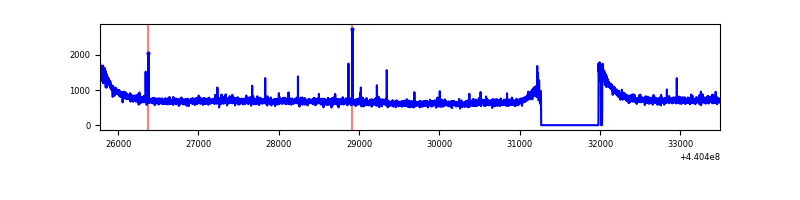 |
| B | 7717 | 6989 | 25 | 25 | 0.32% | 0.36% | 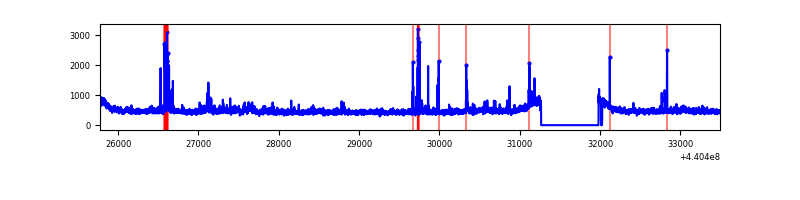 |
| C | 7717 | 6989 | 104 | 104 | 1.35% | 1.49% | 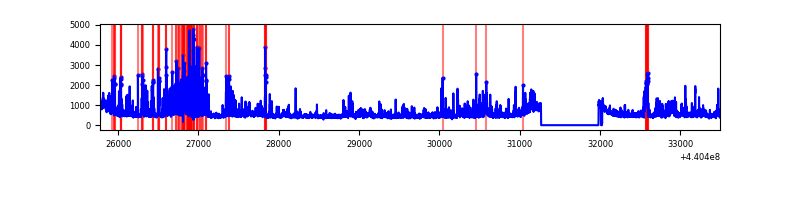 |
| D | 7717 | 6989 | 274 | 274 | 3.55% | 3.92% | 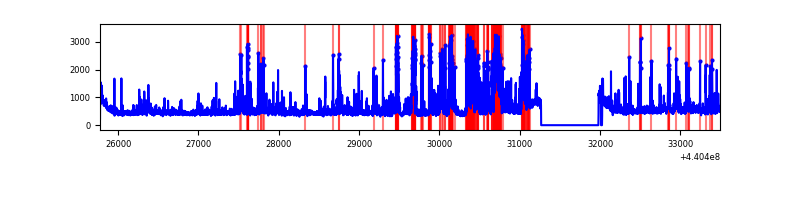 |
Top three noisy pixels from each quadrant. If the there are fewer than three noisy pixels in the level2.evt file, extra rows are filled as -1
| Pixel properties | Quadrant properties | ||||||
|---|---|---|---|---|---|---|---|
| Quadrant | DetID | PixID | Counts | Sigma | Mean | Median | Sigma |
| A | 10 | 83 | 1866405 | 11167.57 | 808 | 789 | 167.1 |
| A | 10 | 248 | 18032 | 103.22 | 808 | 789 | 167.1 |
| A | 7 | 3 | 13679 | 77.16 | 808 | 789 | 167.1 |
| B | 5 | 172 | 85294 | 525.5 | 806 | 780 | 160.8 |
| B | 0 | 155 | 81629 | 502.72 | 806 | 780 | 160.8 |
| B | 0 | 229 | 66965 | 411.54 | 806 | 780 | 160.8 |
| C | 3 | 233 | 617992 | 3301.13 | 792 | 797 | 187.0 |
| C | 15 | 208 | 569226 | 3040.3 | 792 | 797 | 187.0 |
| C | 2 | 14 | 110020 | 584.19 | 792 | 797 | 187.0 |
| D | 4 | 221 | 891286 | 4480.0 | 786 | 760 | 198.8 |
| D | 2 | 249 | 163054 | 816.46 | 786 | 760 | 198.8 |
| D | 13 | 249 | 135551 | 678.1 | 786 | 760 | 198.8 |
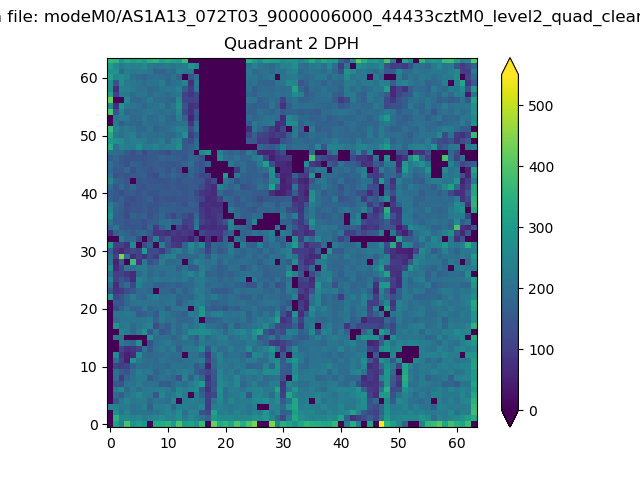
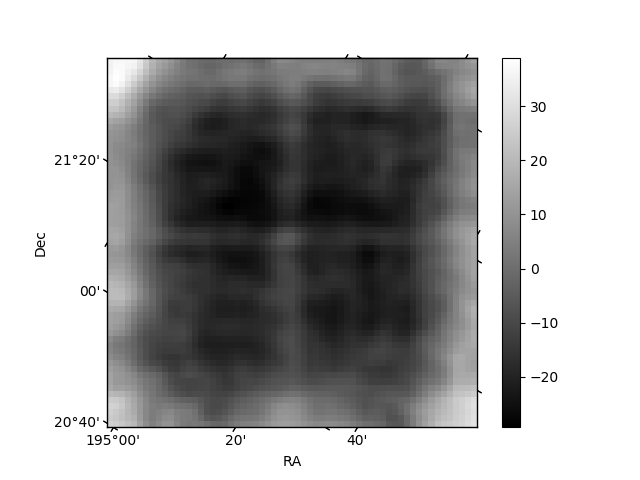
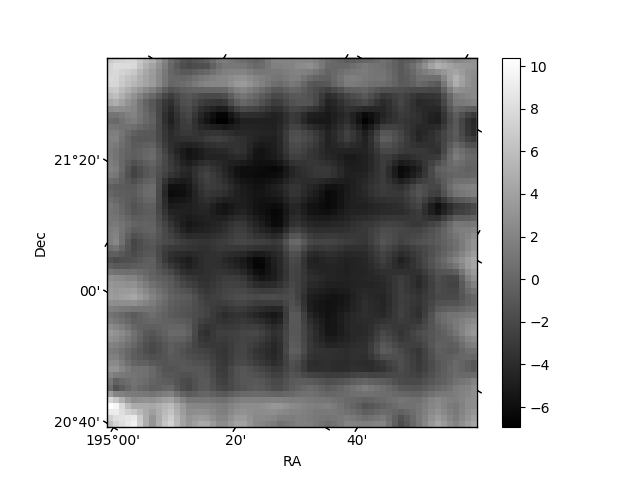
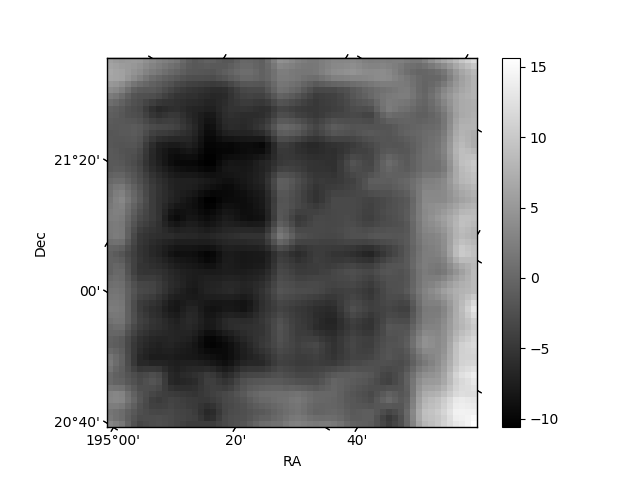
Histogram calculated using DETX and DETY for each event in the final _common_clean file
| Quadrant A | 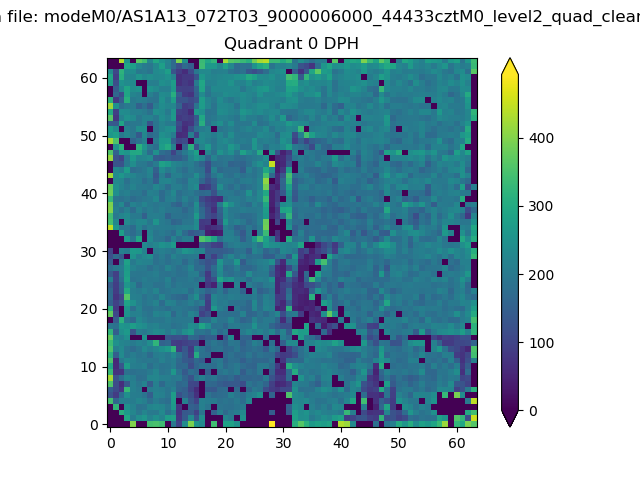 |
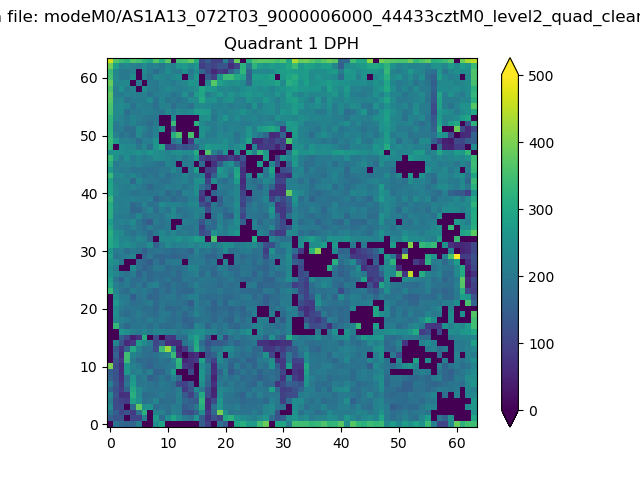 |
Quadrant B |
|---|---|---|---|
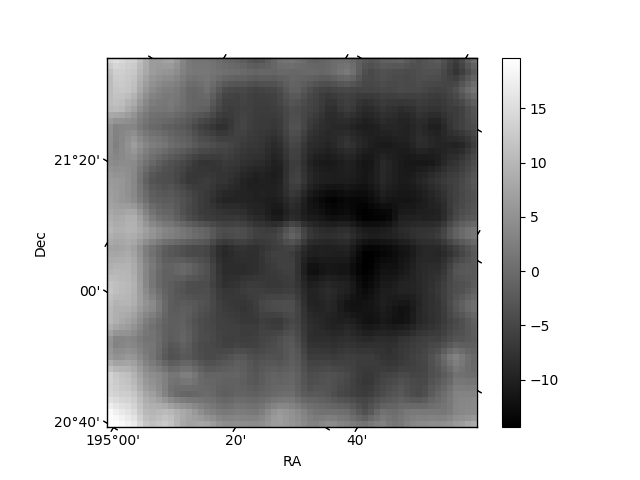
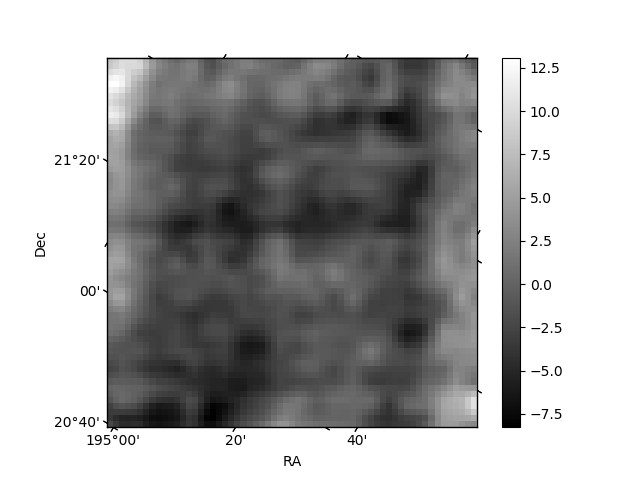
| Quadrant D | 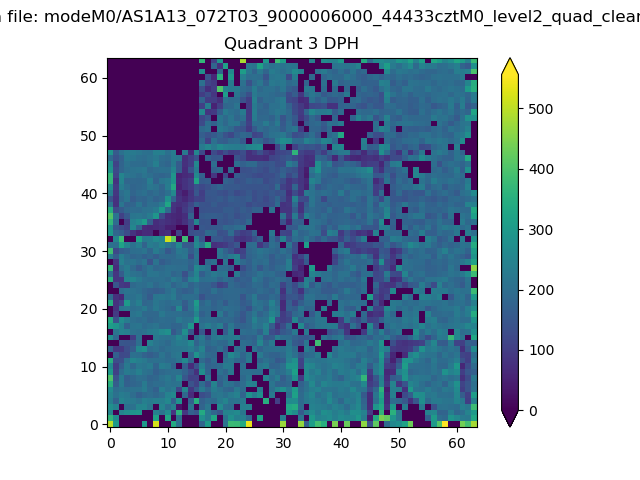 |
 |
Quadrant C |
| Plot type | Count rate plots | Images |
|---|---|---|
| Comparison with Poisson distribution Blue bars denote a histogram of data divided into 1 sec bins. Red curve is a Poisson curve with rate = median count rate of data. |
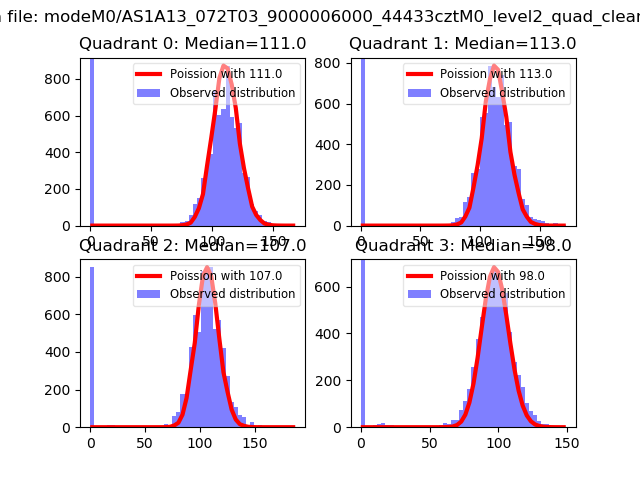 |
 |
| Quadrant-wise count rates Data is divided into 100 sec bins |
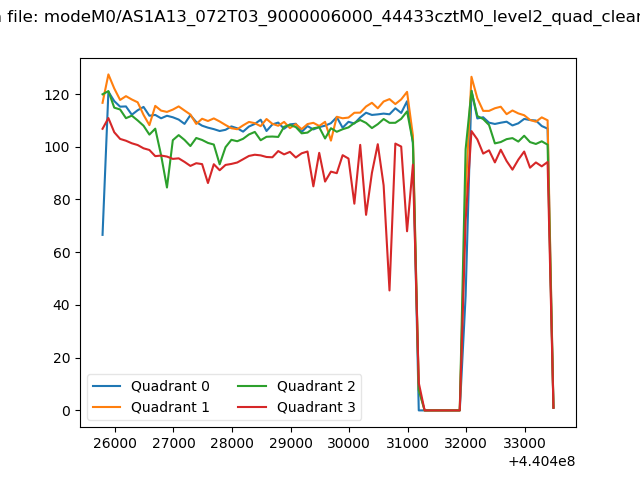 |
|
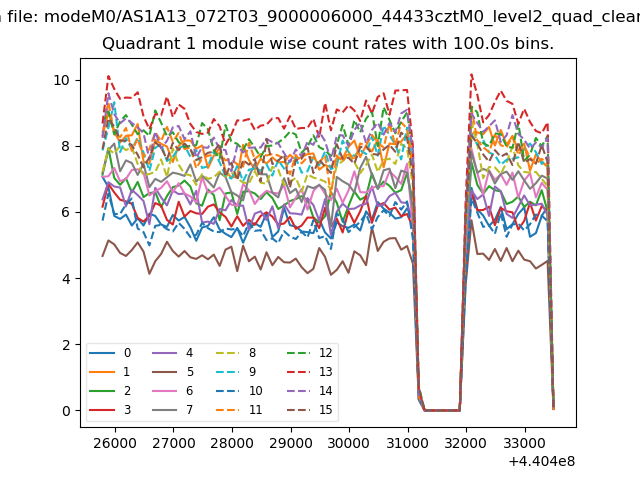
| Module-wise count rates for Quadrant A Data is divided into 100 sec bins |
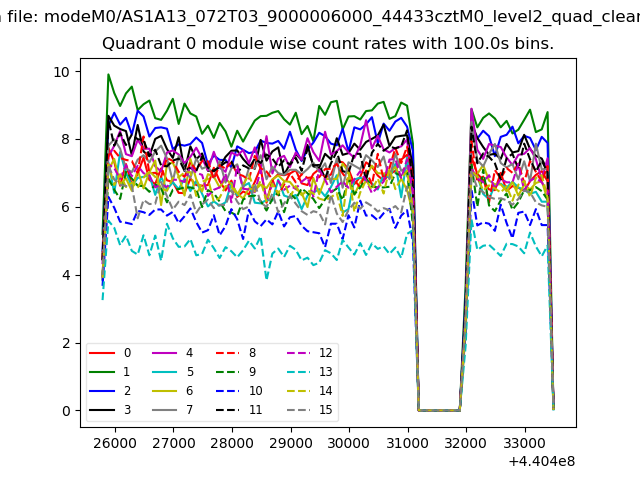 |
 |
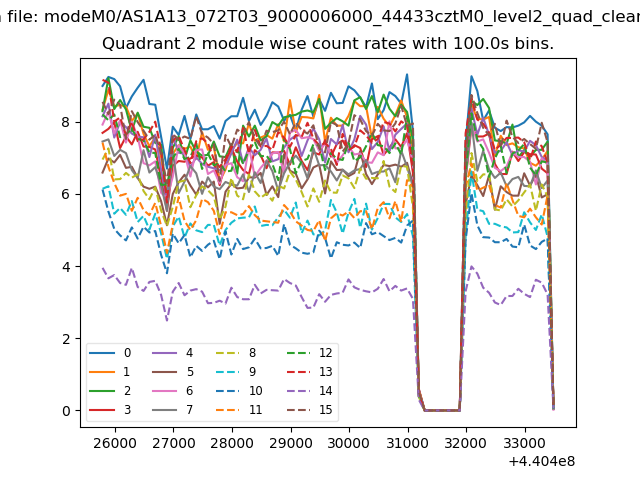
| Module-wise count rates for Quadrant B Data is divided into 100 sec bins |
 |
 |
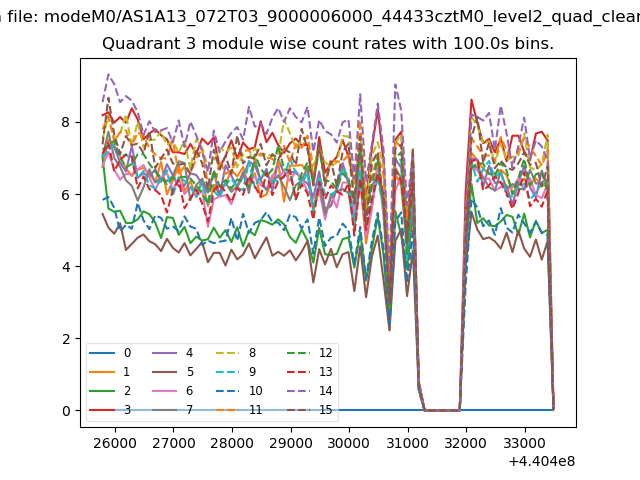
| Module-wise count rates for Quadrant C Data is divided into 100 sec bins |
 |
 |
| Module-wise count rates for Quadrant D Data is divided into 100 sec bins |
 |
 |
| Parameter | Plot |
|---|---|
| CZT HV Monitor | 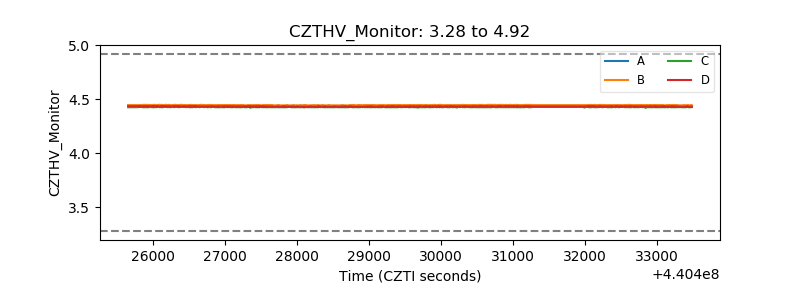 |
| D_VDD | 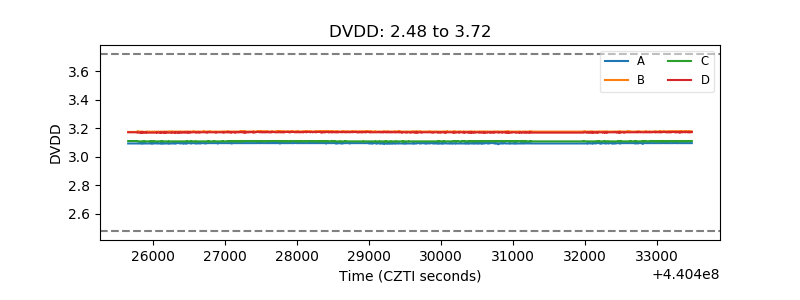 |
| Temperature 1 | 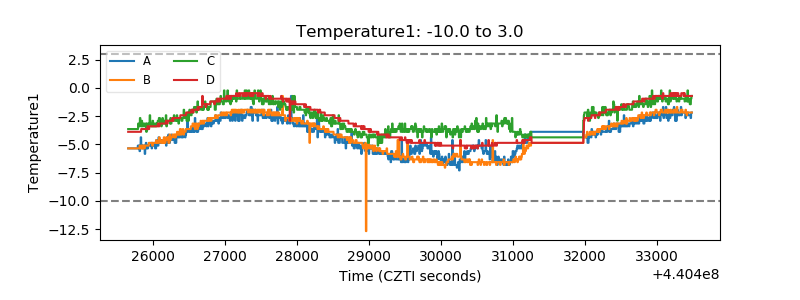 |
| Veto HV Monitor | 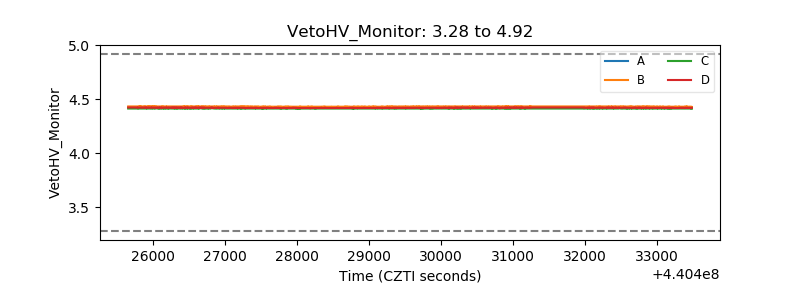 |
| Veto LLD | 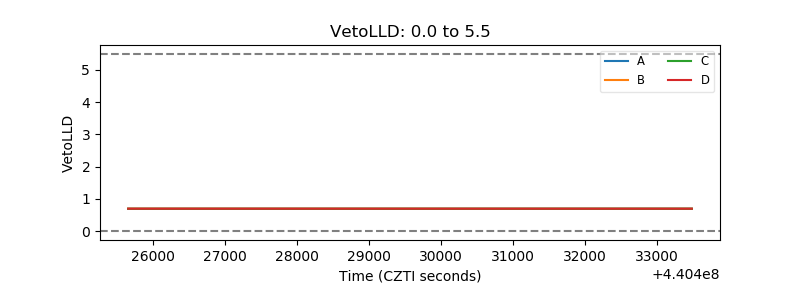 |
| Alpha Counter | 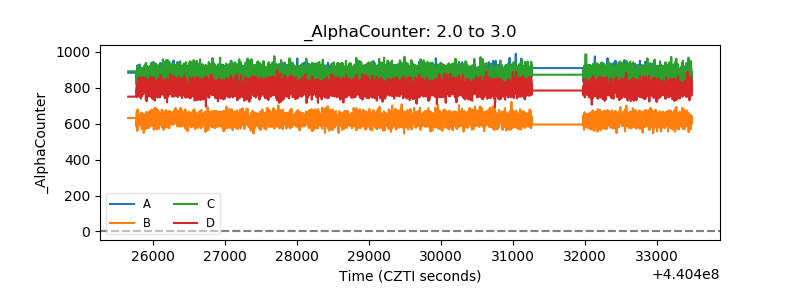 |
| _CPM_Rate | 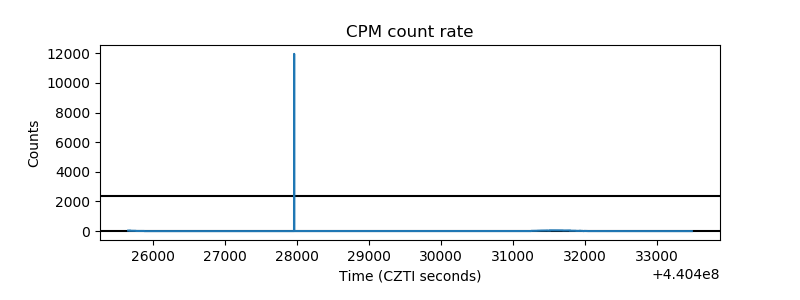 |
| CZT Counter | 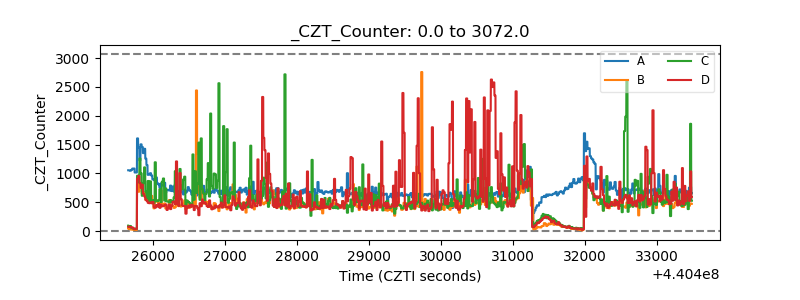 |
| +2.5 Volts monitor | 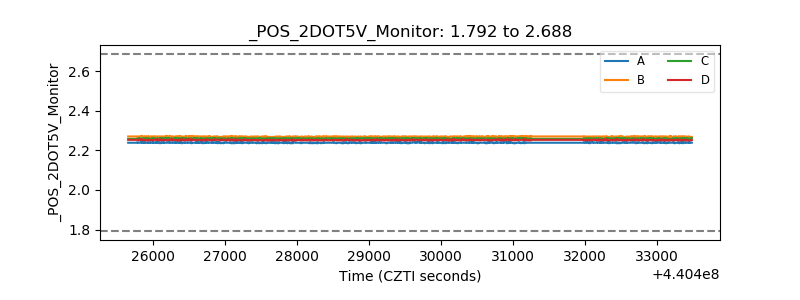 |
| +5 Volts monitor | 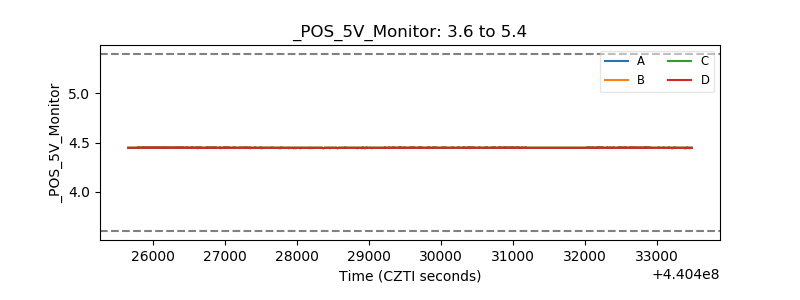 |
| _ROLL_ROT | 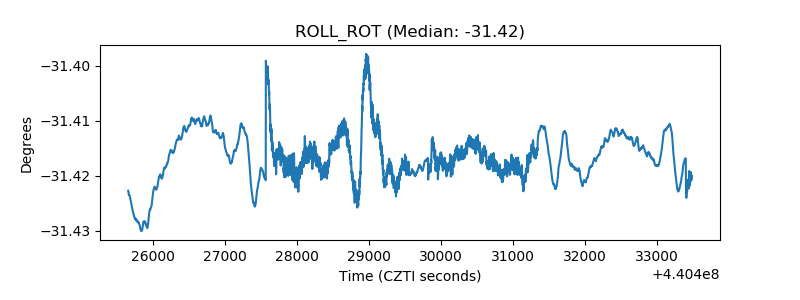 |
| _Roll_DEC | 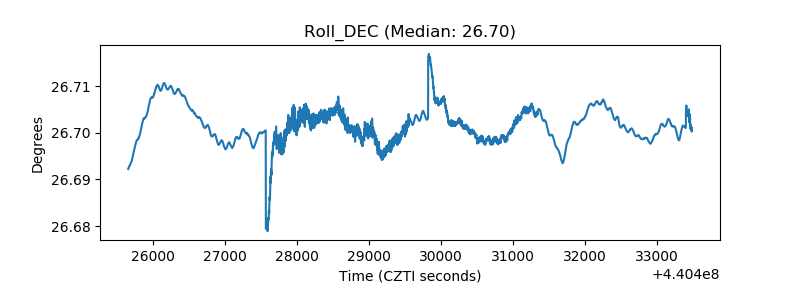 |
| _Roll_RA | 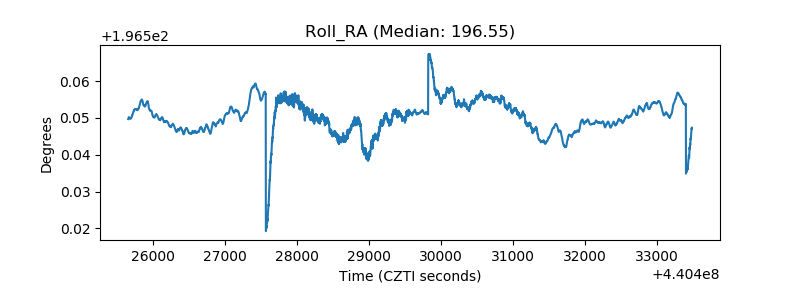 |
| Veto Counter | 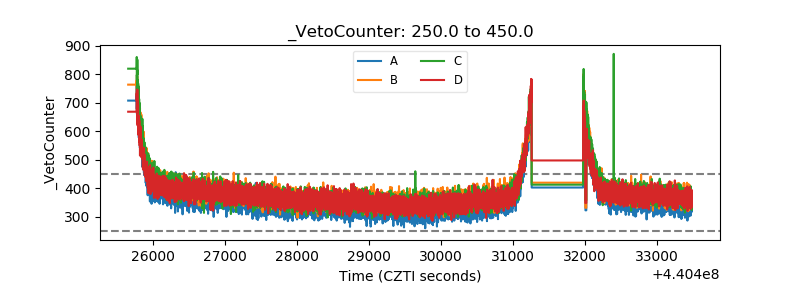 |