| Param | Original file | Final file |
|---|---|---|
| Filename | modeM0/AS1A13_072T03_9000006000_44435cztM0_level2.fits | modeM0/AS1A13_072T03_9000006000_44435cztM0_level2_quad_clean.evt |
| Size (bytes) | 561,985,920 | 115,787,520 |
| Size | 536.0 MB | 110.4 MB |
| Events in quadrant A | 5,029,082 | 790,472 |
| Events in quadrant B | 3,835,742 | 802,275 |
| Events in quadrant C | 4,988,465 | 753,062 |
| Events in quadrant D | 6,379,354 | 648,344 |
| Mode SS | |||
|---|---|---|---|
| Quadrant | BADHDUFLAG | Total packets | Discarded packets |
| A | 0 | 146 | 0 |
| B | 0 | 146 | 0 |
| C | 0 | 146 | 0 |
| D | 0 | 146 | 0 |
| Mode M0 | |||
|---|---|---|---|
| Quadrant | BADHDUFLAG | Total packets | Discarded packets |
| A | 0 | 21126 | 0 |
| B | 0 | 16452 | 0 |
| C | 0 | 19792 | 0 |
| D | 0 | 23997 | 0 |
| Quadrant | Total seconds | Saturated seconds | Saturation percentage |
|---|---|---|---|
| A | 7355 | 87 | 1.182869% |
| B | 7355 | 137 | 1.862678% |
| C | 7354 | 232 | 3.154746% |
| D | 7354 | 754 | 10.252924% |
Noise dominated data is calculated using 1-second bins in cleaned event files. If a bin has >2000 counts, and if more than 50% of those come from <1% of pixels, then it is considered to be noise-dominated and hence unusable.
| Quadrant | # 1 sec bins | Bins with >0 counts | Bins with >2000 counts | High rate bins dominated by noise | Noise dominated (total time) | Noise dominated (detector-on time) | Marked lightcurve |
|---|---|---|---|---|---|---|---|
| A | 7355 | 7355 | 3 | 3 | 0.04% | 0.04% | 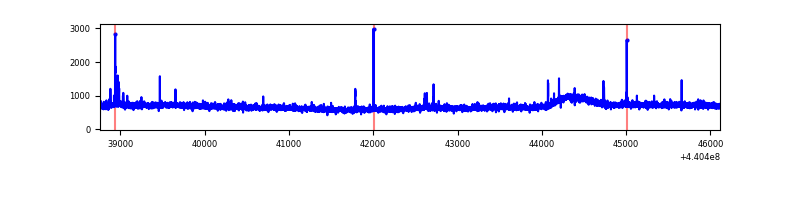 |
| B | 7355 | 7355 | 13 | 13 | 0.18% | 0.18% | 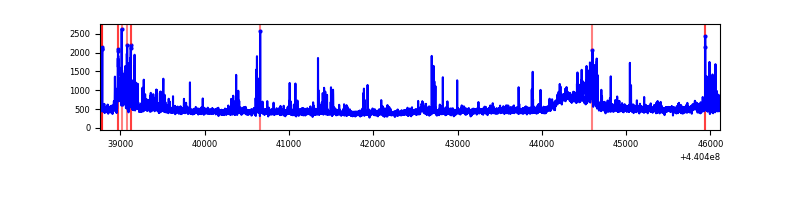 |
| C | 7354 | 7354 | 134 | 134 | 1.82% | 1.82% | 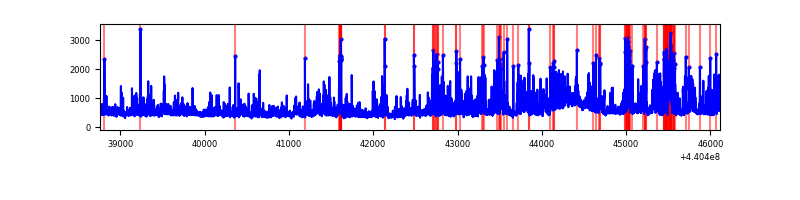 |
| D | 7354 | 7354 | 657 | 657 | 8.93% | 8.93% | 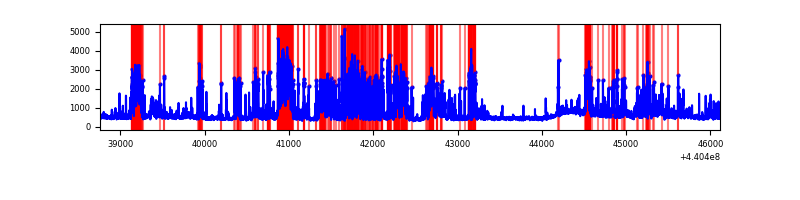 |
Top three noisy pixels from each quadrant. If the there are fewer than three noisy pixels in the level2.evt file, extra rows are filled as -1
| Pixel properties | Quadrant properties | ||||||
|---|---|---|---|---|---|---|---|
| Quadrant | DetID | PixID | Counts | Sigma | Mean | Median | Sigma |
| A | 10 | 83 | 1719928 | 9682.04 | 842 | 825 | 177.6 |
| A | 10 | 248 | 52564 | 291.4 | 842 | 825 | 177.6 |
| A | 3 | 137 | 9836 | 50.75 | 842 | 825 | 177.6 |
| B | 4 | 170 | 353821 | 2122.61 | 834 | 808 | 166.3 |
| B | 0 | 229 | 84209 | 501.48 | 834 | 808 | 166.3 |
| B | 0 | 155 | 40577 | 239.13 | 834 | 808 | 166.3 |
| C | 3 | 233 | 1567936 | 8173.46 | 814 | 819 | 191.7 |
| C | 14 | 254 | 110866 | 573.96 | 814 | 819 | 191.7 |
| C | 2 | 14 | 51391 | 263.76 | 814 | 819 | 191.7 |
| D | 4 | 221 | 889194 | 4450.28 | 792 | 765 | 199.6 |
| D | 5 | 235 | 828747 | 4147.49 | 792 | 765 | 199.6 |
| D | 8 | 129 | 415154 | 2075.74 | 792 | 765 | 199.6 |
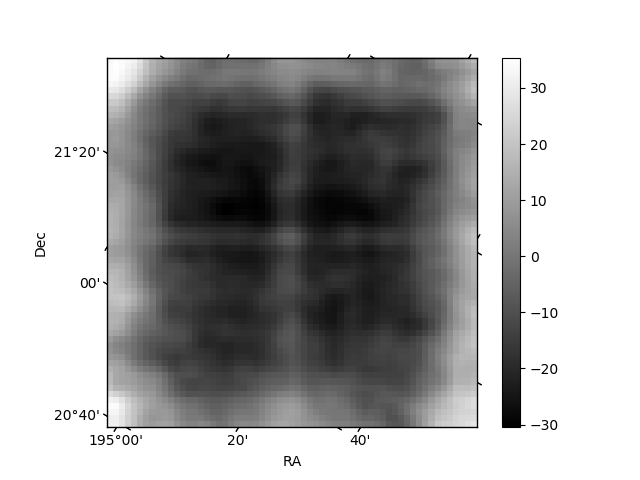
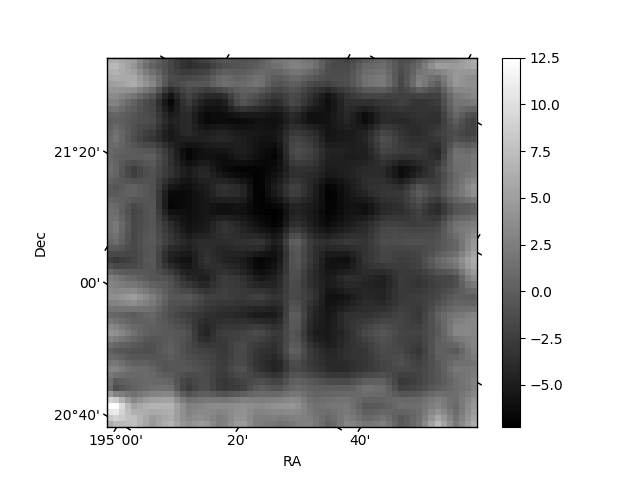
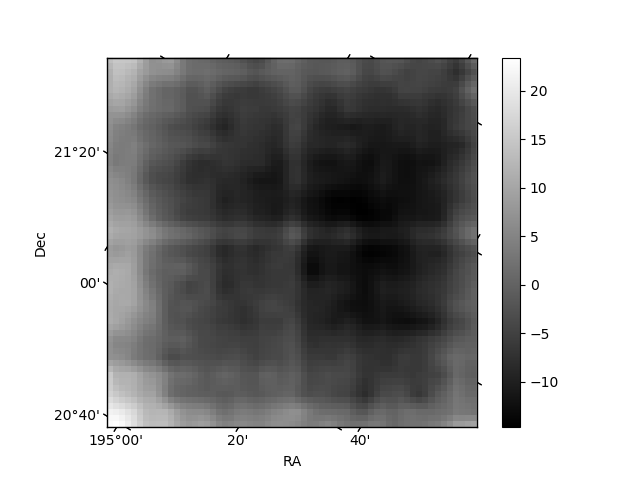
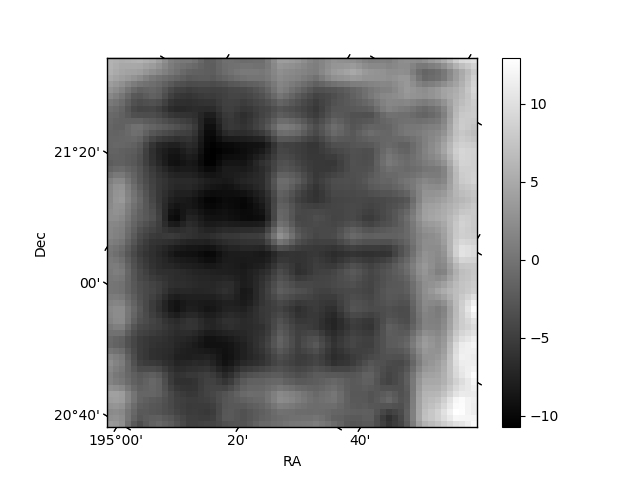
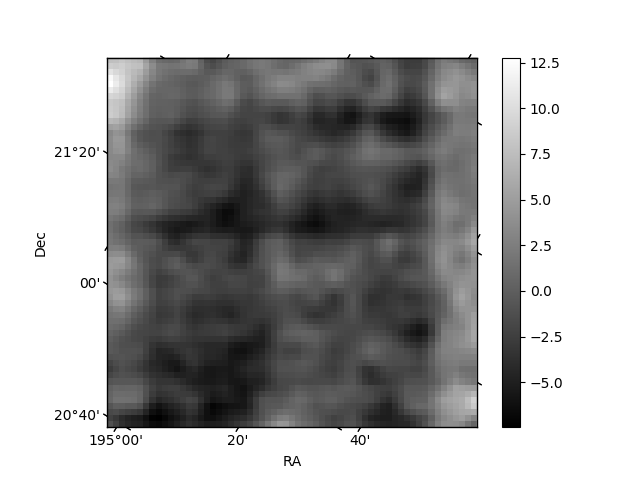
Histogram calculated using DETX and DETY for each event in the final _common_clean file
| Quadrant A | 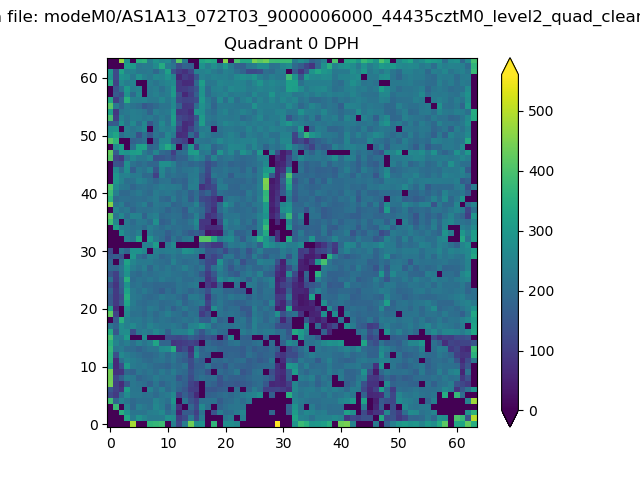 |
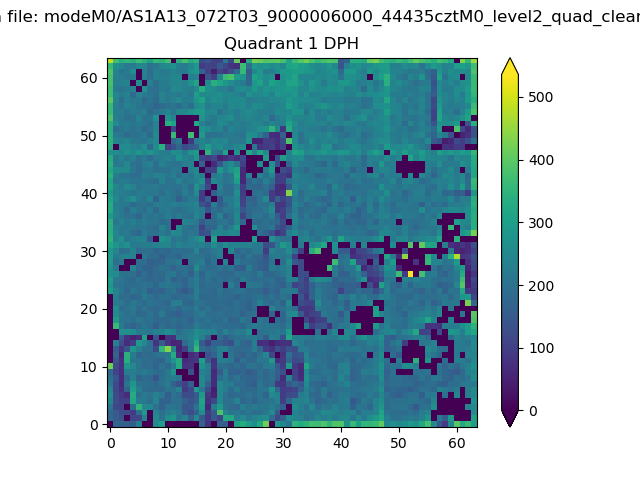 |
Quadrant B |
|---|---|---|---|
| Quadrant D | 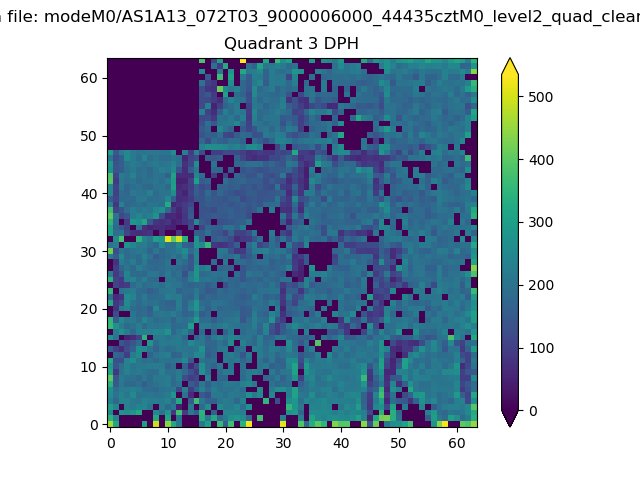 |
 |
Quadrant C |
| Plot type | Count rate plots | Images |
|---|---|---|
| Comparison with Poisson distribution Blue bars denote a histogram of data divided into 1 sec bins. Red curve is a Poisson curve with rate = median count rate of data. |
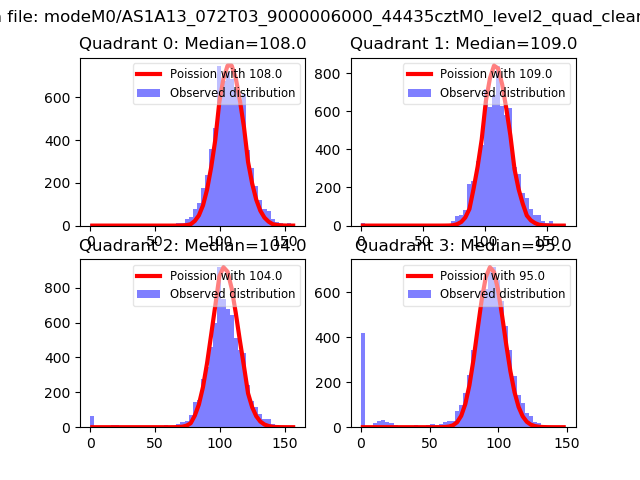 |
 |
| Quadrant-wise count rates Data is divided into 100 sec bins |
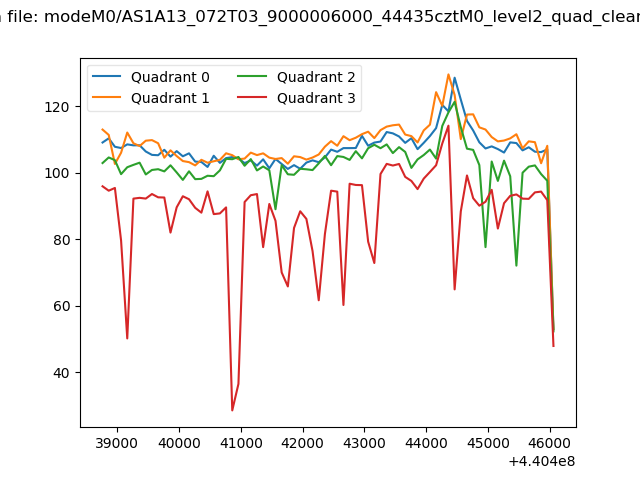 |
|
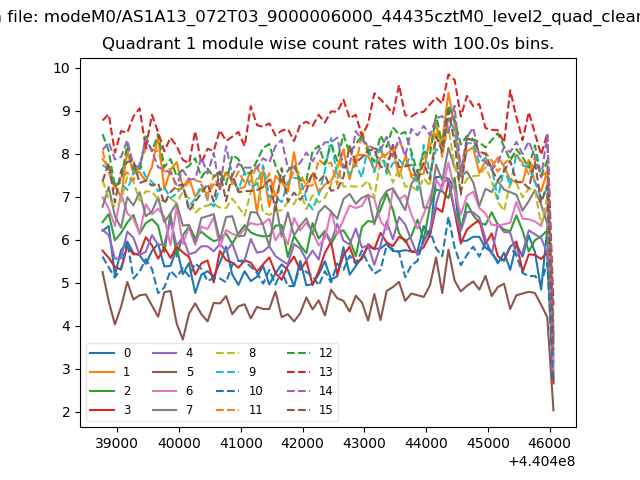
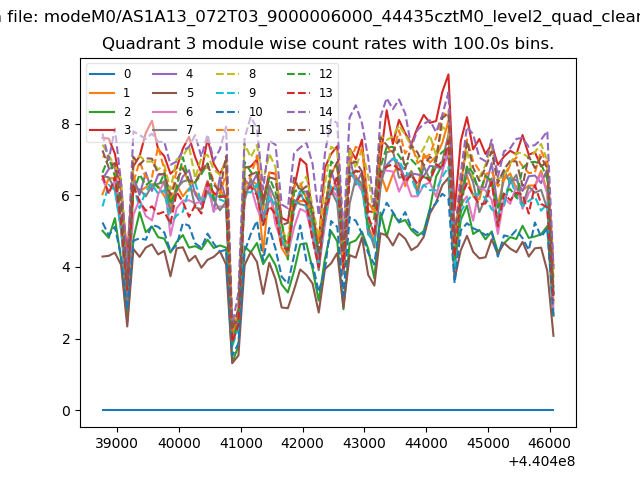
| Module-wise count rates for Quadrant A Data is divided into 100 sec bins |
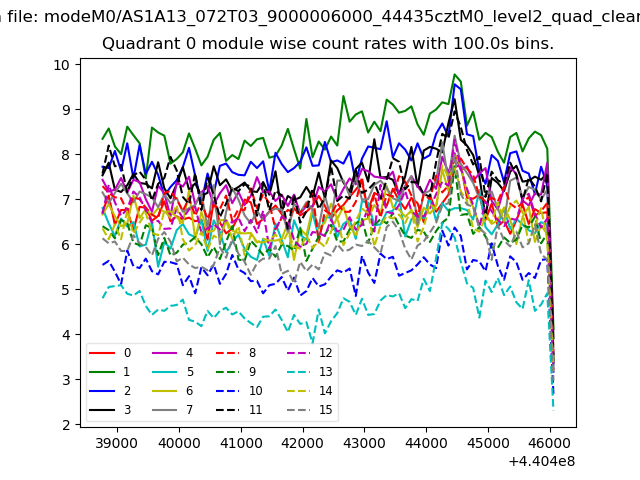 |
 |
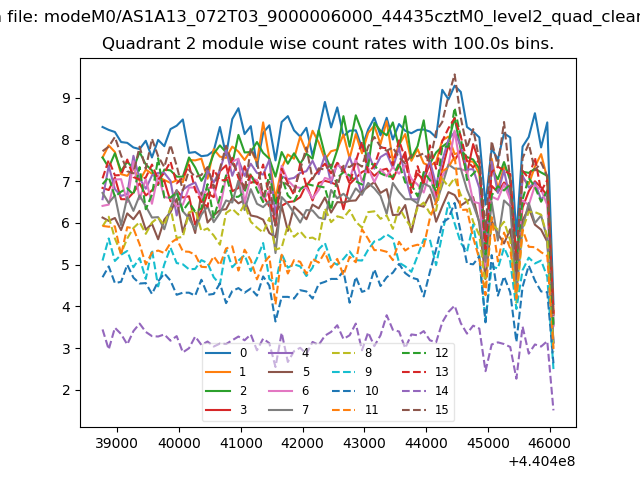
| Module-wise count rates for Quadrant B Data is divided into 100 sec bins |
 |
 |
| Module-wise count rates for Quadrant C Data is divided into 100 sec bins |
 |
 |
| Module-wise count rates for Quadrant D Data is divided into 100 sec bins |
 |
 |
| Parameter | Plot |
|---|---|
| CZT HV Monitor | 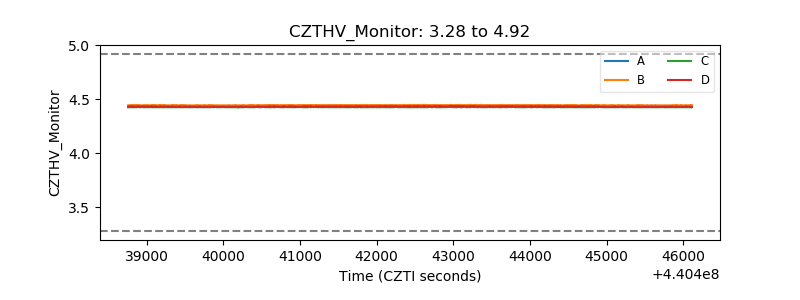 |
| D_VDD | 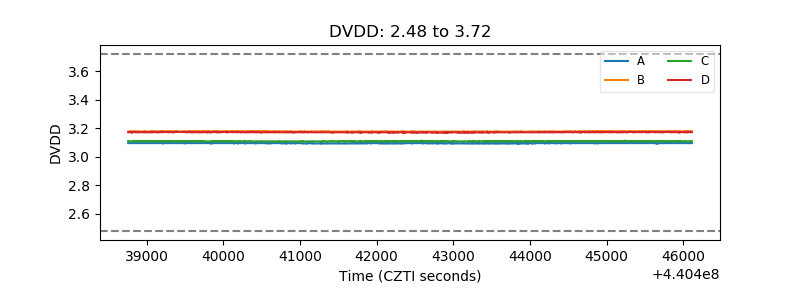 |
| Temperature 1 | 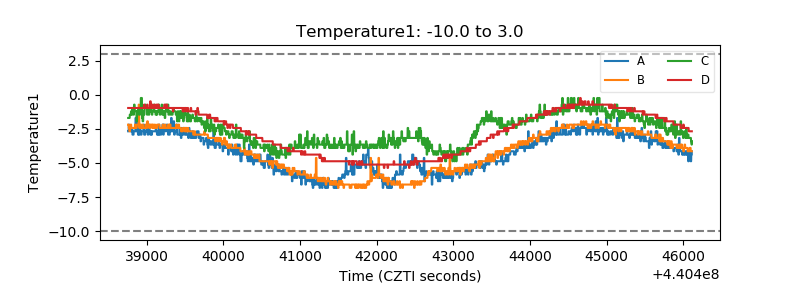 |
| Veto HV Monitor | 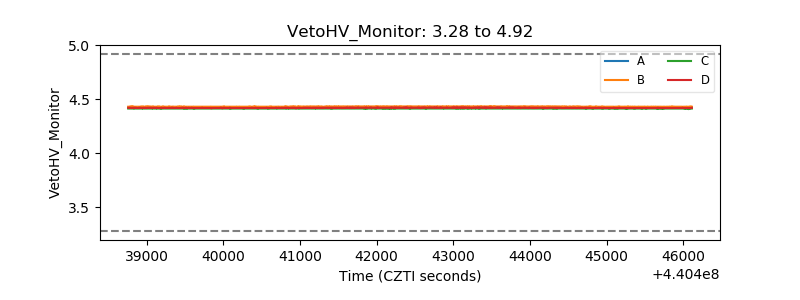 |
| Veto LLD | 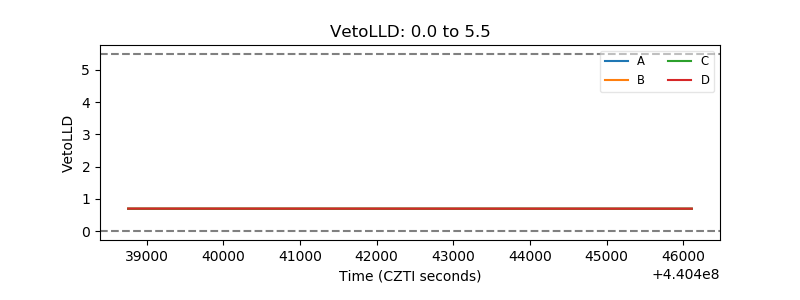 |
| Alpha Counter | 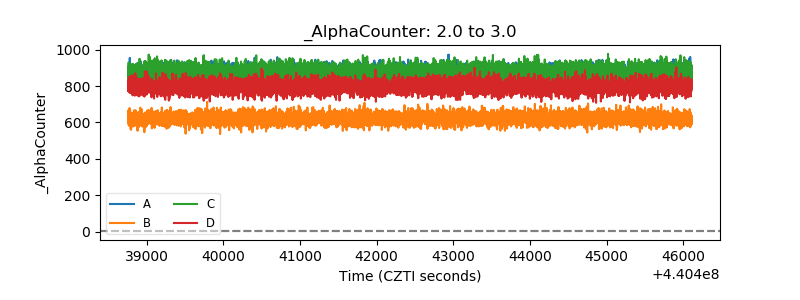 |
| _CPM_Rate | 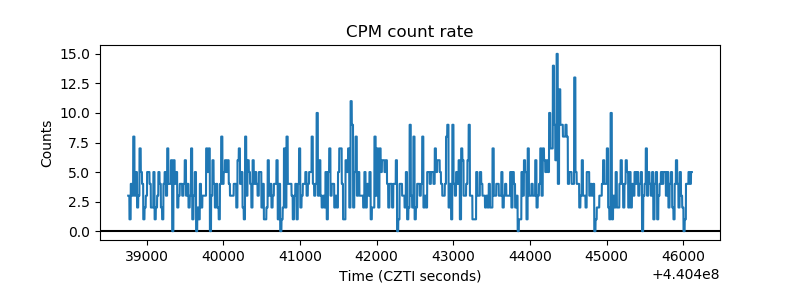 |
| CZT Counter | 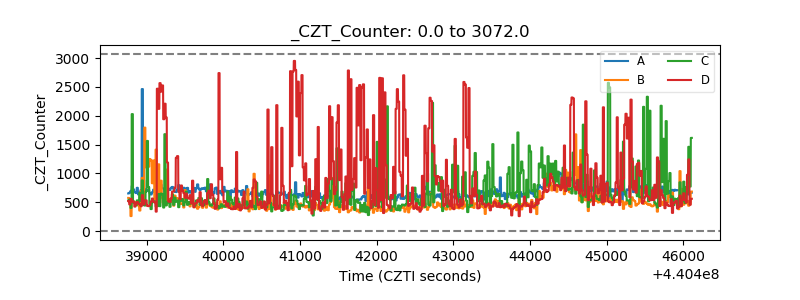 |
| +2.5 Volts monitor | 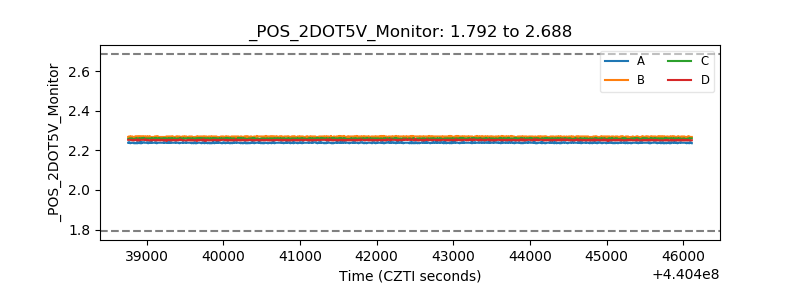 |
| +5 Volts monitor | 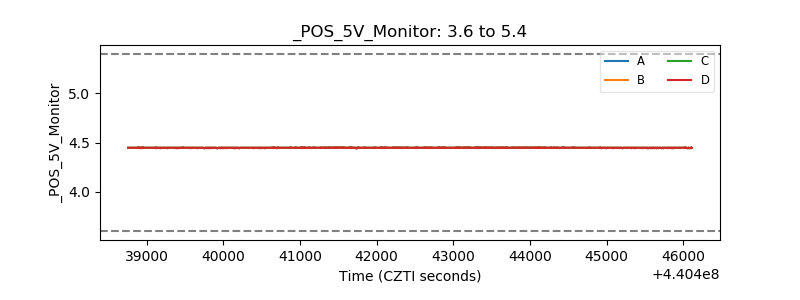 |
| _ROLL_ROT | 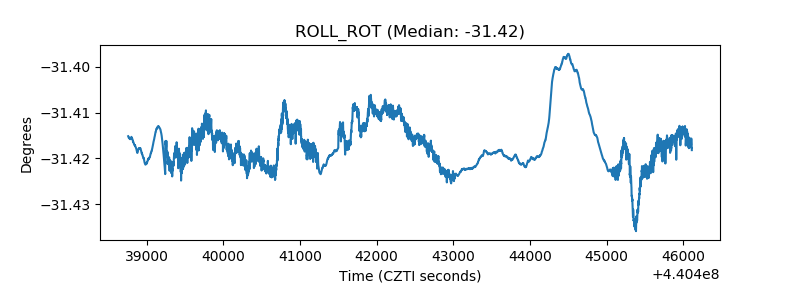 |
| _Roll_DEC | 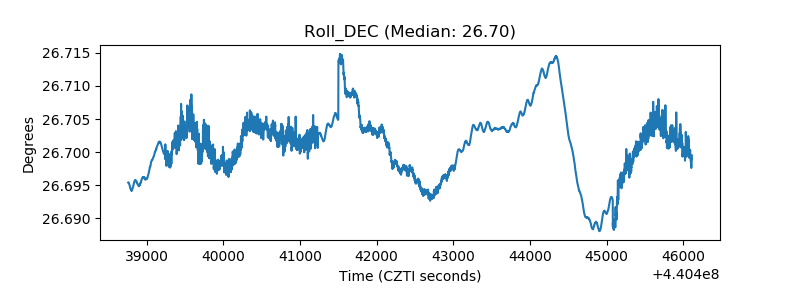 |
| _Roll_RA | 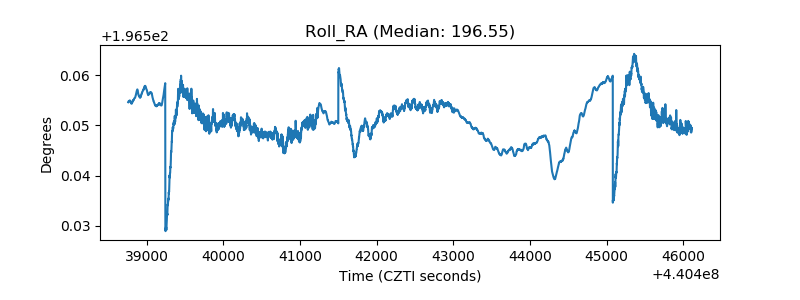 |
| Veto Counter | 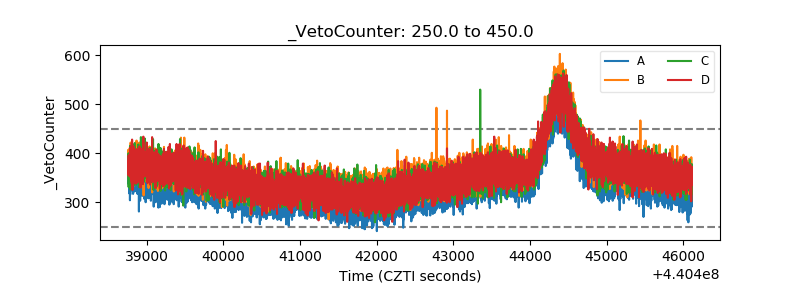 |