| Param | Original file | Final file |
|---|---|---|
| Filename | modeM0/AS1A13_072T03_9000006000_44445cztM0_level2.fits | modeM0/AS1A13_072T03_9000006000_44445cztM0_level2_quad_clean.evt |
| Size (bytes) | 385,773,120 | 97,269,120 |
| Size | 367.9 MB | 92.8 MB |
| Events in quadrant A | 4,106,940 | 656,479 |
| Events in quadrant B | 2,787,713 | 682,051 |
| Events in quadrant C | 2,795,118 | 643,603 |
| Events in quadrant D | 4,150,040 | 567,466 |
| Mode SS | |||
|---|---|---|---|
| Quadrant | BADHDUFLAG | Total packets | Discarded packets |
| A | 0 | 114 | 0 |
| B | 0 | 114 | 0 |
| C | 0 | 114 | 0 |
| D | 0 | 114 | 0 |
| Mode M9 | |||
|---|---|---|---|
| Quadrant | BADHDUFLAG | Total packets | Discarded packets |
| A | 0 | 12 | 0 |
| B | 0 | 12 | 0 |
| C | 0 | 12 | 0 |
| D | 0 | 12 | 0 |
| Mode M0 | |||
|---|---|---|---|
| Quadrant | BADHDUFLAG | Total packets | Discarded packets |
| A | 0 | 17290 | 1 |
| B | 0 | 11990 | 1 |
| C | 0 | 12135 | 1 |
| D | 0 | 16193 | 1 |
| Quadrant | Total seconds | Saturated seconds | Saturation percentage |
|---|---|---|---|
| A | 5662 | 107 | 1.889792% |
| B | 5662 | 75 | 1.324620% |
| C | 5662 | 40 | 0.706464% |
| D | 5662 | 326 | 5.757683% |
Noise dominated data is calculated using 1-second bins in cleaned event files. If a bin has >2000 counts, and if more than 50% of those come from <1% of pixels, then it is considered to be noise-dominated and hence unusable.
| Quadrant | # 1 sec bins | Bins with >0 counts | Bins with >2000 counts | High rate bins dominated by noise | Noise dominated (total time) | Noise dominated (detector-on time) | Marked lightcurve |
|---|---|---|---|---|---|---|---|
| A | 6857 | 5664 | 5 | 5 | 0.07% | 0.09% | 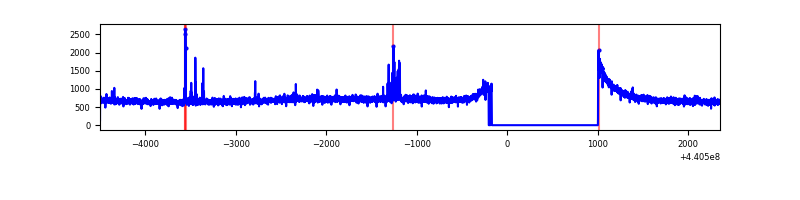 |
| B | 6857 | 5664 | 9 | 9 | 0.13% | 0.16% | 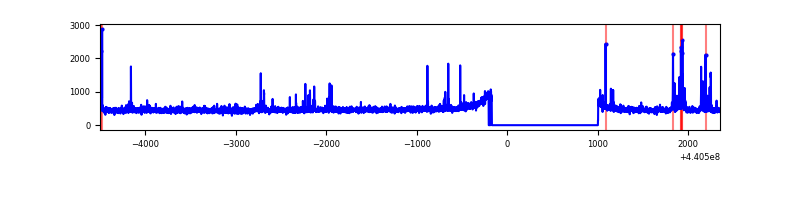 |
| C | 6857 | 5664 | 18 | 18 | 0.26% | 0.32% | 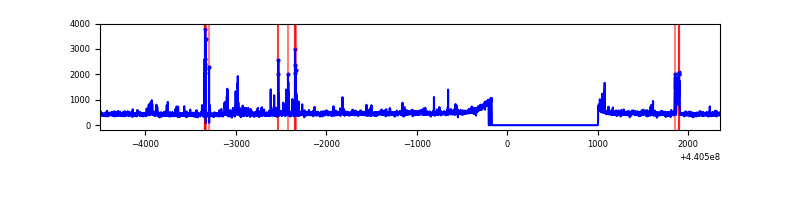 |
| D | 6857 | 5664 | 249 | 249 | 3.63% | 4.40% | 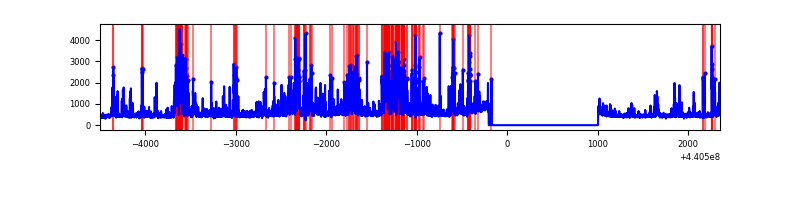 |
Top three noisy pixels from each quadrant. If the there are fewer than three noisy pixels in the level2.evt file, extra rows are filled as -1
| Pixel properties | Quadrant properties | ||||||
|---|---|---|---|---|---|---|---|
| Quadrant | DetID | PixID | Counts | Sigma | Mean | Median | Sigma |
| A | 10 | 83 | 1461539 | 10619.98 | 664 | 651 | 137.6 |
| A | 10 | 248 | 54760 | 393.35 | 664 | 651 | 137.6 |
| A | 13 | 252 | 12267 | 84.44 | 664 | 651 | 137.6 |
| B | 5 | 172 | 79477 | 614.23 | 659 | 639 | 128.4 |
| B | 0 | 168 | 54205 | 417.34 | 659 | 639 | 128.4 |
| B | 0 | 229 | 20189 | 152.32 | 659 | 639 | 128.4 |
| C | 14 | 254 | 117028 | 760.53 | 648 | 652 | 153.0 |
| C | 2 | 14 | 69537 | 450.17 | 648 | 652 | 153.0 |
| C | 12 | 16 | 62870 | 406.6 | 648 | 652 | 153.0 |
| D | 2 | 249 | 572489 | 3563.46 | 637 | 617 | 160.5 |
| D | 13 | 249 | 491728 | 3060.22 | 637 | 617 | 160.5 |
| D | 1 | 52 | 191539 | 1189.68 | 637 | 617 | 160.5 |
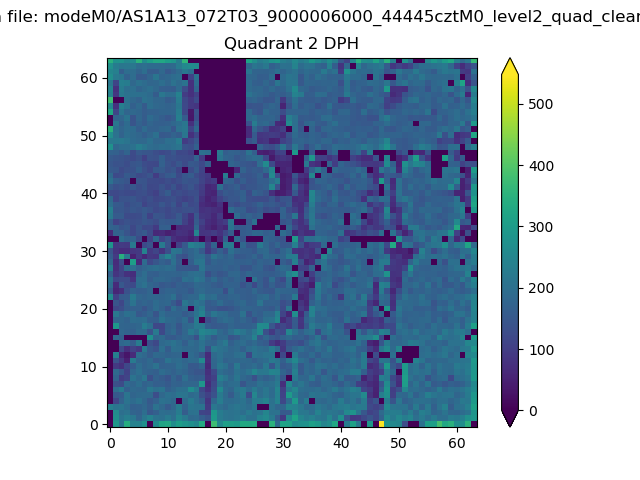
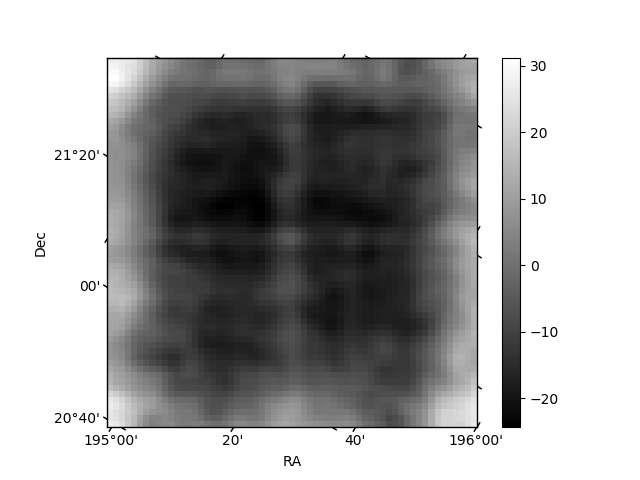
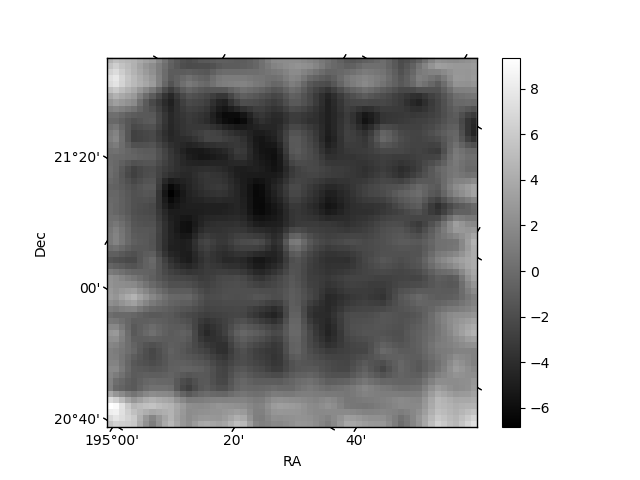
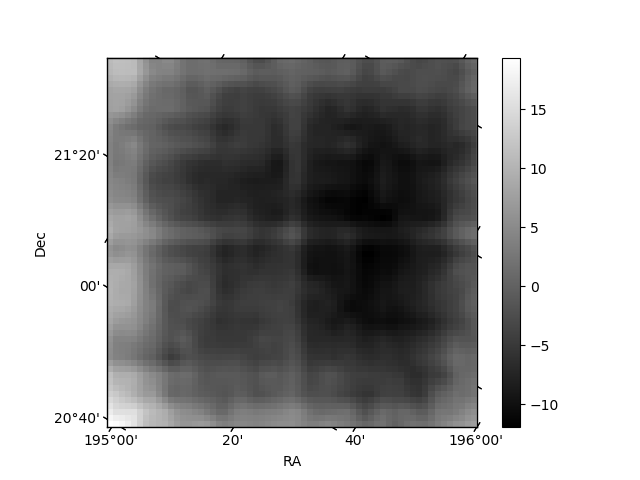
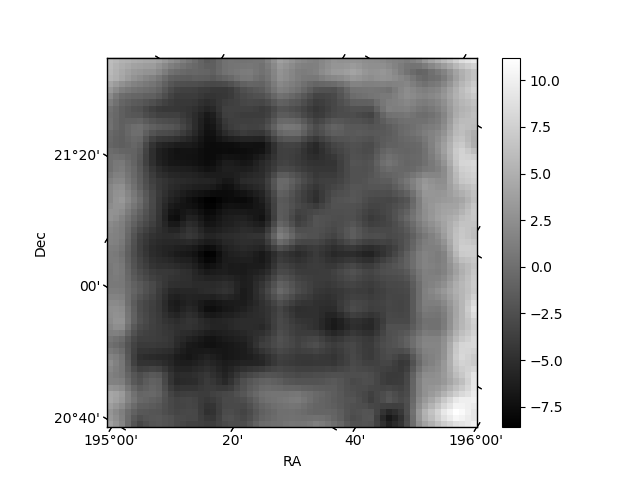
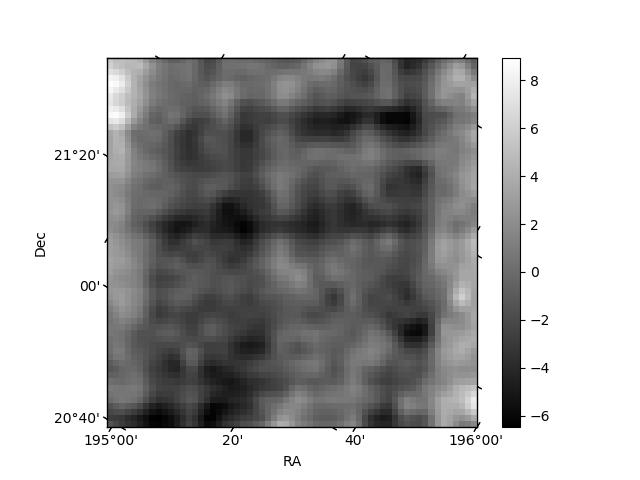
Histogram calculated using DETX and DETY for each event in the final _common_clean file
| Quadrant A | 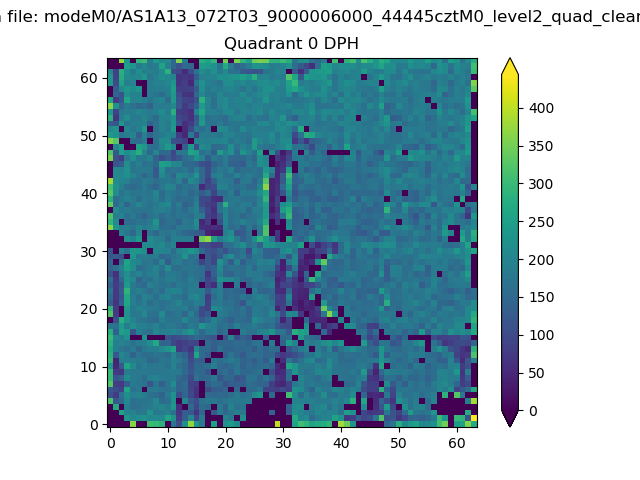 |
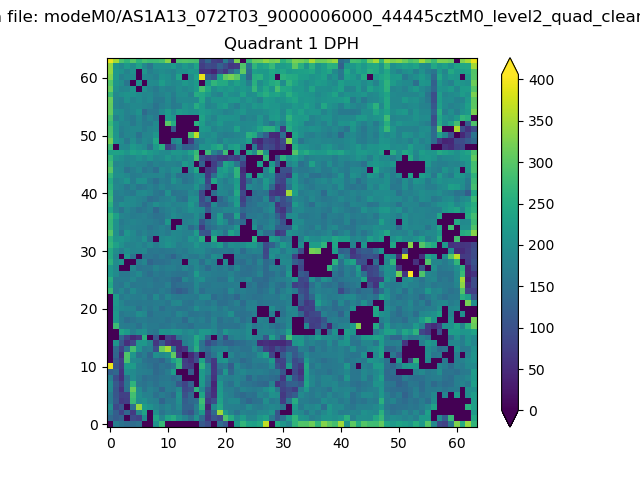 |
Quadrant B |
|---|---|---|---|
| Quadrant D | 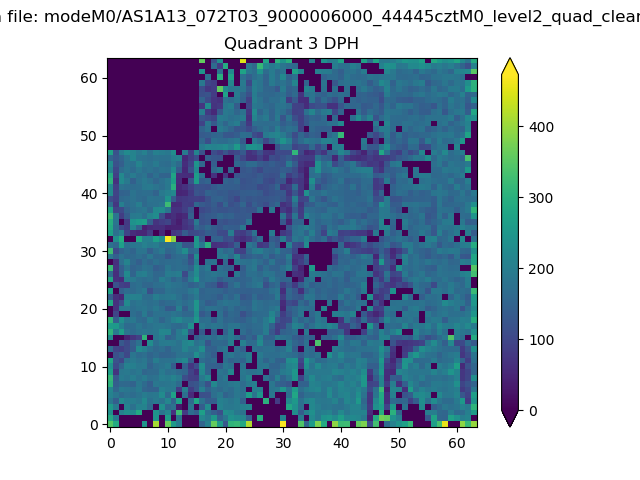 |
 |
Quadrant C |
| Plot type | Count rate plots | Images |
|---|---|---|
| Comparison with Poisson distribution Blue bars denote a histogram of data divided into 1 sec bins. Red curve is a Poisson curve with rate = median count rate of data. |
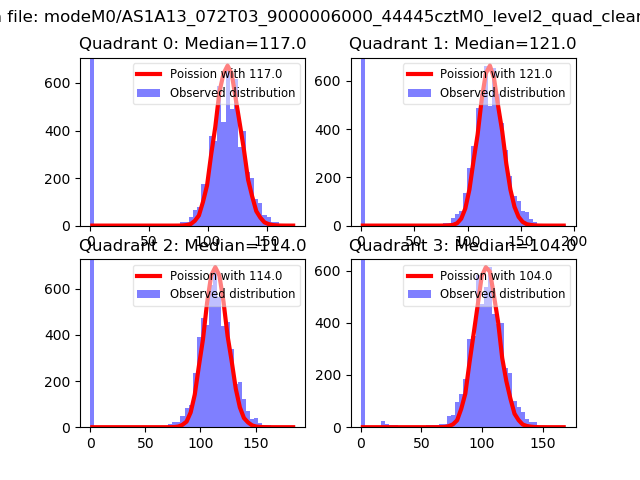 |
 |
| Quadrant-wise count rates Data is divided into 100 sec bins |
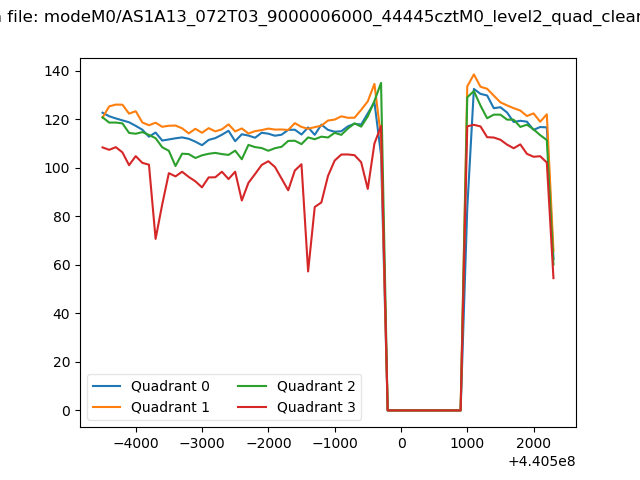 |
|
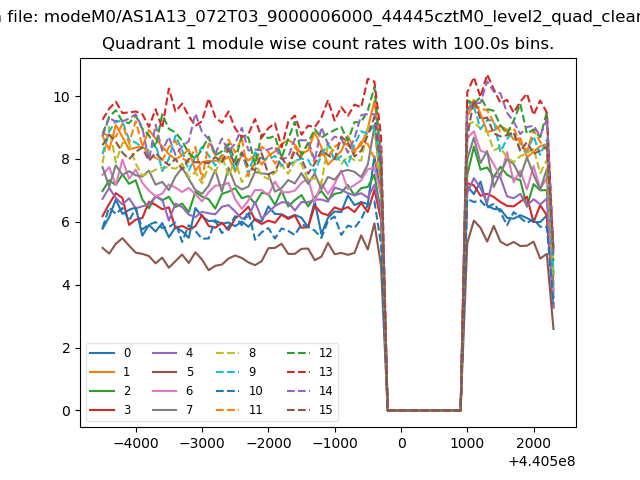
| Module-wise count rates for Quadrant A Data is divided into 100 sec bins |
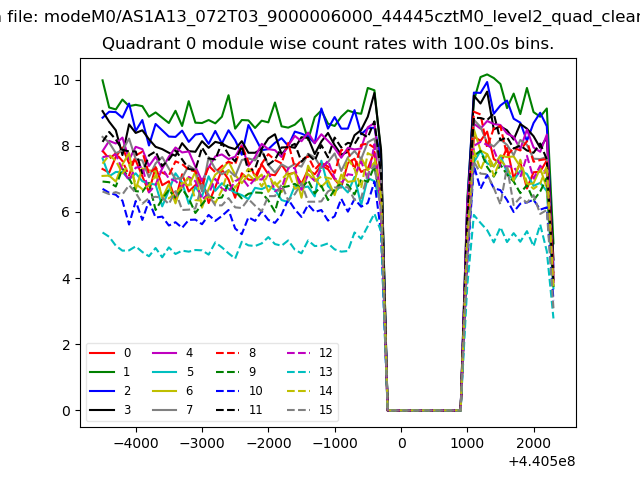 |
 |
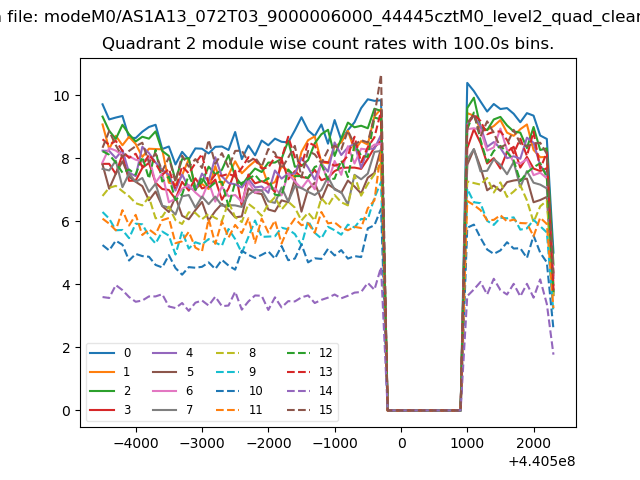
| Module-wise count rates for Quadrant B Data is divided into 100 sec bins |
 |
 |
| Module-wise count rates for Quadrant C Data is divided into 100 sec bins |
 |
 |
| Module-wise count rates for Quadrant D Data is divided into 100 sec bins |
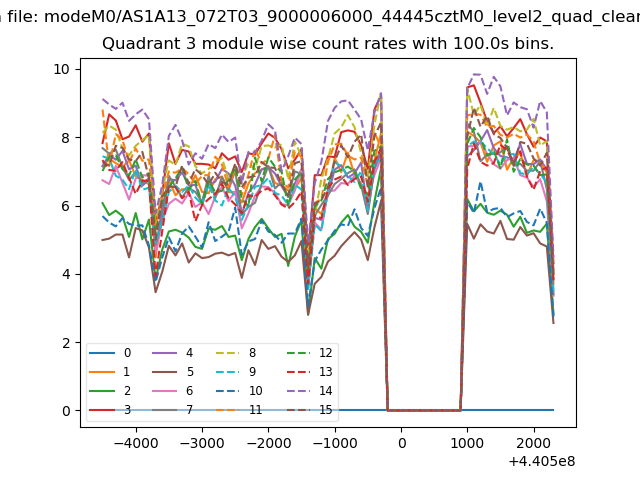 |
 |
| Parameter | Plot |
|---|---|
| CZT HV Monitor | 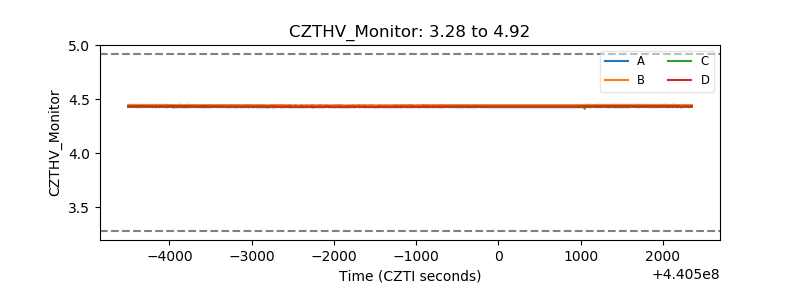 |
| D_VDD | 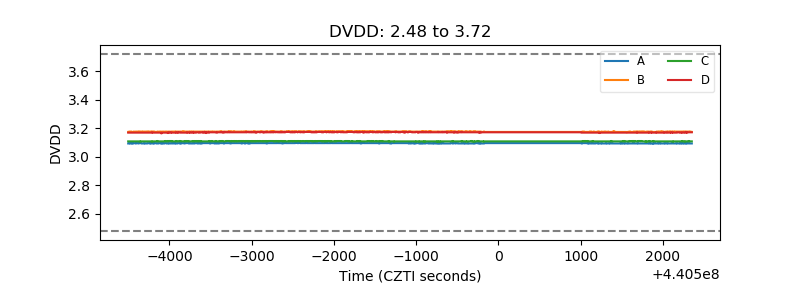 |
| Temperature 1 | 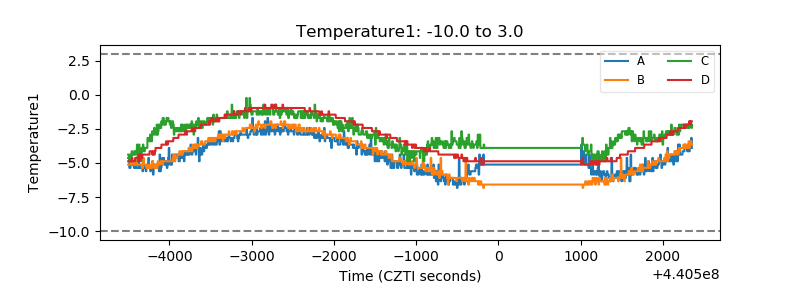 |
| Veto HV Monitor |  |
| Veto LLD | 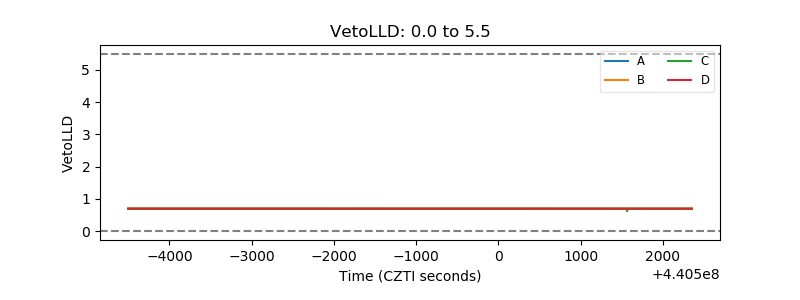 |
| Alpha Counter | 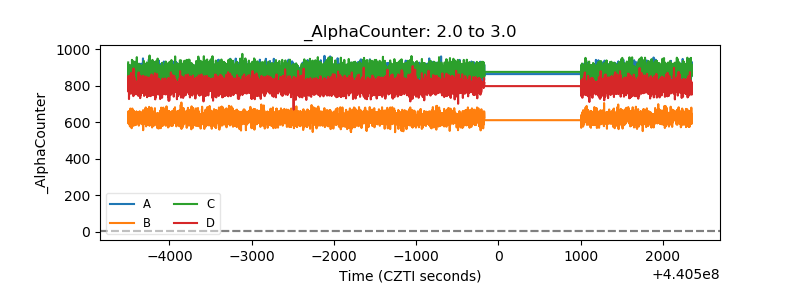 |
| _CPM_Rate | 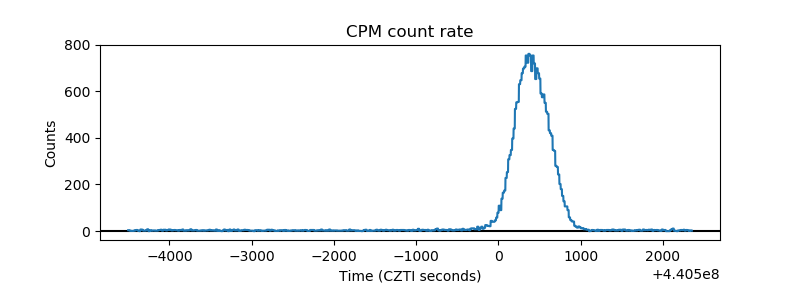 |
| CZT Counter | 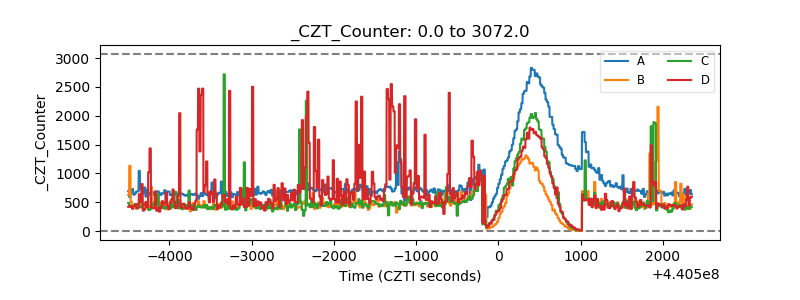 |
| +2.5 Volts monitor | 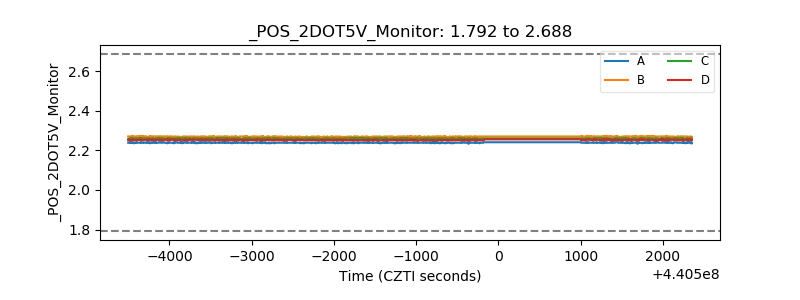 |
| +5 Volts monitor | 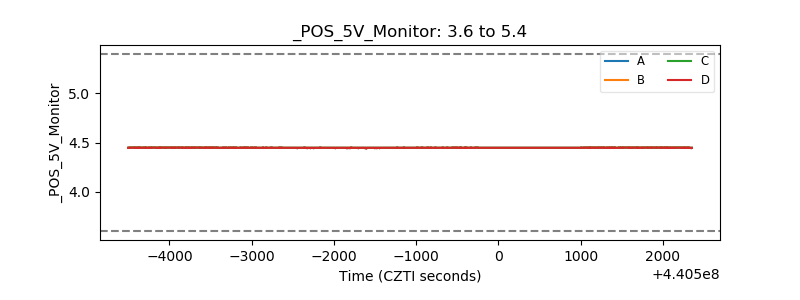 |
| _ROLL_ROT | 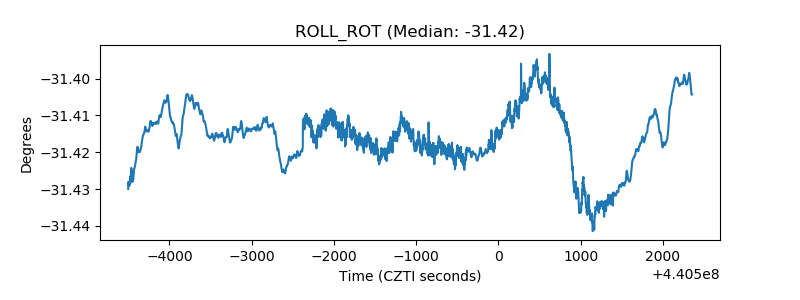 |
| _Roll_DEC | 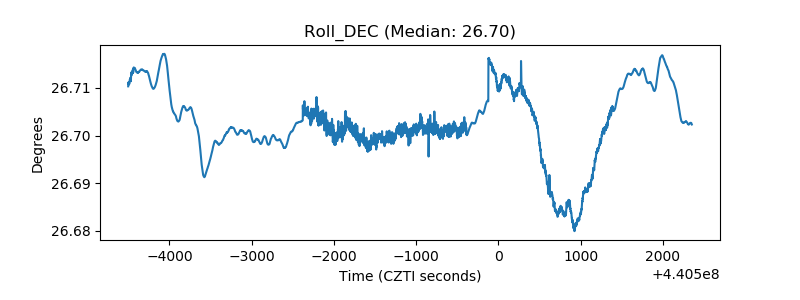 |
| _Roll_RA | 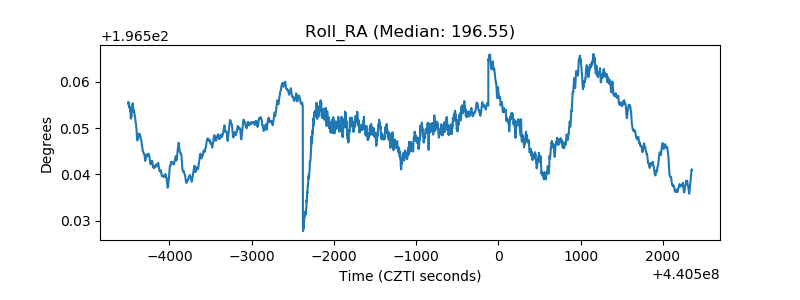 |
| Veto Counter | 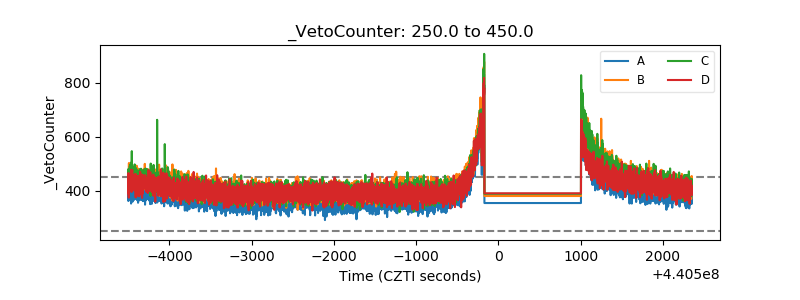 |