| Param | Original file | Final file |
|---|---|---|
| Filename | modeM0/AS1A13_072T03_9000006000_44446cztM0_level2.fits | modeM0/AS1A13_072T03_9000006000_44446cztM0_level2_quad_clean.evt |
| Size (bytes) | 467,038,080 | 109,198,080 |
| Size | 445.4 MB | 104.1 MB |
| Events in quadrant A | 4,797,831 | 734,334 |
| Events in quadrant B | 3,354,913 | 768,908 |
| Events in quadrant C | 3,138,469 | 732,955 |
| Events in quadrant D | 5,488,511 | 613,752 |
| Mode SS | |||
|---|---|---|---|
| Quadrant | BADHDUFLAG | Total packets | Discarded packets |
| A | 0 | 134 | 0 |
| B | 0 | 134 | 0 |
| C | 0 | 134 | 0 |
| D | 0 | 134 | 0 |
| Mode M9 | |||
|---|---|---|---|
| Quadrant | BADHDUFLAG | Total packets | Discarded packets |
| A | 0 | 10 | 0 |
| B | 0 | 10 | 0 |
| C | 0 | 10 | 0 |
| D | 0 | 10 | 0 |
| Mode M0 | |||
|---|---|---|---|
| Quadrant | BADHDUFLAG | Total packets | Discarded packets |
| A | 0 | 20173 | 4 |
| B | 0 | 14251 | 2 |
| C | 0 | 13790 | 2 |
| D | 0 | 20695 | 3 |
| Quadrant | Total seconds | Saturated seconds | Saturation percentage |
|---|---|---|---|
| A | 6542 | 238 | 3.638031% |
| B | 6544 | 158 | 2.414425% |
| C | 6544 | 100 | 1.528117% |
| D | 6543 | 761 | 11.630750% |
Noise dominated data is calculated using 1-second bins in cleaned event files. If a bin has >2000 counts, and if more than 50% of those come from <1% of pixels, then it is considered to be noise-dominated and hence unusable.
| Quadrant | # 1 sec bins | Bins with >0 counts | Bins with >2000 counts | High rate bins dominated by noise | Noise dominated (total time) | Noise dominated (detector-on time) | Marked lightcurve |
|---|---|---|---|---|---|---|---|
| A | 7598 | 6544 | 8 | 8 | 0.11% | 0.12% | 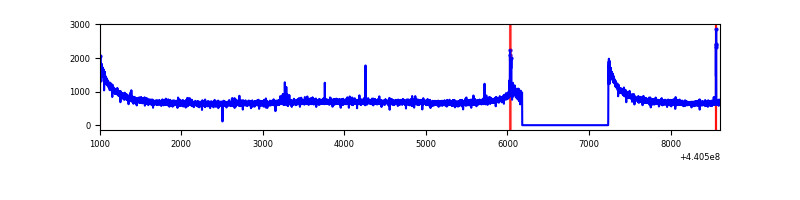 |
| B | 7599 | 6545 | 19 | 19 | 0.25% | 0.29% | 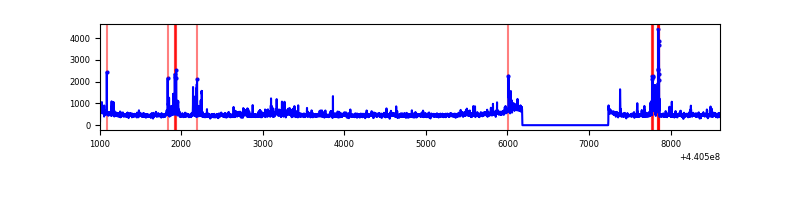 |
| C | 7599 | 6545 | 8 | 8 | 0.11% | 0.12% | 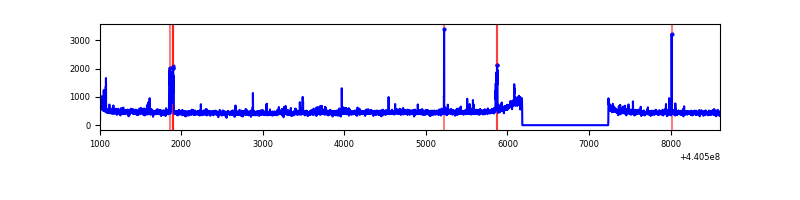 |
| D | 7599 | 6545 | 535 | 535 | 7.04% | 8.17% |  |
Top three noisy pixels from each quadrant. If the there are fewer than three noisy pixels in the level2.evt file, extra rows are filled as -1
| Pixel properties | Quadrant properties | ||||||
|---|---|---|---|---|---|---|---|
| Quadrant | DetID | PixID | Counts | Sigma | Mean | Median | Sigma |
| A | 10 | 83 | 1781464 | 11228.27 | 768 | 753 | 158.6 |
| A | 10 | 248 | 38213 | 236.2 | 768 | 753 | 158.6 |
| A | 8 | 4 | 11808 | 69.71 | 768 | 753 | 158.6 |
| B | 5 | 172 | 176566 | 1177.45 | 761 | 739 | 149.3 |
| B | 0 | 155 | 63456 | 419.99 | 761 | 739 | 149.3 |
| B | 0 | 168 | 49963 | 329.64 | 761 | 739 | 149.3 |
| C | 2 | 14 | 110392 | 622.09 | 754 | 759 | 176.2 |
| C | 14 | 254 | 53436 | 298.9 | 754 | 759 | 176.2 |
| C | 3 | 233 | 27084 | 149.37 | 754 | 759 | 176.2 |
| D | 13 | 249 | 1018995 | 5613.16 | 722 | 699 | 181.4 |
| D | 5 | 235 | 836364 | 4606.44 | 722 | 699 | 181.4 |
| D | 2 | 249 | 315758 | 1736.7 | 722 | 699 | 181.4 |
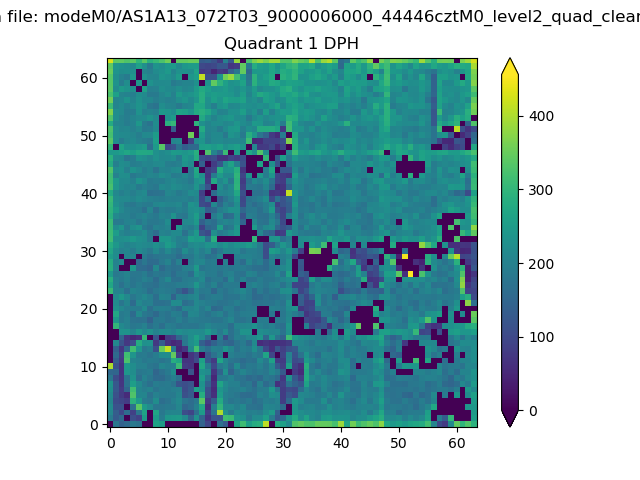
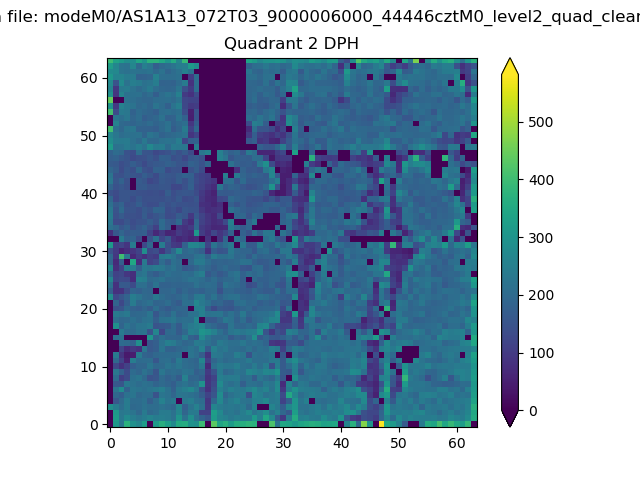
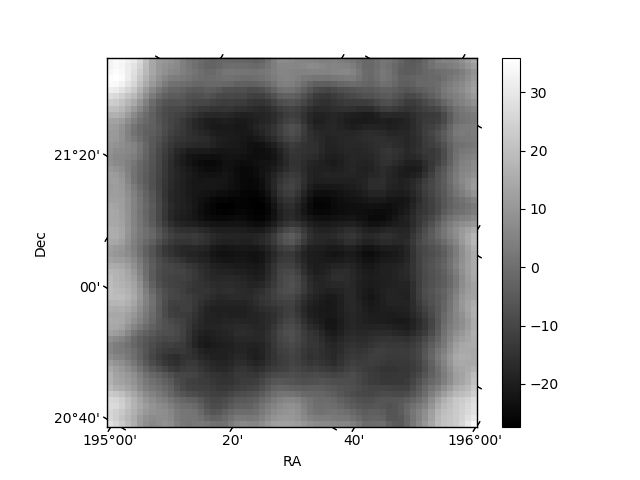
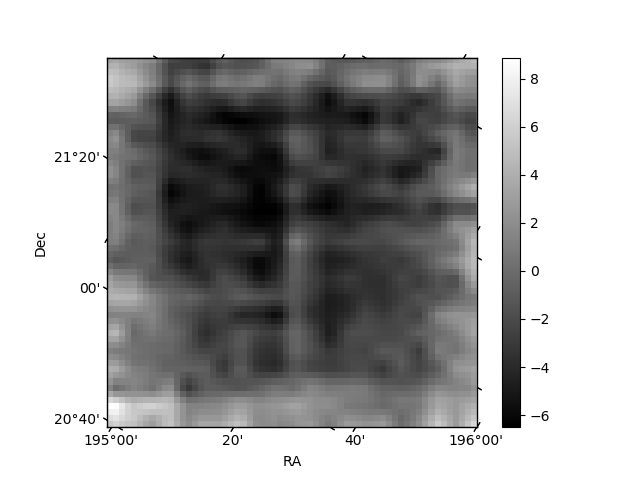
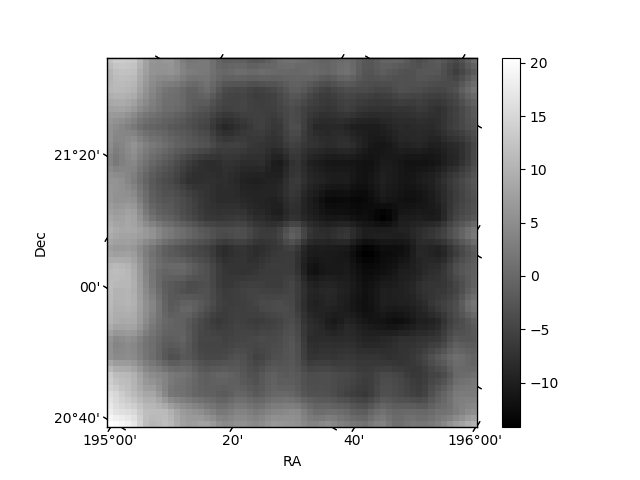
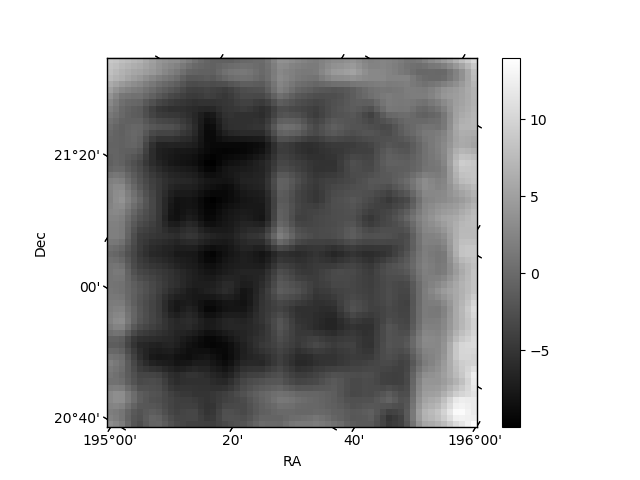
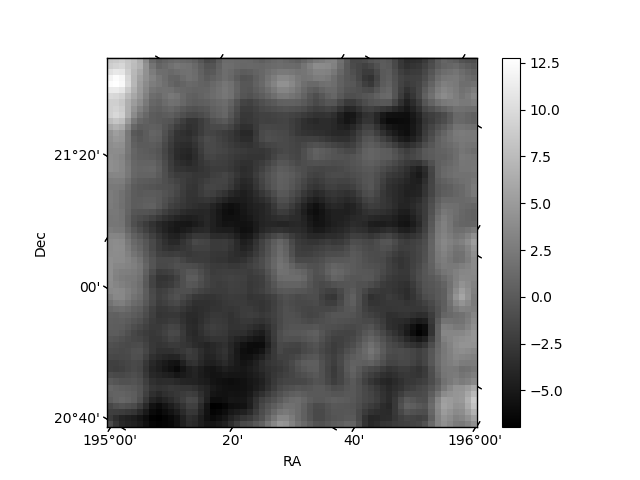
Histogram calculated using DETX and DETY for each event in the final _common_clean file
| Quadrant A | 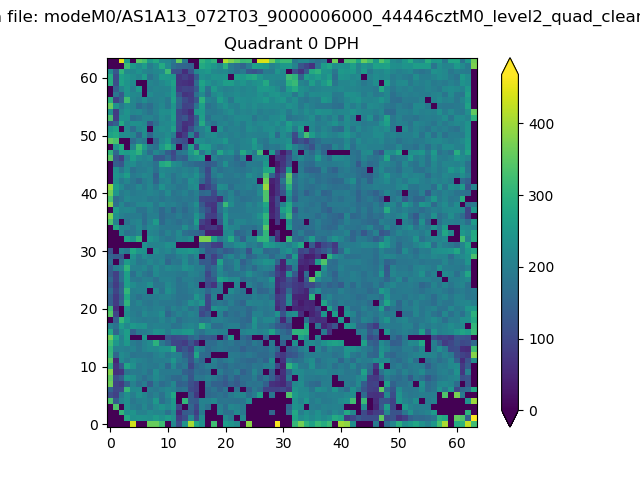 |
 |
Quadrant B |
|---|---|---|---|
| Quadrant D | 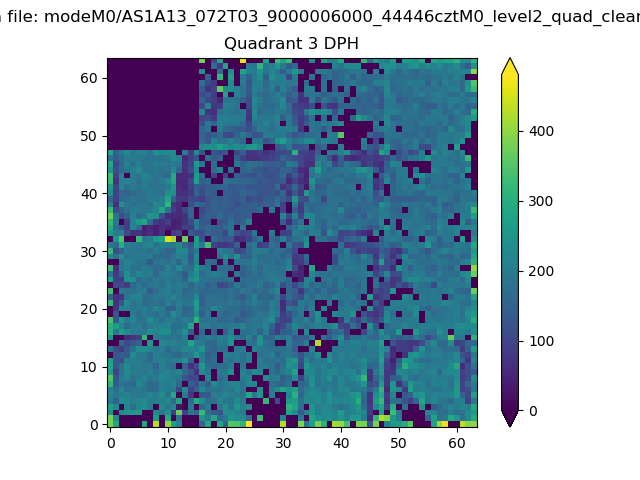 |
 |
Quadrant C |
| Plot type | Count rate plots | Images |
|---|---|---|
| Comparison with Poisson distribution Blue bars denote a histogram of data divided into 1 sec bins. Red curve is a Poisson curve with rate = median count rate of data. |
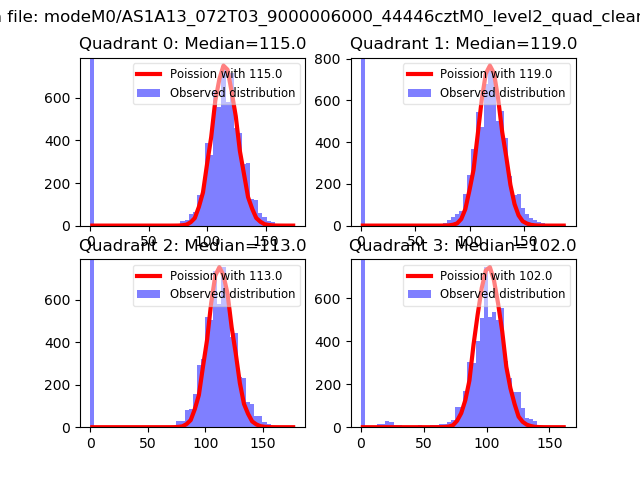 |
 |
| Quadrant-wise count rates Data is divided into 100 sec bins |
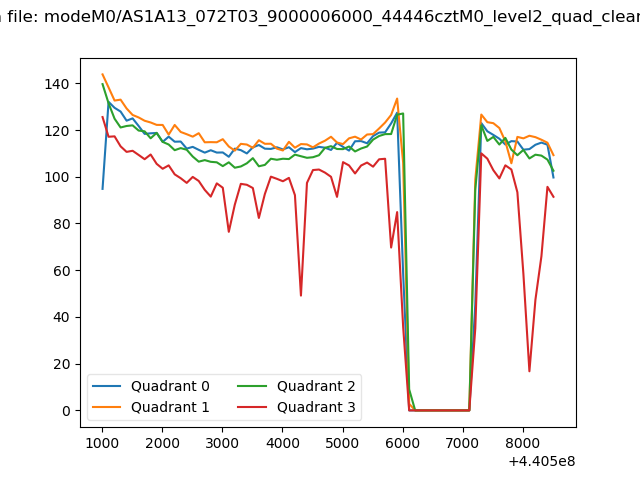 |
|
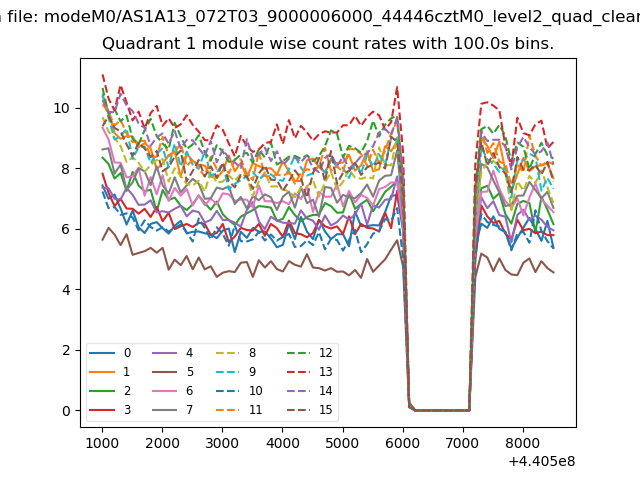
| Module-wise count rates for Quadrant A Data is divided into 100 sec bins |
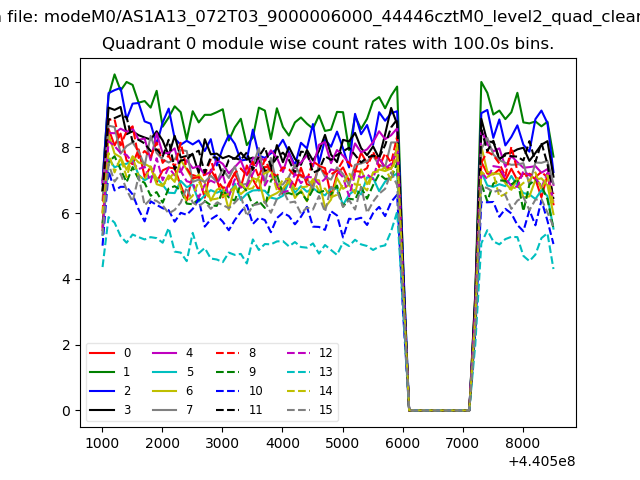 |
 |
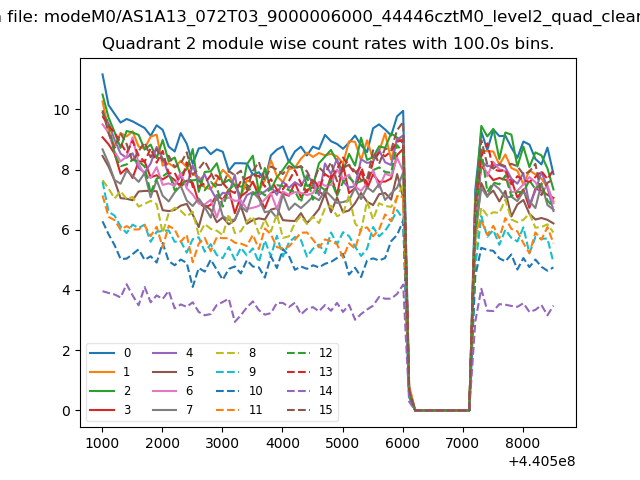
| Module-wise count rates for Quadrant B Data is divided into 100 sec bins |
 |
 |
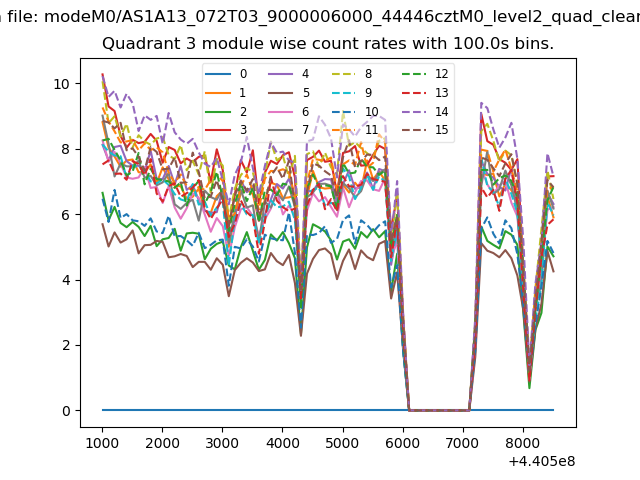
| Module-wise count rates for Quadrant C Data is divided into 100 sec bins |
 |
 |
| Module-wise count rates for Quadrant D Data is divided into 100 sec bins |
 |
 |
| Parameter | Plot |
|---|---|
| CZT HV Monitor | 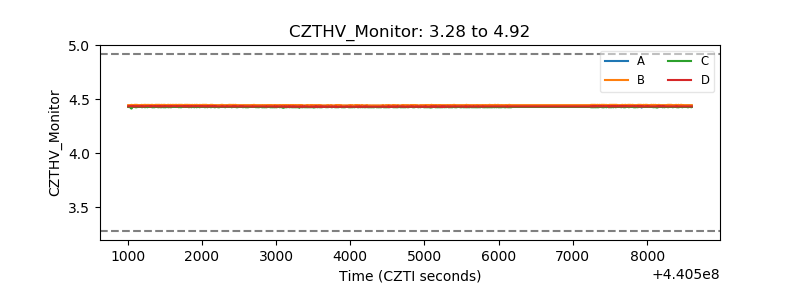 |
| D_VDD | 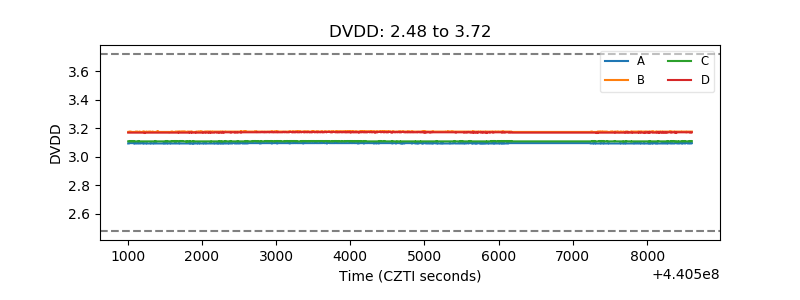 |
| Temperature 1 | 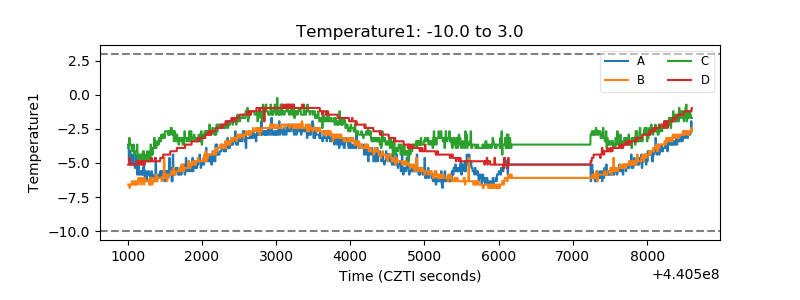 |
| Veto HV Monitor | 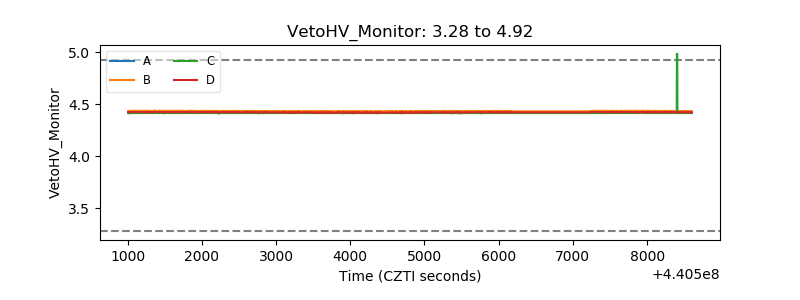 |
| Veto LLD | 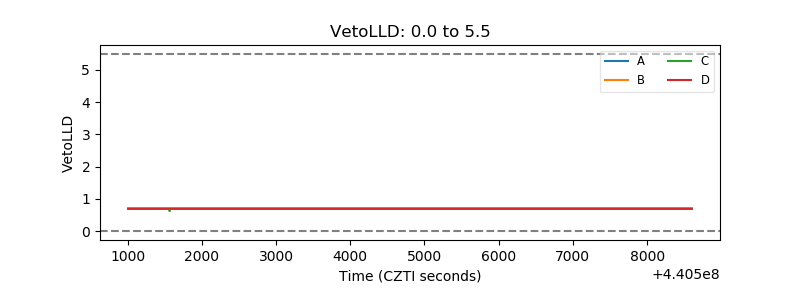 |
| Alpha Counter | 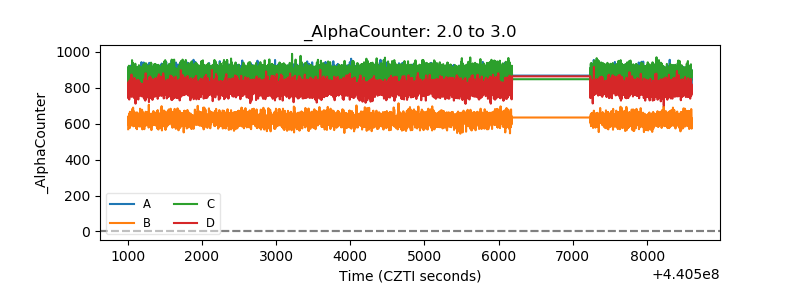 |
| _CPM_Rate | 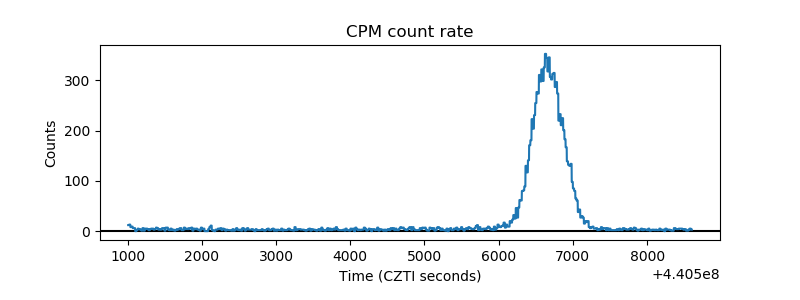 |
| CZT Counter | 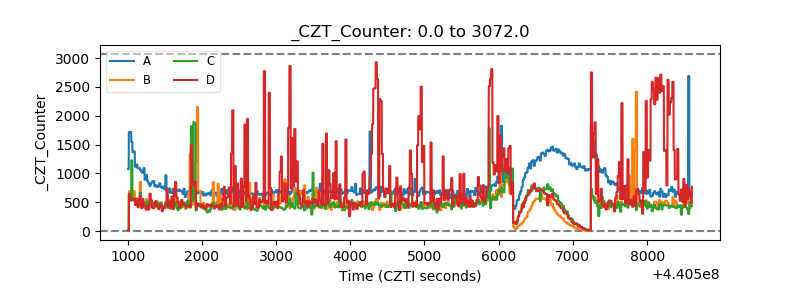 |
| +2.5 Volts monitor | 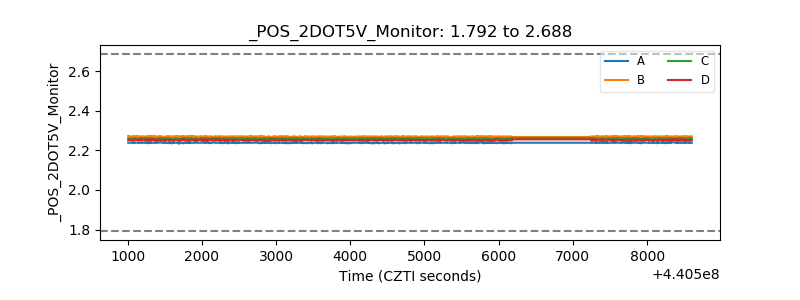 |
| +5 Volts monitor | 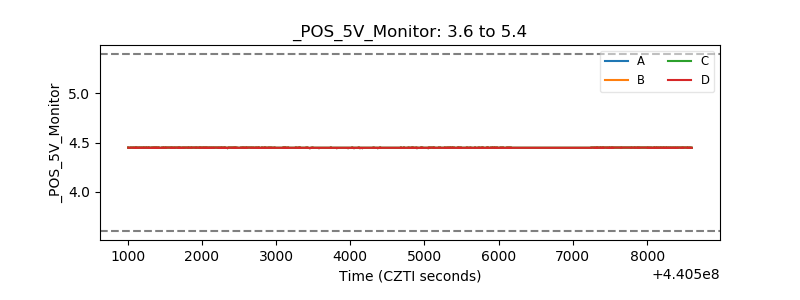 |
| _ROLL_ROT | 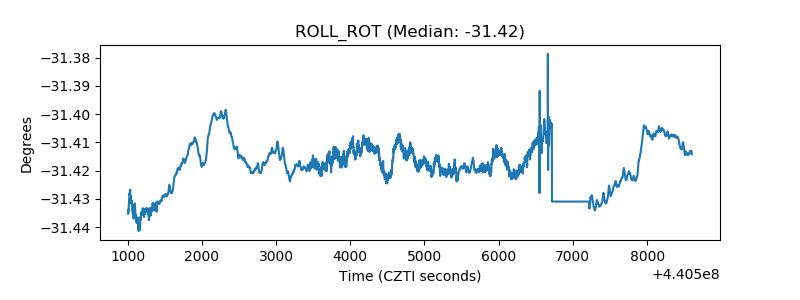 |
| _Roll_DEC | 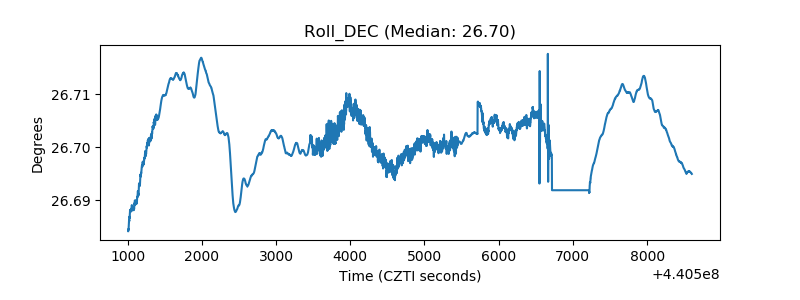 |
| _Roll_RA | 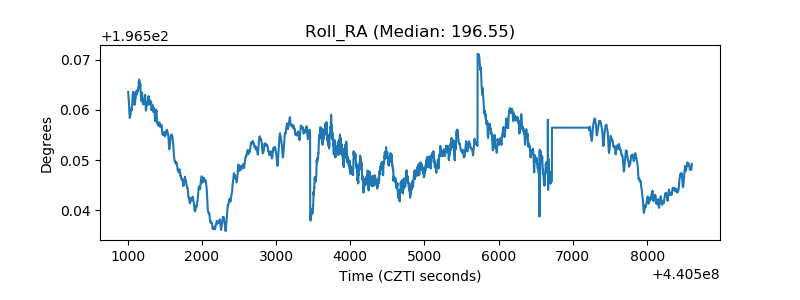 |
| Veto Counter | 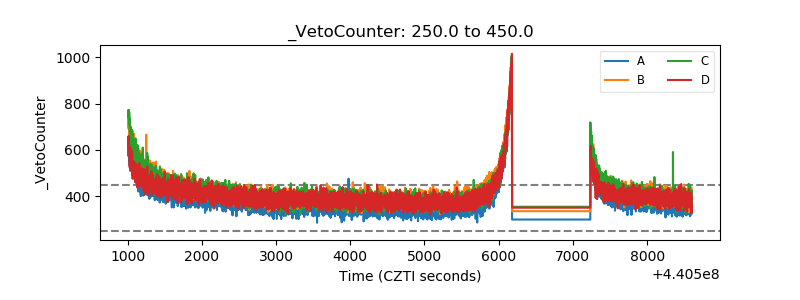 |