| Param | Original file | Final file |
|---|---|---|
| Filename | modeM0/AS1A13_072T03_9000006000_44447cztM0_level2.fits | modeM0/AS1A13_072T03_9000006000_44447cztM0_level2_quad_clean.evt |
| Size (bytes) | 544,838,400 | 108,331,200 |
| Size | 519.6 MB | 103.3 MB |
| Events in quadrant A | 4,978,156 | 747,995 |
| Events in quadrant B | 3,533,086 | 772,966 |
| Events in quadrant C | 3,247,711 | 741,859 |
| Events in quadrant D | 7,874,723 | 537,772 |
| Mode SS | |||
|---|---|---|---|
| Quadrant | BADHDUFLAG | Total packets | Discarded packets |
| A | 0 | 140 | 0 |
| B | 0 | 140 | 0 |
| C | 0 | 140 | 0 |
| D | 0 | 140 | 0 |
| Mode M9 | |||
|---|---|---|---|
| Quadrant | BADHDUFLAG | Total packets | Discarded packets |
| A | 0 | 8 | 0 |
| B | 0 | 8 | 0 |
| C | 0 | 8 | 0 |
| D | 0 | 8 | 0 |
| Mode M0 | |||
|---|---|---|---|
| Quadrant | BADHDUFLAG | Total packets | Discarded packets |
| A | 0 | 21042 | 3 |
| B | 0 | 15047 | 2 |
| C | 0 | 14456 | 2 |
| D | 0 | 28056 | 2 |
| Quadrant | Total seconds | Saturated seconds | Saturation percentage |
|---|---|---|---|
| A | 6880 | 239 | 3.473837% |
| B | 6881 | 224 | 3.255341% |
| C | 6881 | 111 | 1.613138% |
| D | 6881 | 1633 | 23.732016% |
Noise dominated data is calculated using 1-second bins in cleaned event files. If a bin has >2000 counts, and if more than 50% of those come from <1% of pixels, then it is considered to be noise-dominated and hence unusable.
| Quadrant | # 1 sec bins | Bins with >0 counts | Bins with >2000 counts | High rate bins dominated by noise | Noise dominated (total time) | Noise dominated (detector-on time) | Marked lightcurve |
|---|---|---|---|---|---|---|---|
| A | 7705 | 6881 | 8 | 8 | 0.10% | 0.12% | 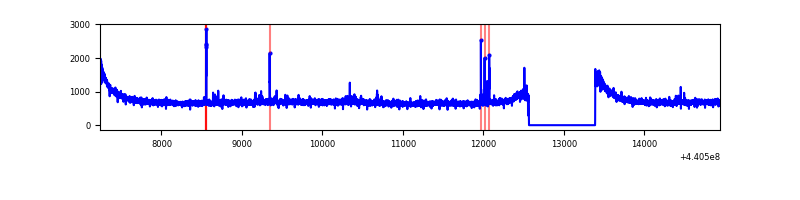 |
| B | 7706 | 6882 | 32 | 32 | 0.42% | 0.46% | 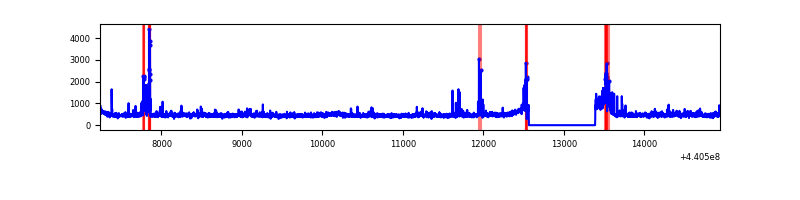 |
| C | 7706 | 6882 | 9 | 9 | 0.12% | 0.13% | 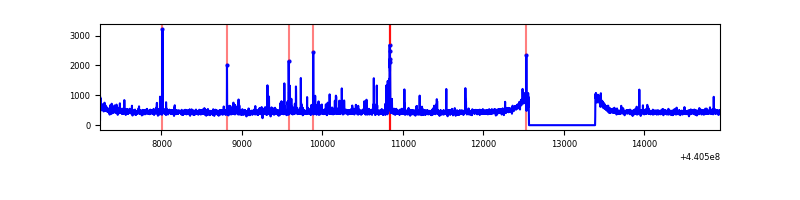 |
| D | 7706 | 6882 | 1260 | 1260 | 16.35% | 18.31% | 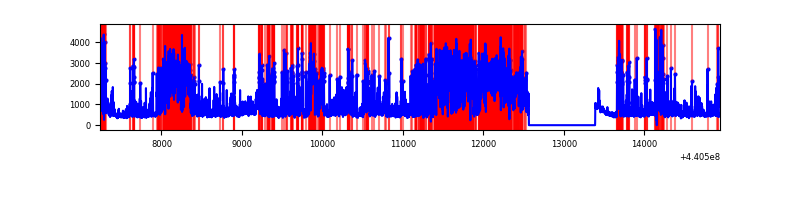 |
Top three noisy pixels from each quadrant. If the there are fewer than three noisy pixels in the level2.evt file, extra rows are filled as -1
| Pixel properties | Quadrant properties | ||||||
|---|---|---|---|---|---|---|---|
| Quadrant | DetID | PixID | Counts | Sigma | Mean | Median | Sigma |
| A | 10 | 83 | 1833010 | 11062.41 | 796 | 780 | 165.6 |
| A | 10 | 248 | 51312 | 305.1 | 796 | 780 | 165.6 |
| A | 8 | 4 | 11852 | 66.85 | 796 | 780 | 165.6 |
| B | 5 | 172 | 282771 | 1804.39 | 787 | 762 | 156.3 |
| B | 0 | 229 | 50911 | 320.87 | 787 | 762 | 156.3 |
| B | 0 | 168 | 42525 | 267.21 | 787 | 762 | 156.3 |
| C | 14 | 254 | 105381 | 567.09 | 784 | 787 | 184.4 |
| C | 2 | 14 | 56349 | 301.24 | 784 | 787 | 184.4 |
| C | 3 | 233 | 30040 | 158.6 | 784 | 787 | 184.4 |
| D | 5 | 235 | 2250853 | 12447.08 | 713 | 690 | 180.8 |
| D | 13 | 249 | 1554458 | 8594.88 | 713 | 690 | 180.8 |
| D | 2 | 249 | 396581 | 2189.92 | 713 | 690 | 180.8 |
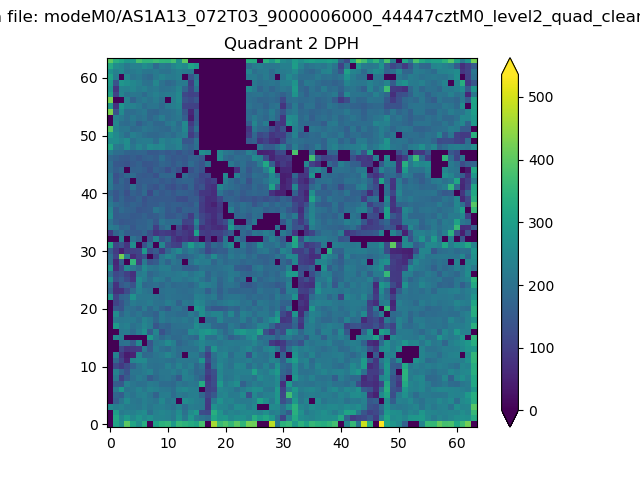
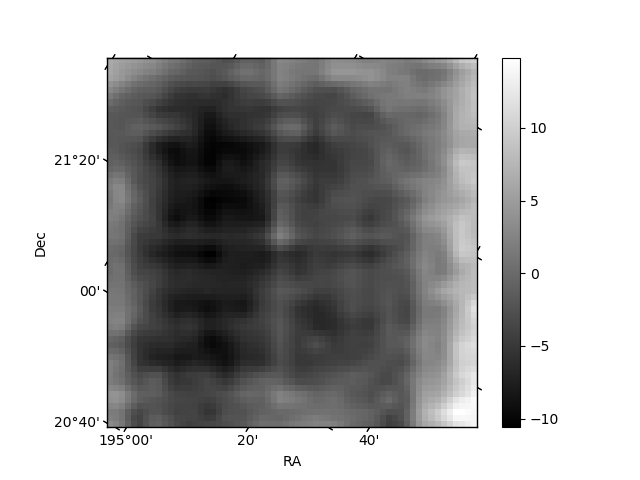
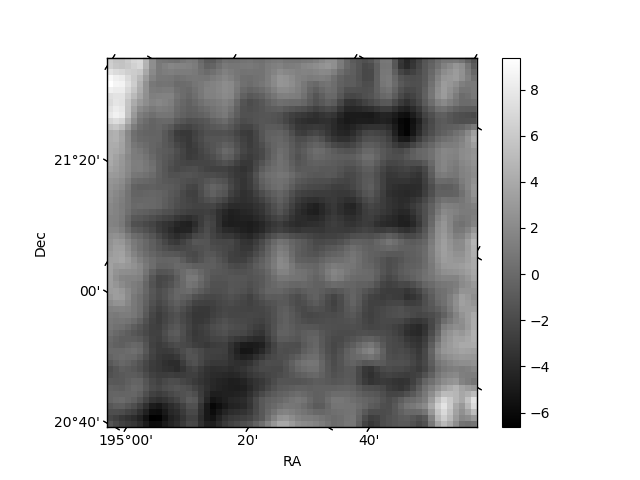
Histogram calculated using DETX and DETY for each event in the final _common_clean file
| Quadrant A | 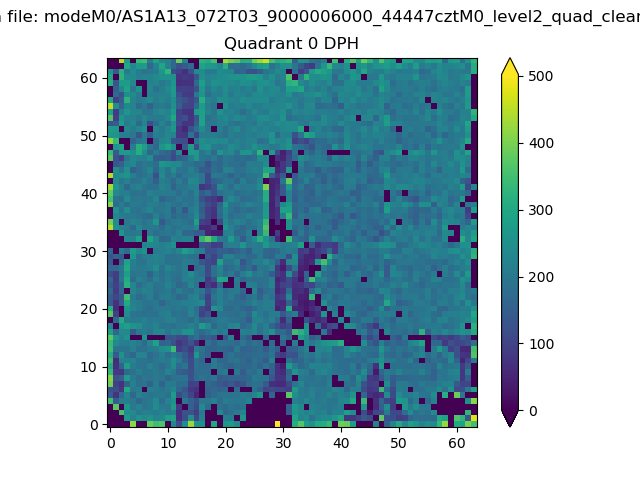 |
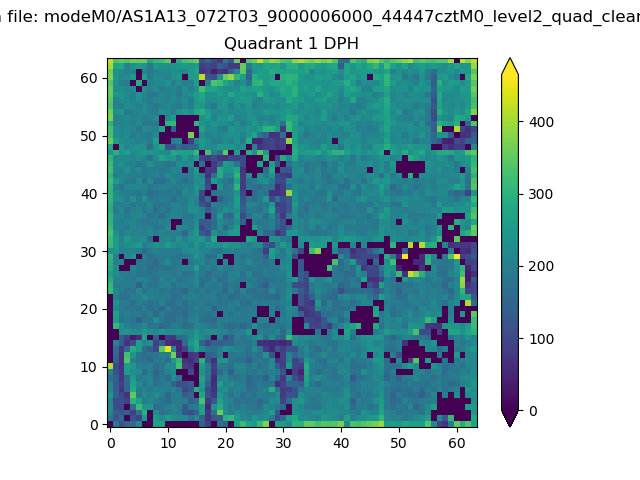 |
Quadrant B |
|---|---|---|---|
| Quadrant D | 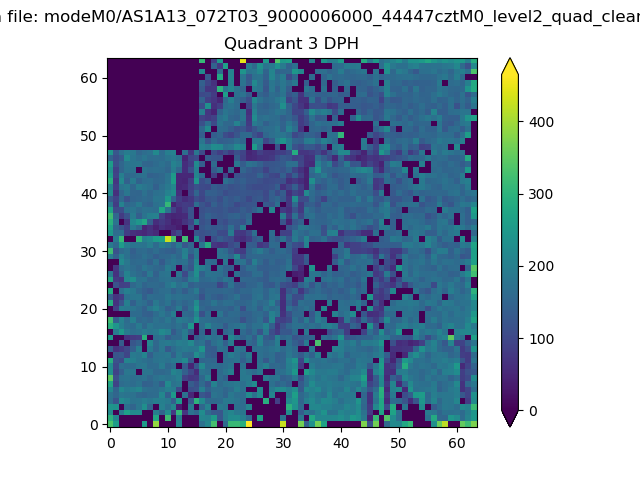 |
 |
Quadrant C |
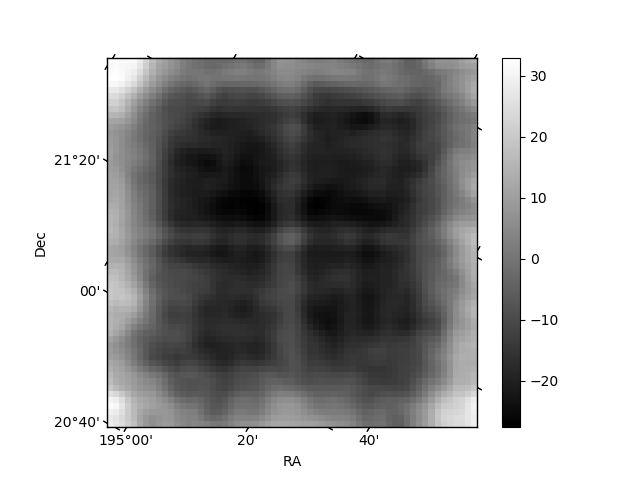
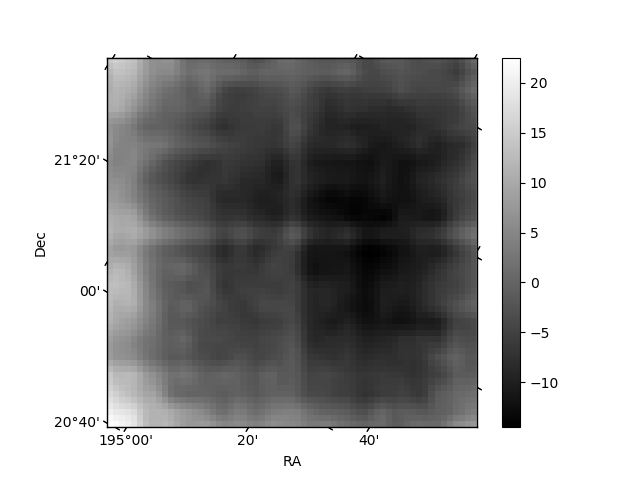
| Plot type | Count rate plots | Images |
|---|---|---|
| Comparison with Poisson distribution Blue bars denote a histogram of data divided into 1 sec bins. Red curve is a Poisson curve with rate = median count rate of data. |
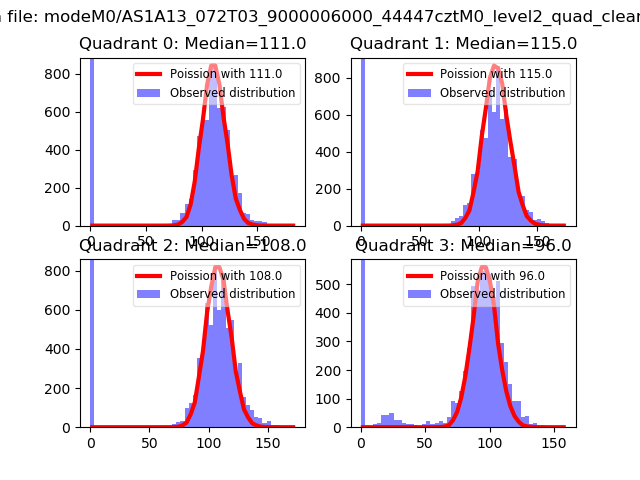 |
 |
| Quadrant-wise count rates Data is divided into 100 sec bins |
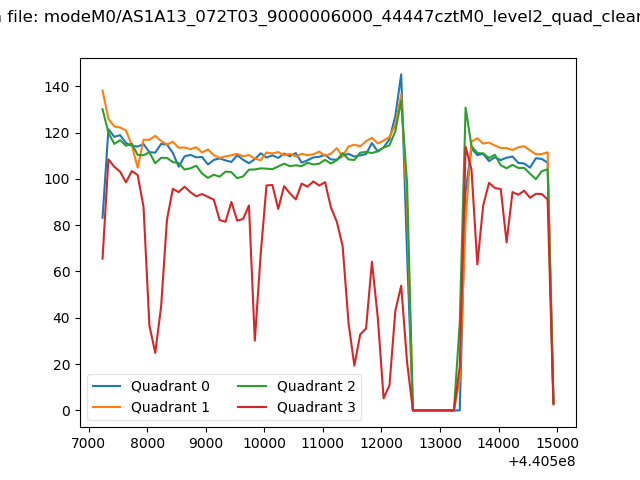 |
|
| Module-wise count rates for Quadrant A Data is divided into 100 sec bins |
 |
 |
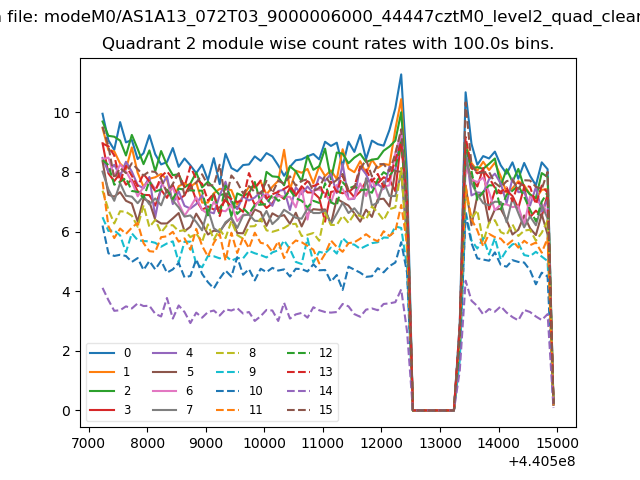
| Module-wise count rates for Quadrant B Data is divided into 100 sec bins |
 |
 |
| Module-wise count rates for Quadrant C Data is divided into 100 sec bins |
 |
 |
| Module-wise count rates for Quadrant D Data is divided into 100 sec bins |
 |
 |
| Parameter | Plot |
|---|---|
| CZT HV Monitor | 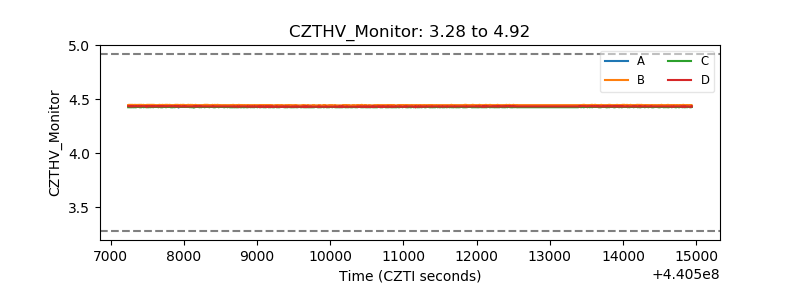 |
| D_VDD | 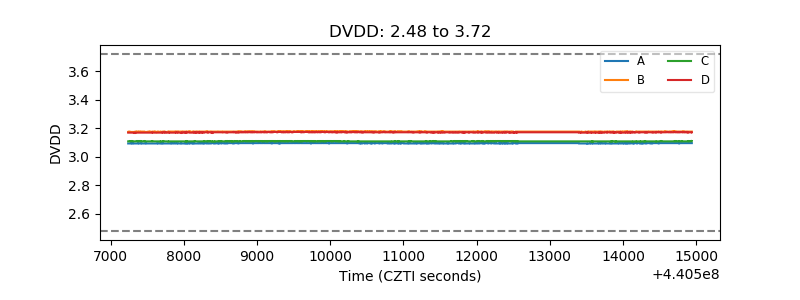 |
| Temperature 1 | 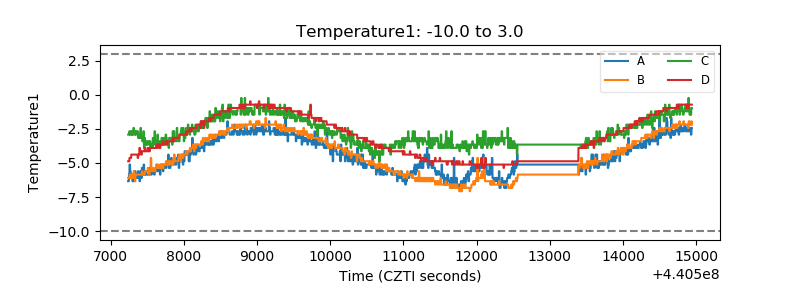 |
| Veto HV Monitor | 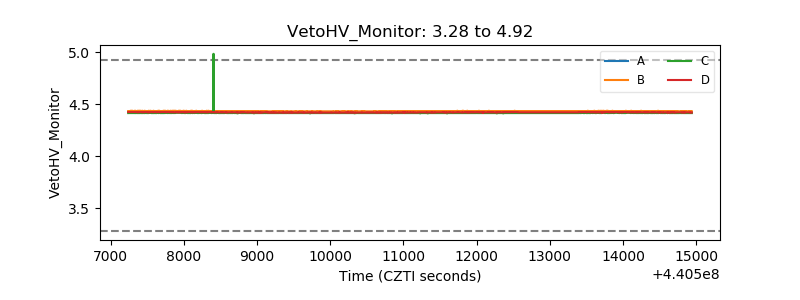 |
| Veto LLD | 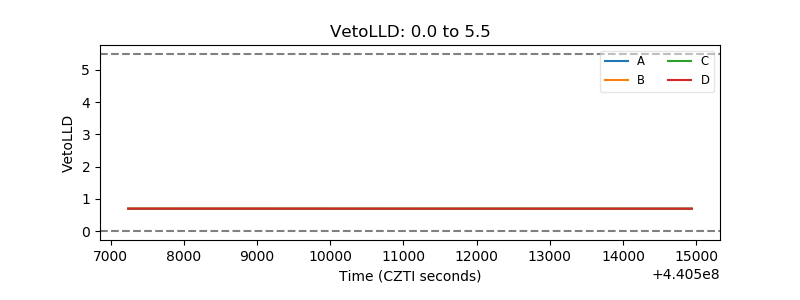 |
| Alpha Counter | 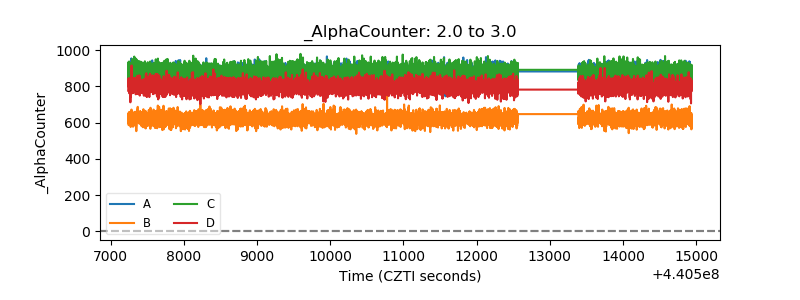 |
| _CPM_Rate | 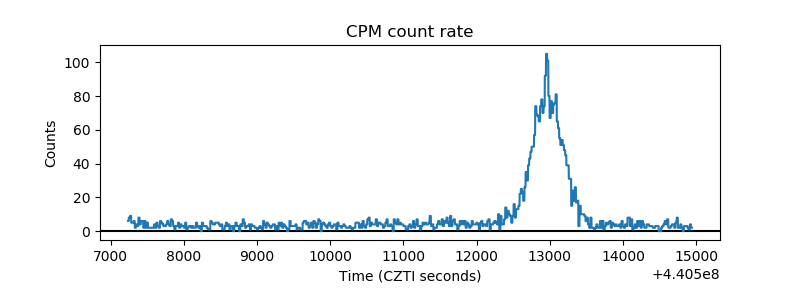 |
| CZT Counter | 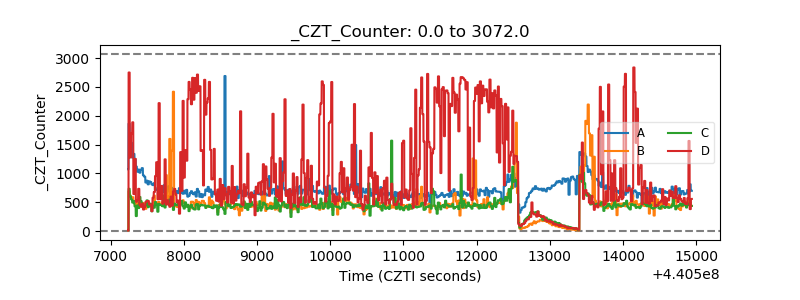 |
| +2.5 Volts monitor | 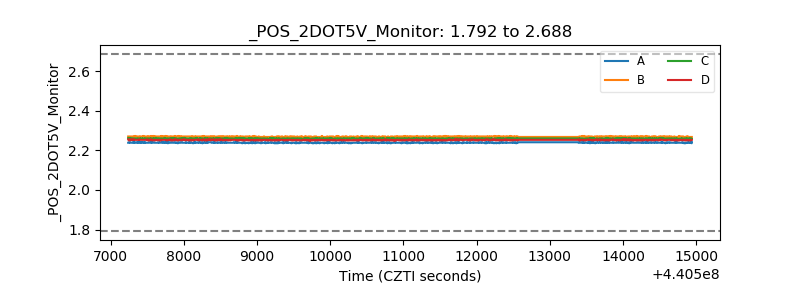 |
| +5 Volts monitor | 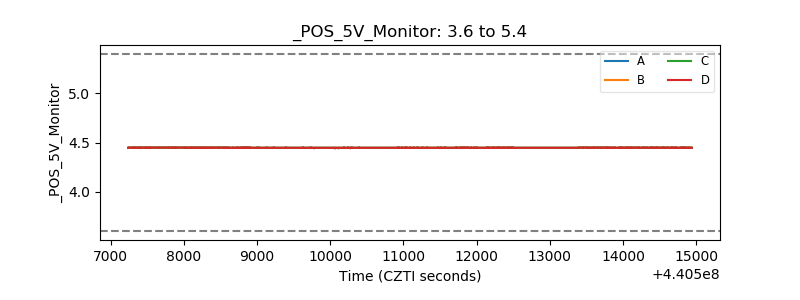 |
| _ROLL_ROT | 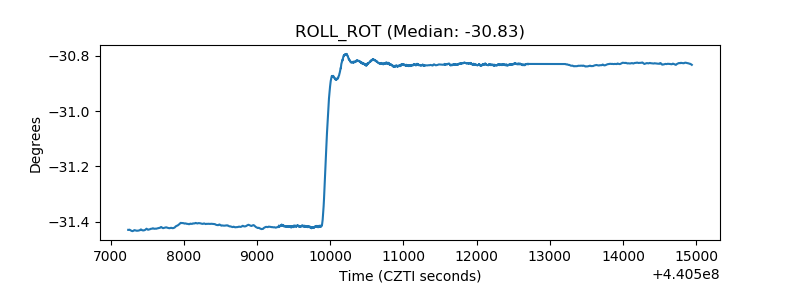 |
| _Roll_DEC | 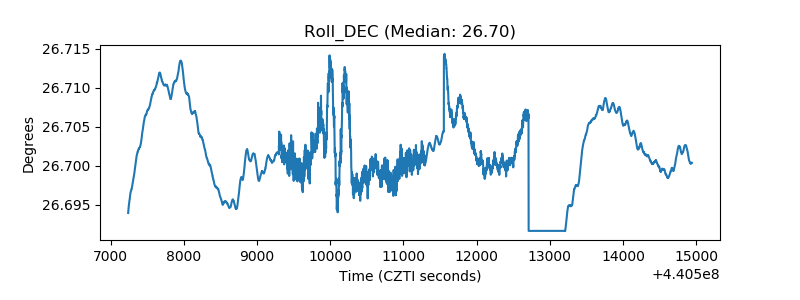 |
| _Roll_RA | 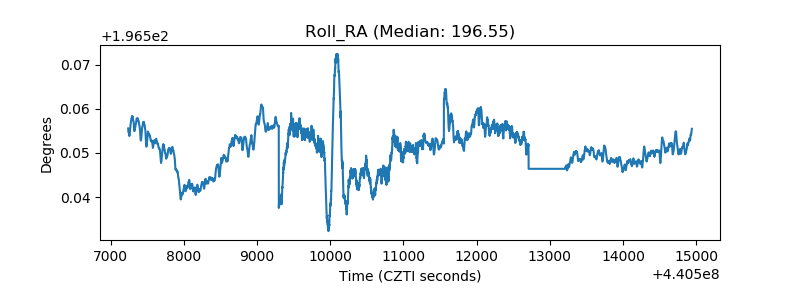 |
| Veto Counter | 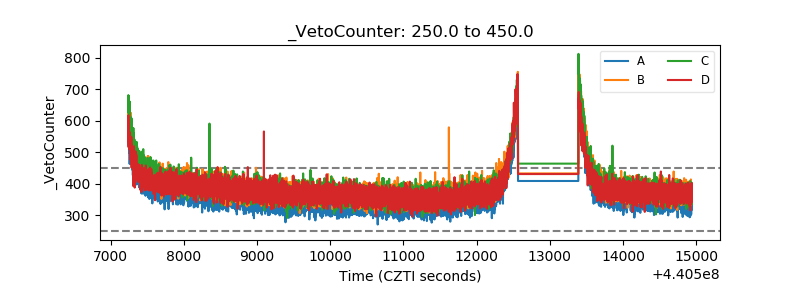 |