| Param | Original file | Final file |
|---|---|---|
| Filename | modeM0/AS1A13_072T03_9000006000_44457cztM0_level2.fits | modeM0/AS1A13_072T03_9000006000_44457cztM0_level2_quad_clean.evt |
| Size (bytes) | 398,177,280 | 103,199,040 |
| Size | 379.7 MB | 98.4 MB |
| Events in quadrant A | 4,340,484 | 695,263 |
| Events in quadrant B | 2,866,551 | 717,625 |
| Events in quadrant C | 3,558,328 | 658,228 |
| Events in quadrant D | 3,483,637 | 613,960 |
| Mode SS | |||
|---|---|---|---|
| Quadrant | BADHDUFLAG | Total packets | Discarded packets |
| A | 0 | 128 | 0 |
| B | 0 | 128 | 0 |
| C | 0 | 128 | 0 |
| D | 0 | 128 | 0 |
| Mode M9 | |||
|---|---|---|---|
| Quadrant | BADHDUFLAG | Total packets | Discarded packets |
| A | 0 | 11 | 0 |
| B | 0 | 11 | 0 |
| C | 0 | 11 | 0 |
| D | 0 | 11 | 0 |
| Mode M0 | |||
|---|---|---|---|
| Quadrant | BADHDUFLAG | Total packets | Discarded packets |
| A | 0 | 18001 | 1 |
| B | 0 | 13117 | 1 |
| C | 0 | 15182 | 1 |
| D | 0 | 15039 | 1 |
| Quadrant | Total seconds | Saturated seconds | Saturation percentage |
|---|---|---|---|
| A | 6301 | 60 | 0.952230% |
| B | 6301 | 51 | 0.809395% |
| C | 6301 | 268 | 4.253293% |
| D | 6302 | 121 | 1.920025% |
Noise dominated data is calculated using 1-second bins in cleaned event files. If a bin has >2000 counts, and if more than 50% of those come from <1% of pixels, then it is considered to be noise-dominated and hence unusable.
| Quadrant | # 1 sec bins | Bins with >0 counts | Bins with >2000 counts | High rate bins dominated by noise | Noise dominated (total time) | Noise dominated (detector-on time) | Marked lightcurve |
|---|---|---|---|---|---|---|---|
| A | 7411 | 6302 | 4 | 4 | 0.05% | 0.06% | 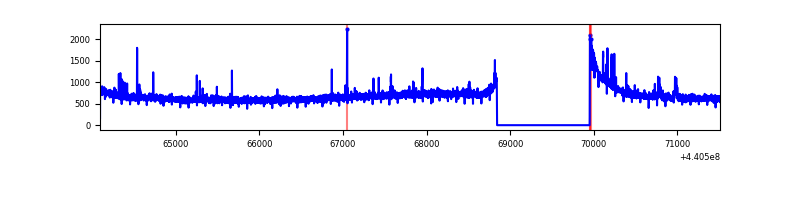 |
| B | 7411 | 6302 | 8 | 8 | 0.11% | 0.13% | 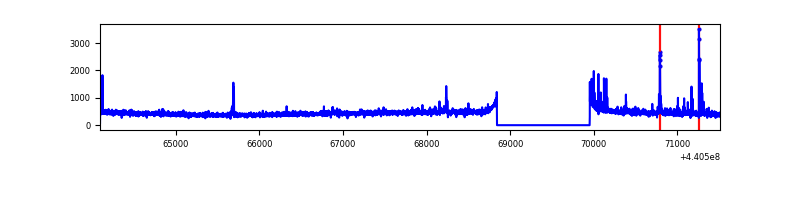 |
| C | 7411 | 6302 | 234 | 234 | 3.16% | 3.71% | 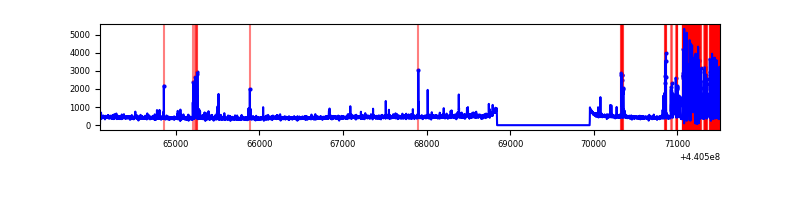 |
| D | 7412 | 6303 | 97 | 97 | 1.31% | 1.54% | 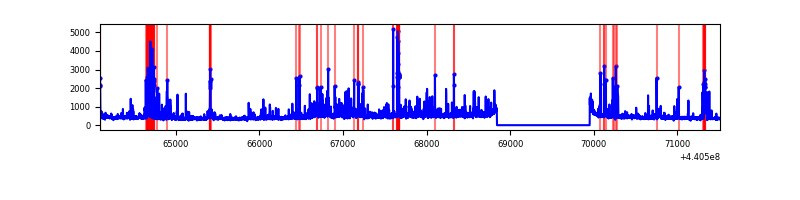 |
Top three noisy pixels from each quadrant. If the there are fewer than three noisy pixels in the level2.evt file, extra rows are filled as -1
| Pixel properties | Quadrant properties | ||||||
|---|---|---|---|---|---|---|---|
| Quadrant | DetID | PixID | Counts | Sigma | Mean | Median | Sigma |
| A | 10 | 83 | 1612518 | 11308.41 | 688 | 673 | 142.5 |
| A | 14 | 238 | 30927 | 212.26 | 688 | 673 | 142.5 |
| A | 8 | 4 | 13002 | 86.5 | 688 | 673 | 142.5 |
| B | 4 | 170 | 75344 | 551.61 | 689 | 667 | 135.4 |
| B | 0 | 229 | 25788 | 185.56 | 689 | 667 | 135.4 |
| B | 12 | 111 | 17433 | 123.84 | 689 | 667 | 135.4 |
| C | 12 | 16 | 843374 | 5470.93 | 658 | 661 | 154.0 |
| C | 14 | 254 | 88947 | 573.16 | 658 | 661 | 154.0 |
| C | 15 | 208 | 27092 | 171.59 | 658 | 661 | 154.0 |
| D | 5 | 235 | 337886 | 2037.27 | 663 | 643 | 165.5 |
| D | 1 | 52 | 241742 | 1456.47 | 663 | 643 | 165.5 |
| D | 13 | 249 | 124205 | 746.43 | 663 | 643 | 165.5 |
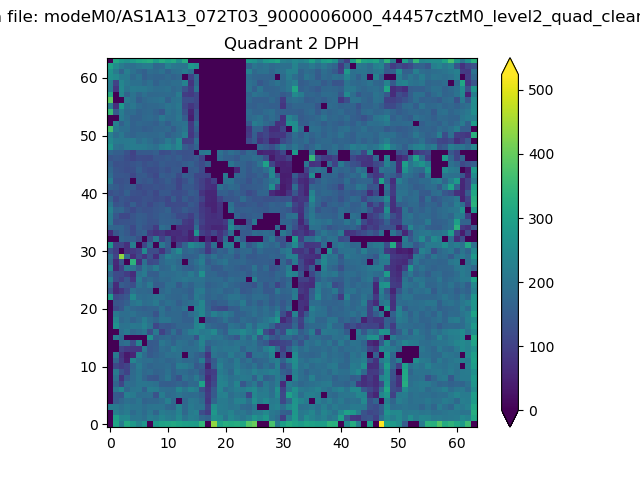
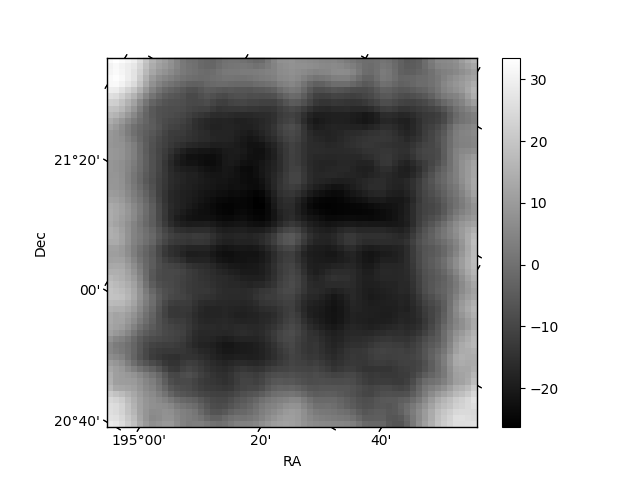
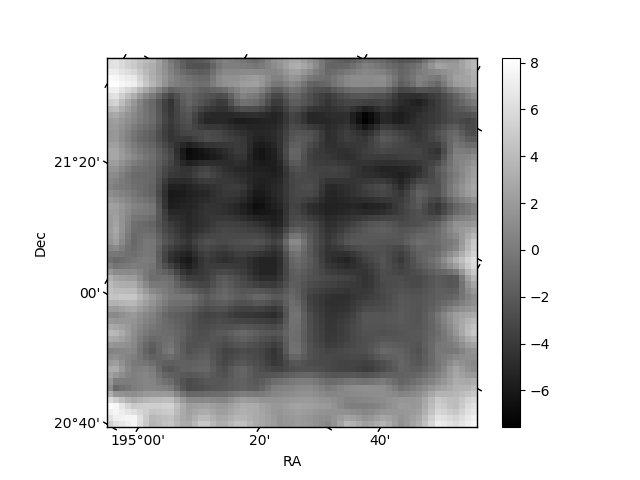
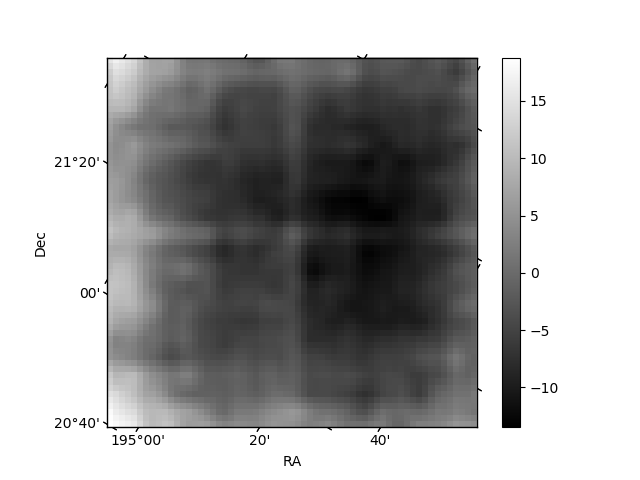
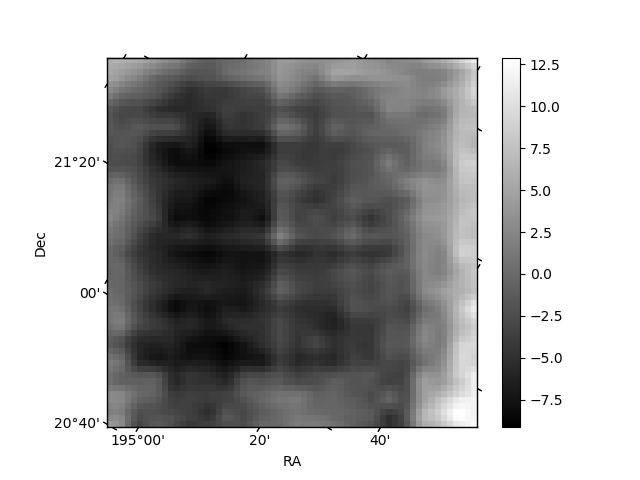
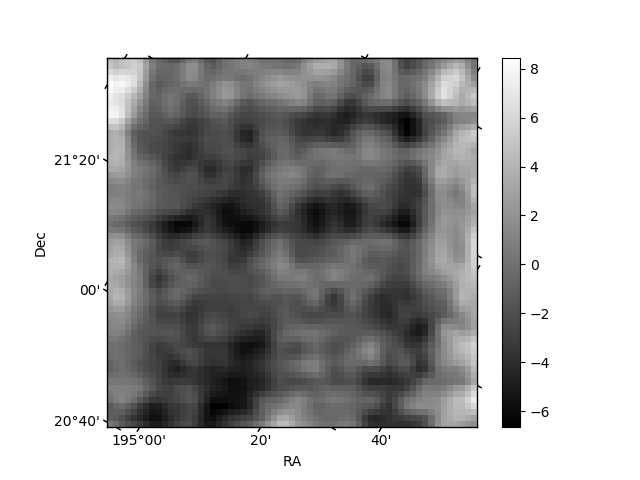
Histogram calculated using DETX and DETY for each event in the final _common_clean file
| Quadrant A | 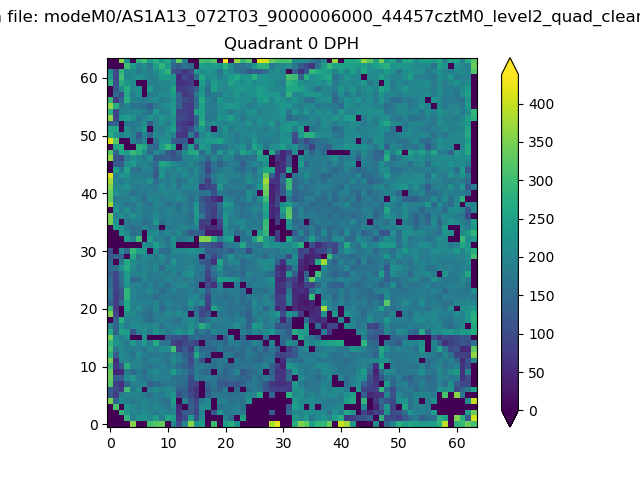 |
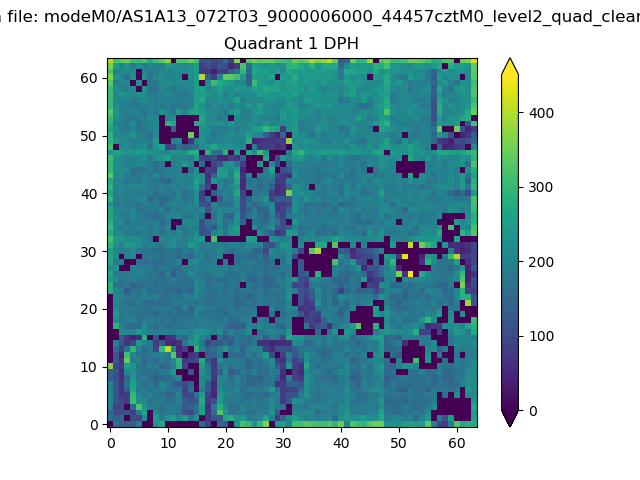 |
Quadrant B |
|---|---|---|---|
| Quadrant D | 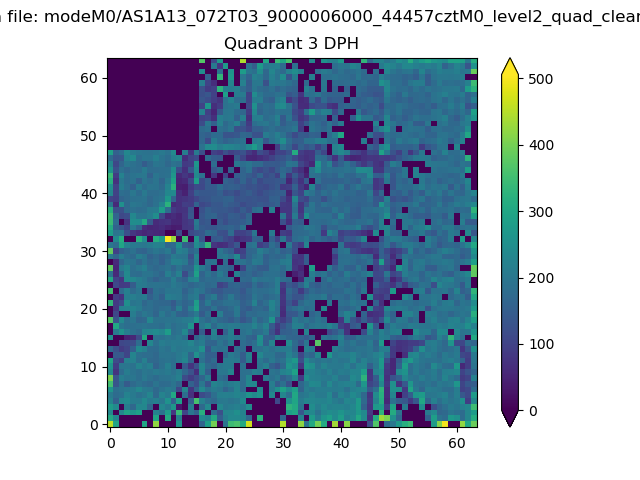 |
 |
Quadrant C |
| Plot type | Count rate plots | Images |
|---|---|---|
| Comparison with Poisson distribution Blue bars denote a histogram of data divided into 1 sec bins. Red curve is a Poisson curve with rate = median count rate of data. |
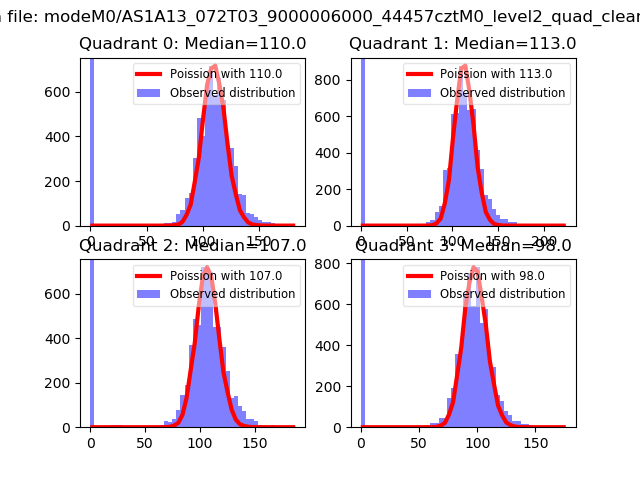 |
 |
| Quadrant-wise count rates Data is divided into 100 sec bins |
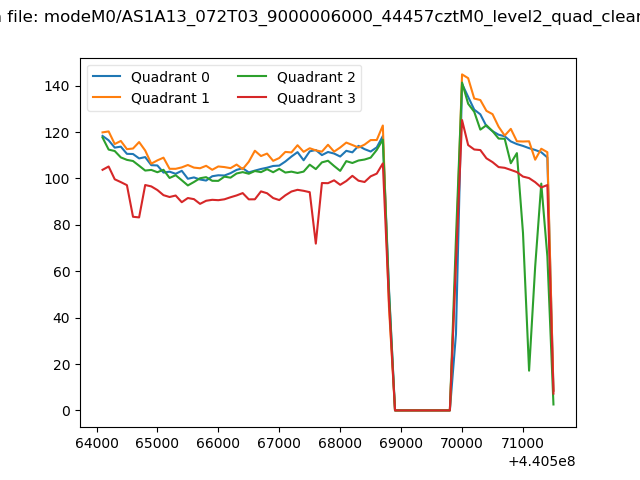 |
|
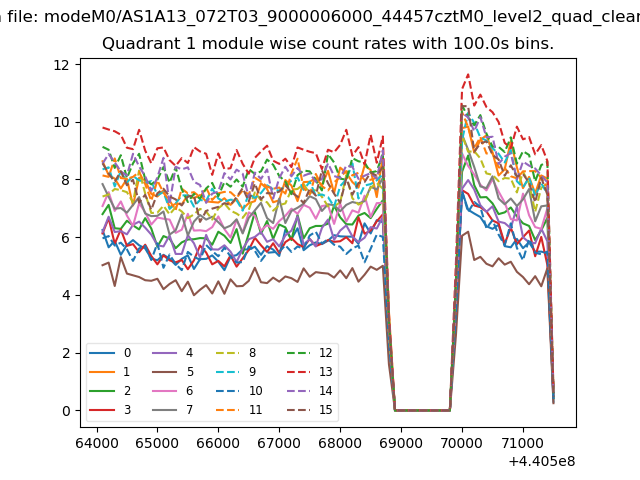
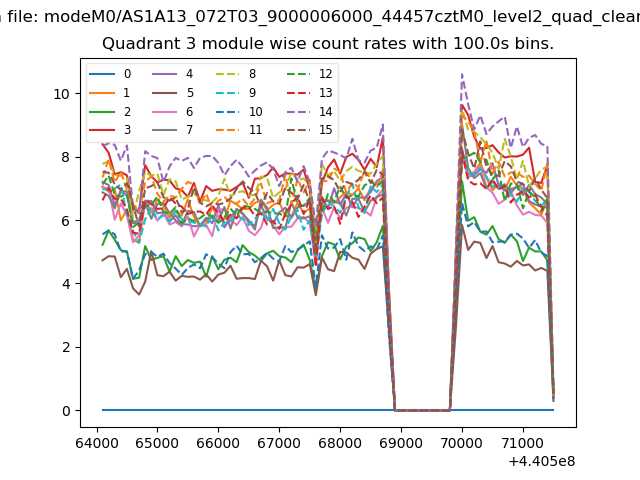
| Module-wise count rates for Quadrant A Data is divided into 100 sec bins |
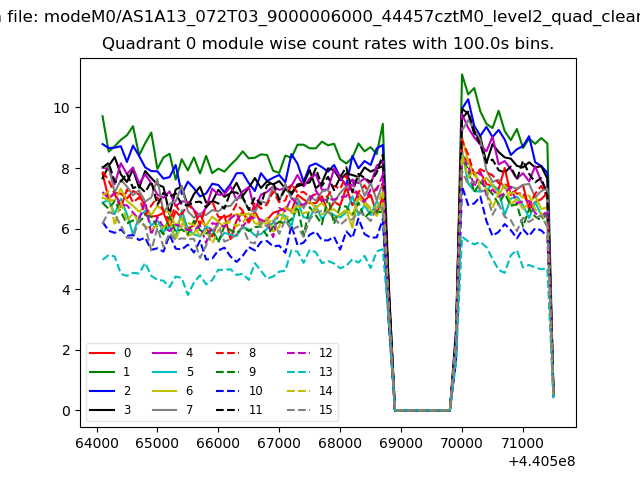 |
 |
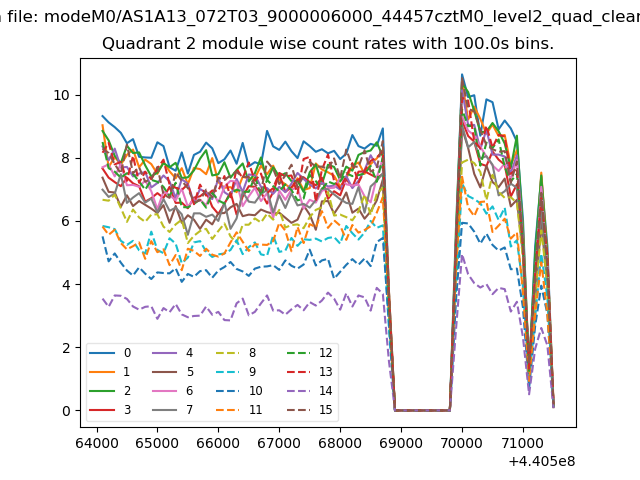
| Module-wise count rates for Quadrant B Data is divided into 100 sec bins |
 |
 |
| Module-wise count rates for Quadrant C Data is divided into 100 sec bins |
 |
 |
| Module-wise count rates for Quadrant D Data is divided into 100 sec bins |
 |
 |
| Parameter | Plot |
|---|---|
| CZT HV Monitor | 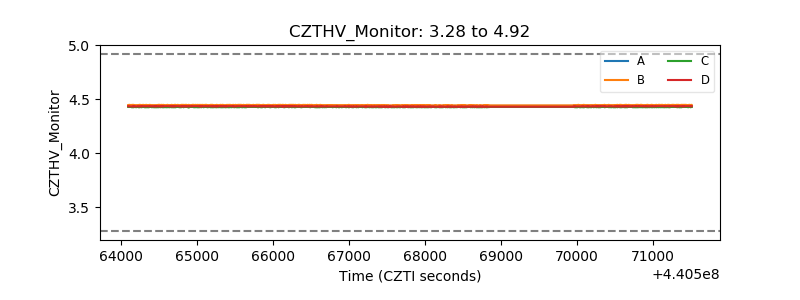 |
| D_VDD | 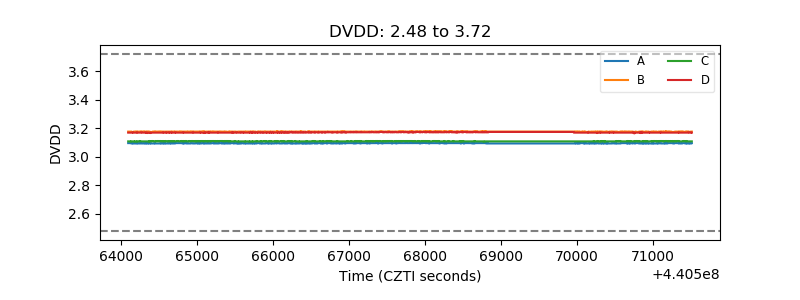 |
| Temperature 1 | 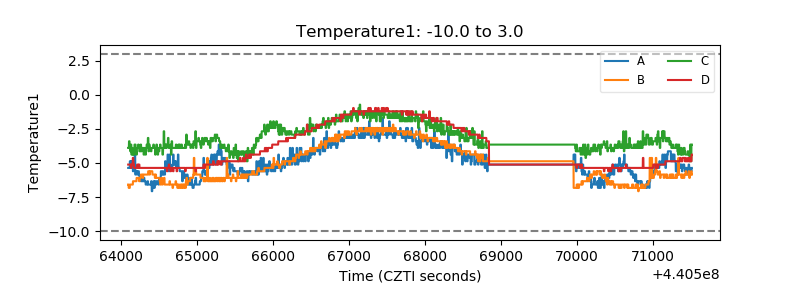 |
| Veto HV Monitor | 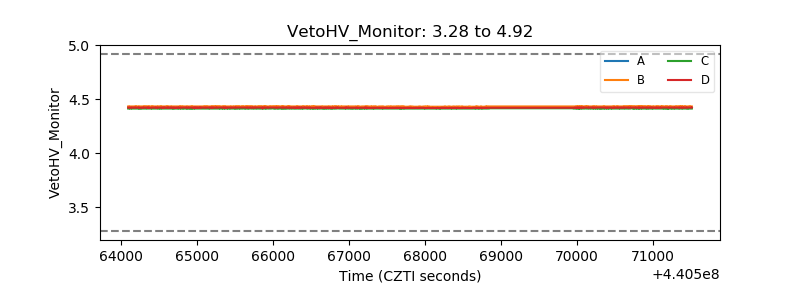 |
| Veto LLD | 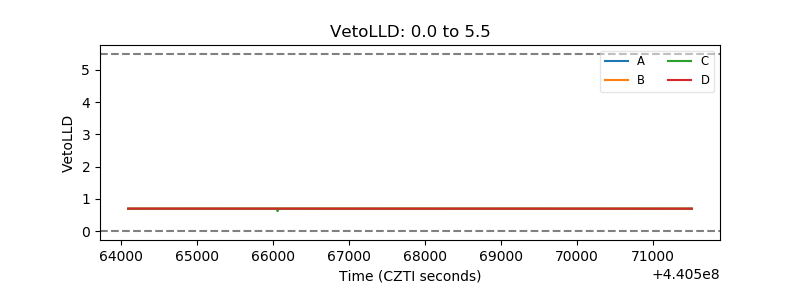 |
| Alpha Counter | 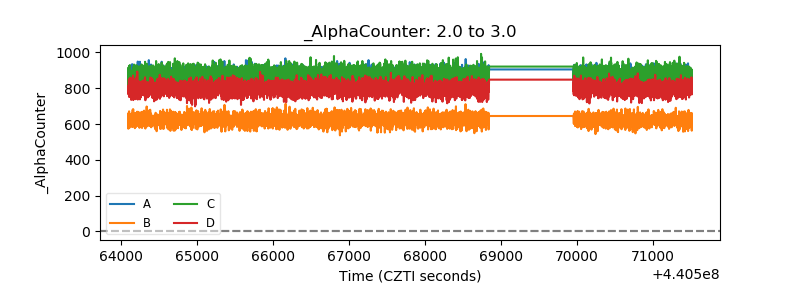 |
| _CPM_Rate | 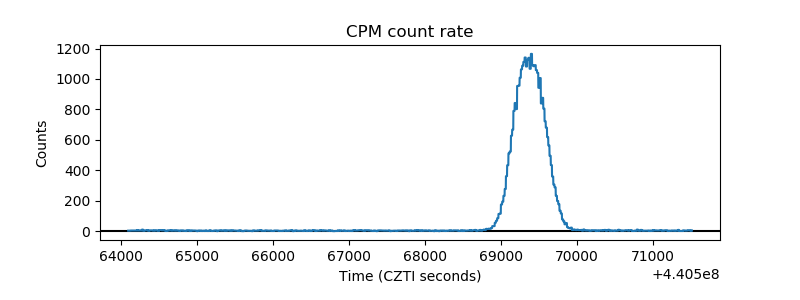 |
| CZT Counter | 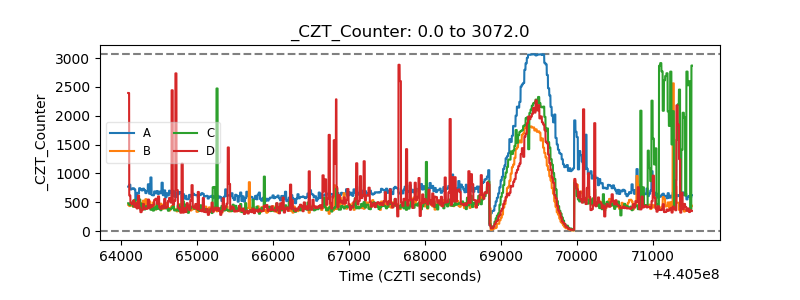 |
| +2.5 Volts monitor | 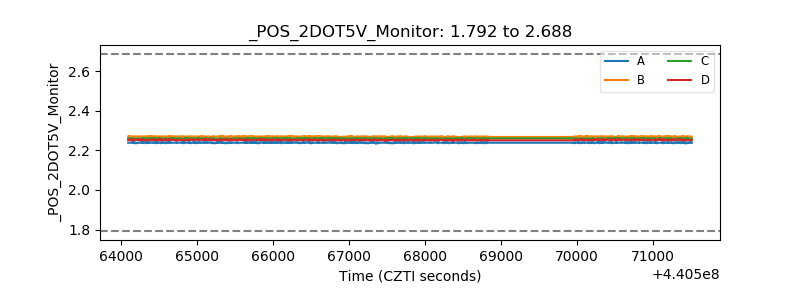 |
| +5 Volts monitor | 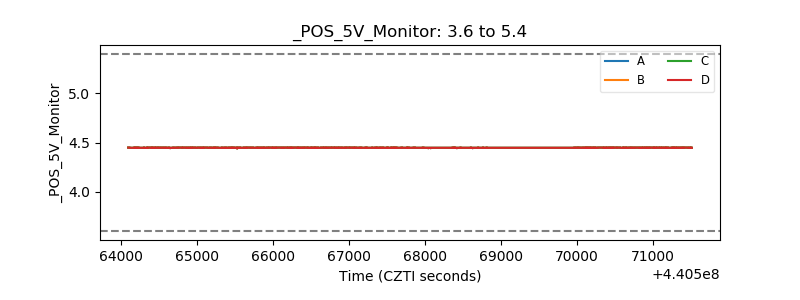 |
| _ROLL_ROT | 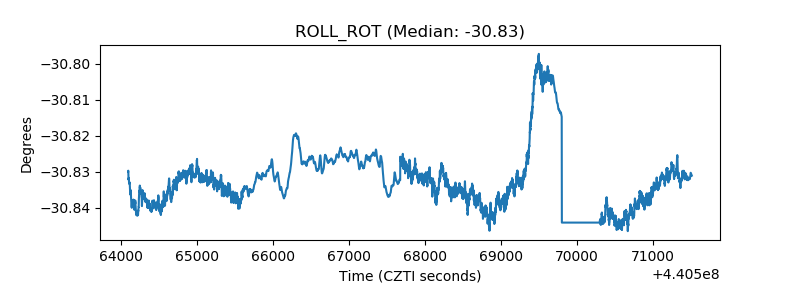 |
| _Roll_DEC | 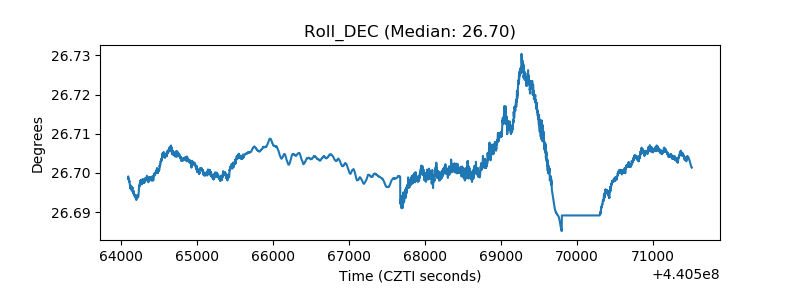 |
| _Roll_RA | 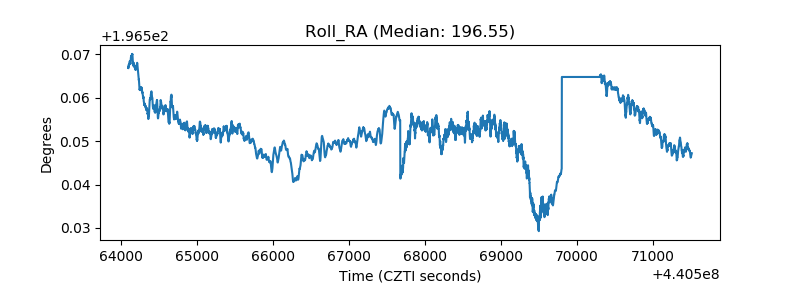 |
| Veto Counter | 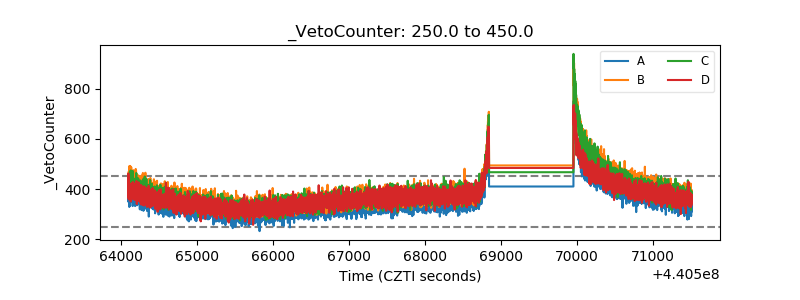 |