| Param | Original file | Final file |
|---|---|---|
| Filename | modeM0/AS1A13_072T03_9000006000_44472cztM0_level2.fits | modeM0/AS1A13_072T03_9000006000_44472cztM0_level2_quad_clean.evt |
| Size (bytes) | 374,610,240 | 103,187,520 |
| Size | 357.3 MB | 98.4 MB |
| Events in quadrant A | 4,225,111 | 689,774 |
| Events in quadrant B | 2,825,540 | 714,452 |
| Events in quadrant C | 2,884,943 | 677,117 |
| Events in quadrant D | 3,451,315 | 612,760 |
| Mode SS | |||
|---|---|---|---|
| Quadrant | BADHDUFLAG | Total packets | Discarded packets |
| A | 0 | 126 | 0 |
| B | 0 | 126 | 0 |
| C | 0 | 126 | 2 |
| D | 0 | 126 | 0 |
| Mode M9 | |||
|---|---|---|---|
| Quadrant | BADHDUFLAG | Total packets | Discarded packets |
| A | 0 | 11 | 0 |
| B | 0 | 11 | 0 |
| C | 0 | 11 | 0 |
| D | 0 | 11 | 0 |
| Mode M0 | |||
|---|---|---|---|
| Quadrant | BADHDUFLAG | Total packets | Discarded packets |
| A | 0 | 17667 | 22 |
| B | 0 | 12812 | 6 |
| C | 0 | 12961 | 5 |
| D | 0 | 14737 | 5 |
| Quadrant | Total seconds | Saturated seconds | Saturation percentage |
|---|---|---|---|
| A | 6164 | 81 | 1.314082% |
| B | 6167 | 81 | 1.313443% |
| C | 6167 | 45 | 0.729690% |
| D | 6167 | 126 | 2.043133% |
Noise dominated data is calculated using 1-second bins in cleaned event files. If a bin has >2000 counts, and if more than 50% of those come from <1% of pixels, then it is considered to be noise-dominated and hence unusable.
| Quadrant | # 1 sec bins | Bins with >0 counts | Bins with >2000 counts | High rate bins dominated by noise | Noise dominated (total time) | Noise dominated (detector-on time) | Marked lightcurve |
|---|---|---|---|---|---|---|---|
| A | 7308 | 6169 | 5 | 5 | 0.07% | 0.08% | 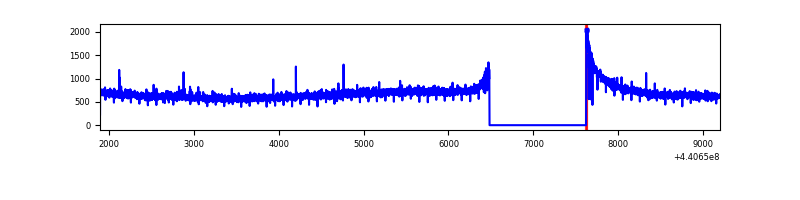 |
| B | 7309 | 6170 | 11 | 11 | 0.15% | 0.18% | 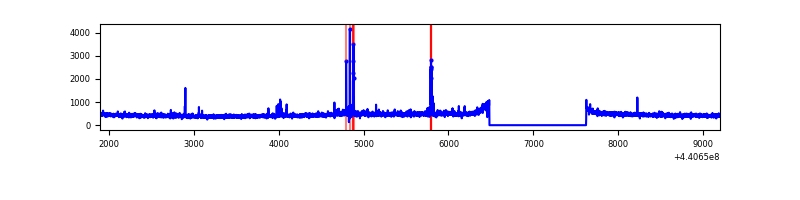 |
| C | 7309 | 6170 | 2 | 2 | 0.03% | 0.03% | 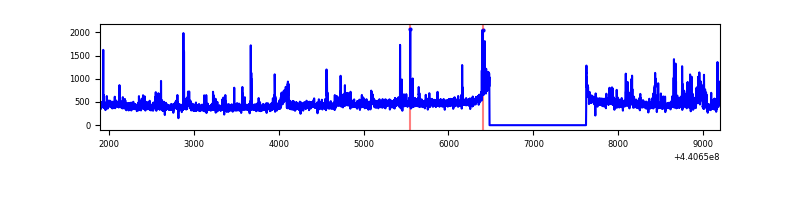 |
| D | 7309 | 6170 | 81 | 81 | 1.11% | 1.31% | 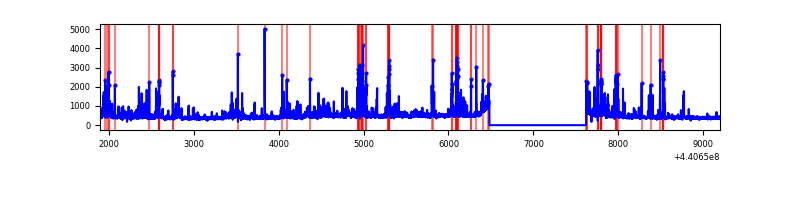 |
Top three noisy pixels from each quadrant. If the there are fewer than three noisy pixels in the level2.evt file, extra rows are filled as -1
| Pixel properties | Quadrant properties | ||||||
|---|---|---|---|---|---|---|---|
| Quadrant | DetID | PixID | Counts | Sigma | Mean | Median | Sigma |
| A | 10 | 83 | 1557275 | 10966.26 | 688 | 675 | 141.9 |
| A | 3 | 137 | 7547 | 48.41 | 688 | 675 | 141.9 |
| A | 0 | 243 | 7270 | 46.46 | 688 | 675 | 141.9 |
| B | 5 | 172 | 45881 | 334.29 | 687 | 665 | 135.3 |
| B | 0 | 229 | 28400 | 205.05 | 687 | 665 | 135.3 |
| B | 0 | 168 | 23717 | 170.43 | 687 | 665 | 135.3 |
| C | 2 | 14 | 93073 | 585.44 | 672 | 677 | 157.8 |
| C | 3 | 233 | 72745 | 456.64 | 672 | 677 | 157.8 |
| C | 14 | 254 | 66328 | 415.98 | 672 | 677 | 157.8 |
| D | 13 | 249 | 358489 | 2168.2 | 663 | 644 | 165.0 |
| D | 2 | 249 | 271142 | 1638.96 | 663 | 644 | 165.0 |
| D | 1 | 52 | 139653 | 842.26 | 663 | 644 | 165.0 |
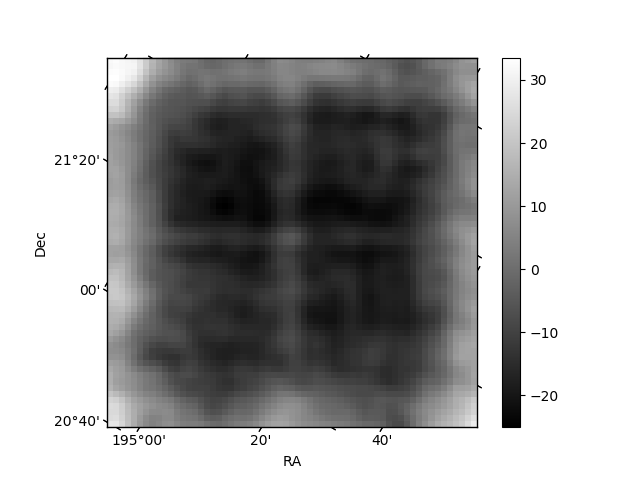
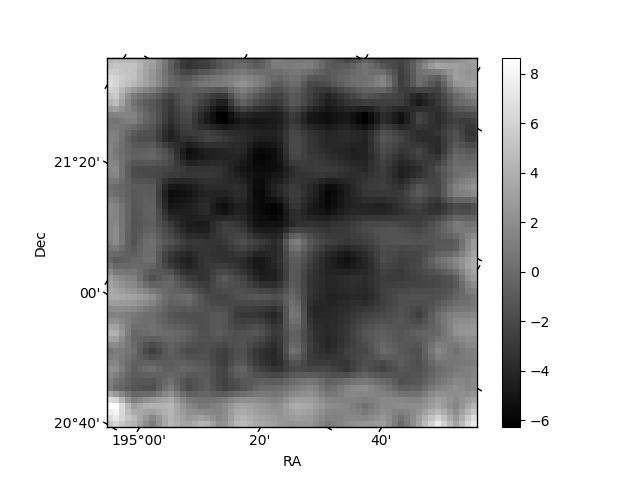
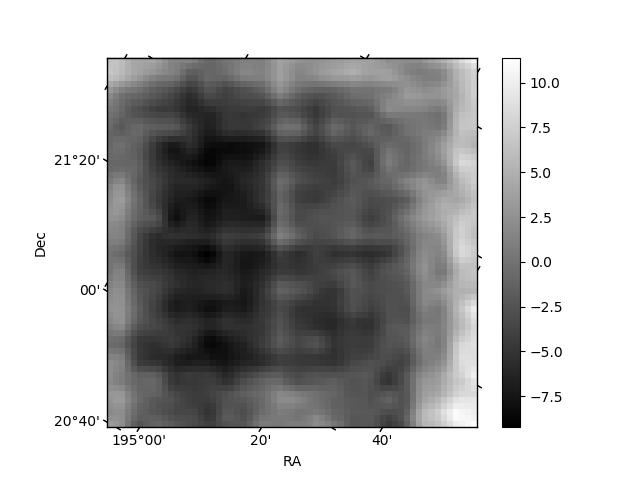
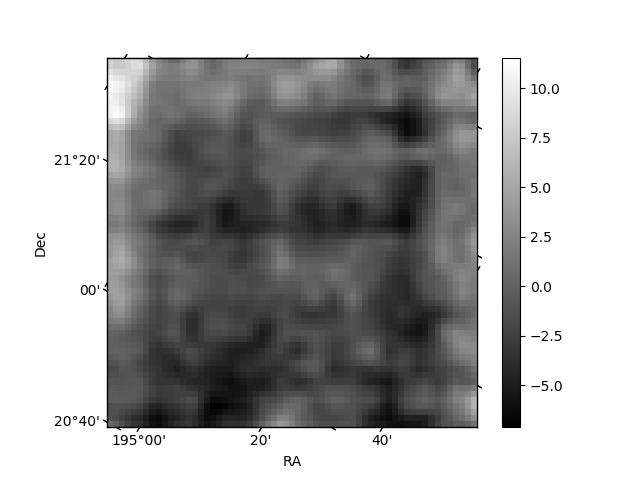
Histogram calculated using DETX and DETY for each event in the final _common_clean file
| Quadrant A | 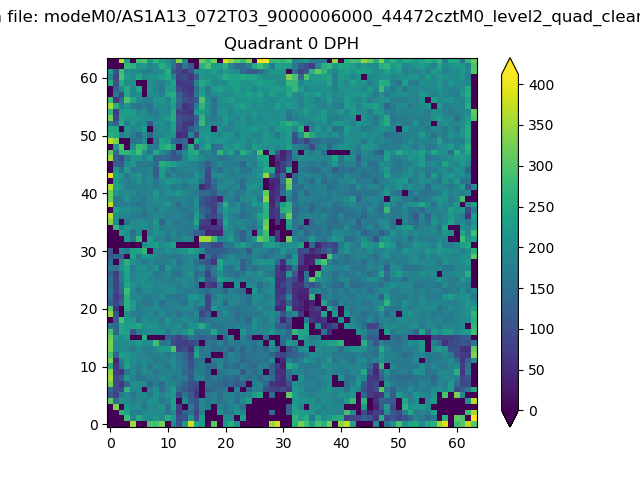 |
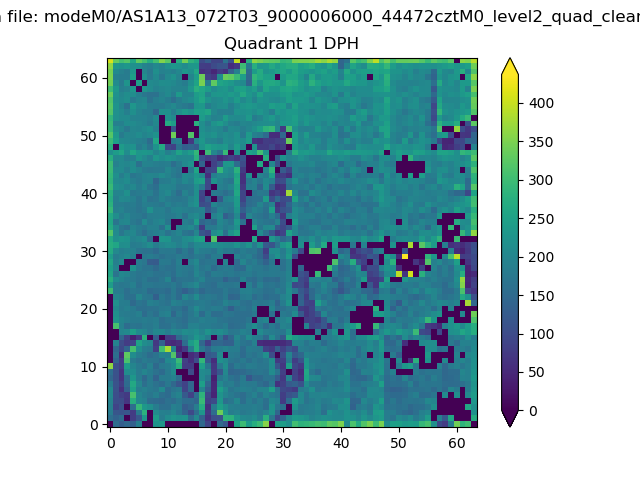 |
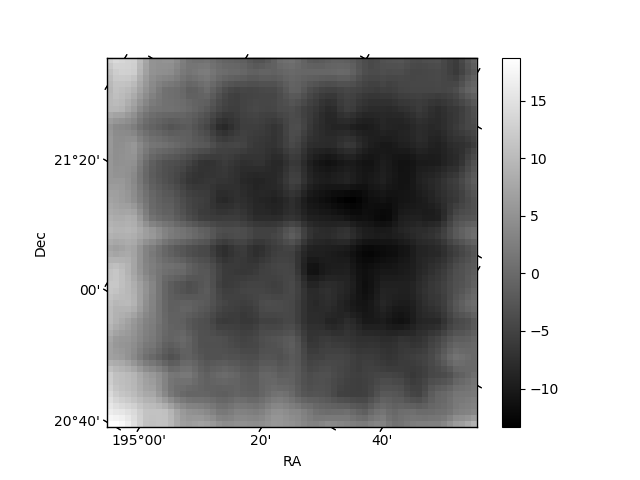
Quadrant B |
|---|---|---|---|
| Quadrant D | 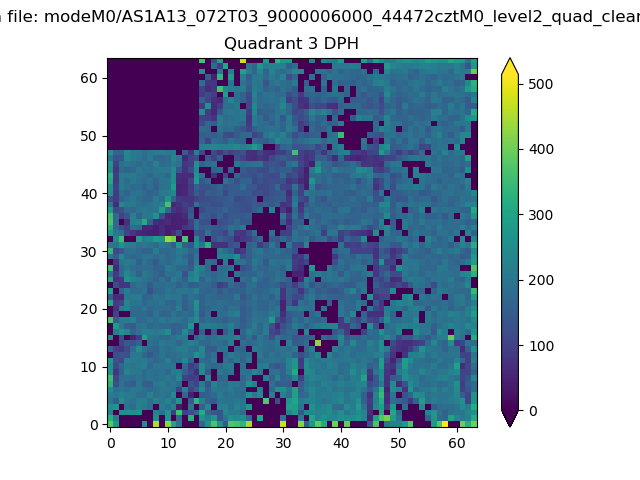 |
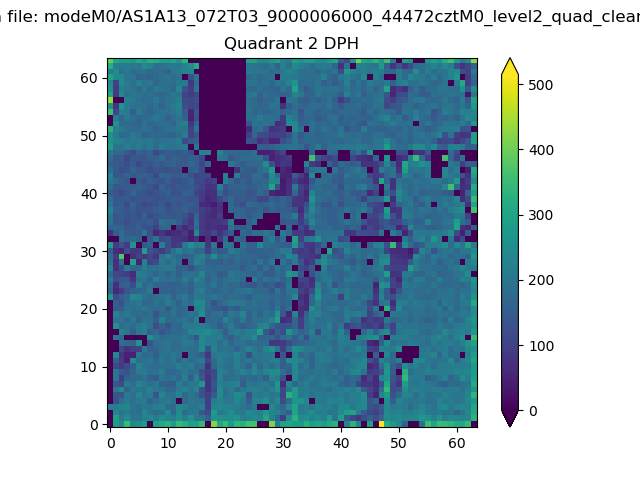 |
Quadrant C |
| Plot type | Count rate plots | Images |
|---|---|---|
| Comparison with Poisson distribution Blue bars denote a histogram of data divided into 1 sec bins. Red curve is a Poisson curve with rate = median count rate of data. |
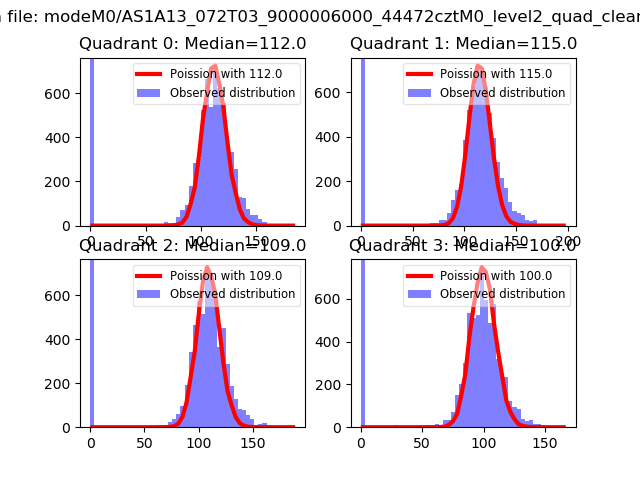 |
 |
| Quadrant-wise count rates Data is divided into 100 sec bins |
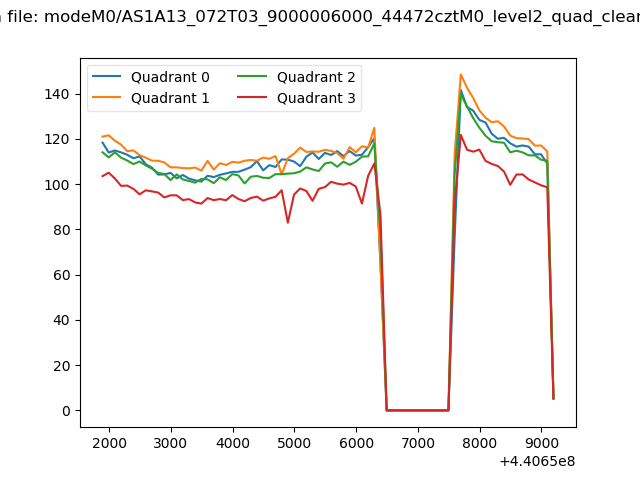 |
|
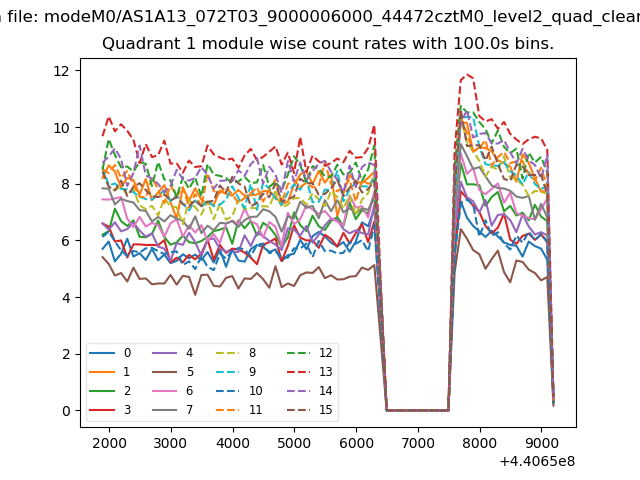
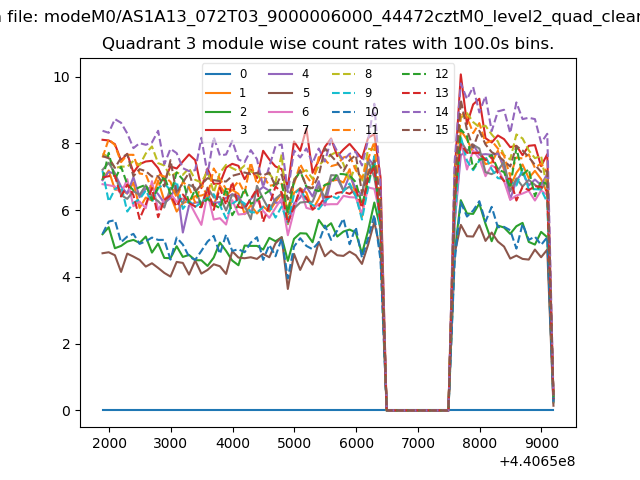
| Module-wise count rates for Quadrant A Data is divided into 100 sec bins |
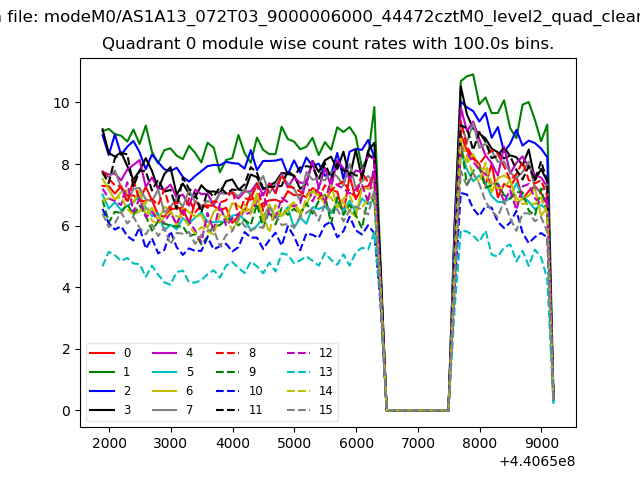 |
 |
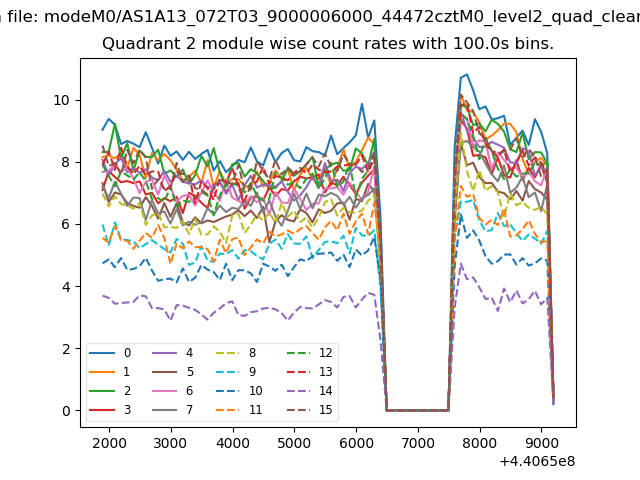
| Module-wise count rates for Quadrant B Data is divided into 100 sec bins |
 |
 |
| Module-wise count rates for Quadrant C Data is divided into 100 sec bins |
 |
 |
| Module-wise count rates for Quadrant D Data is divided into 100 sec bins |
 |
 |
| Parameter | Plot |
|---|---|
| CZT HV Monitor |  |
| D_VDD | 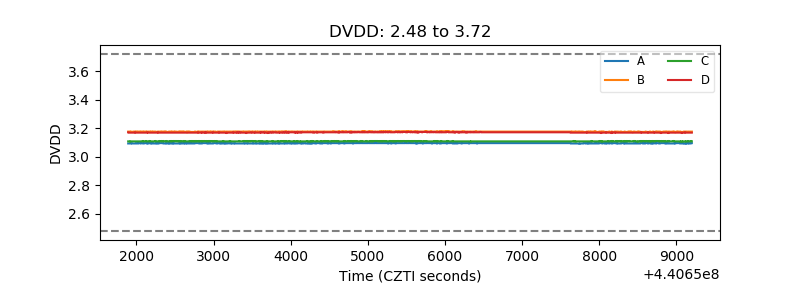 |
| Temperature 1 | 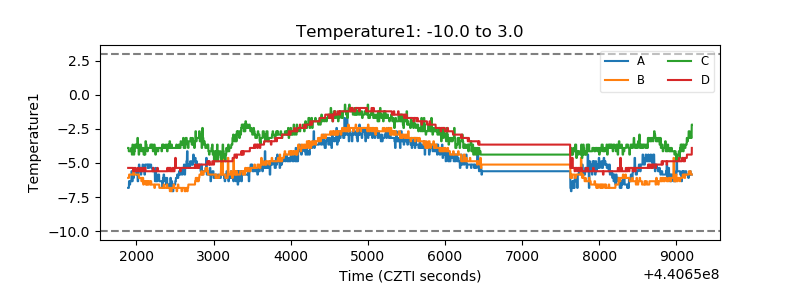 |
| Veto HV Monitor | 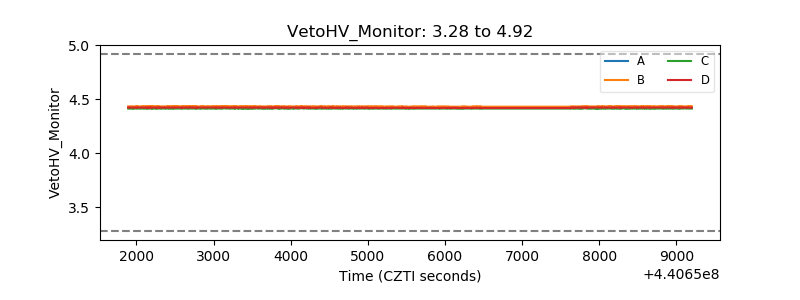 |
| Veto LLD | 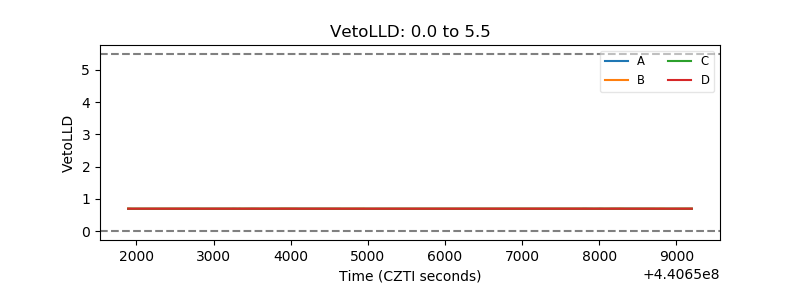 |
| Alpha Counter | 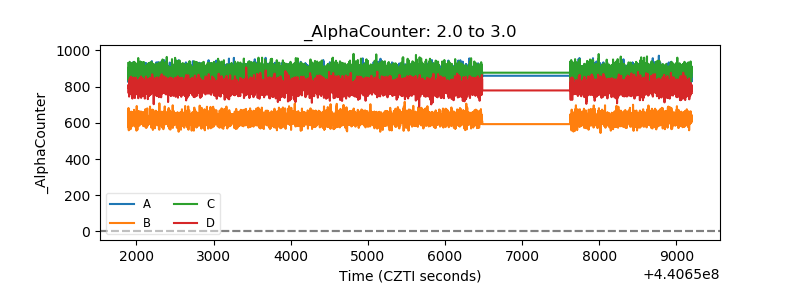 |
| _CPM_Rate | 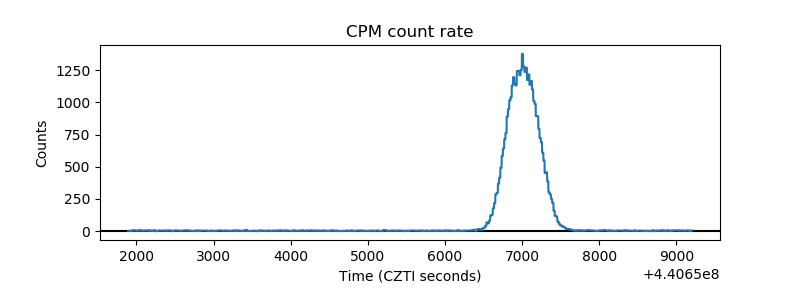 |
| CZT Counter | 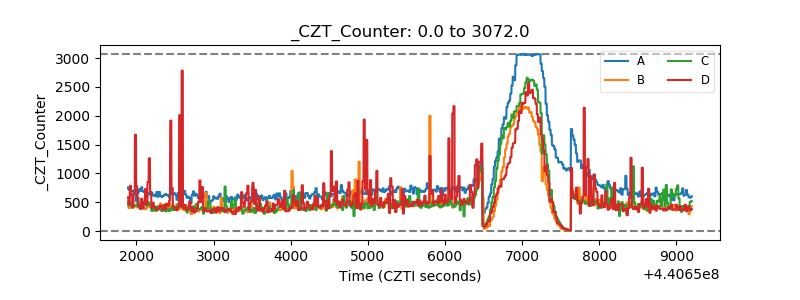 |
| +2.5 Volts monitor | 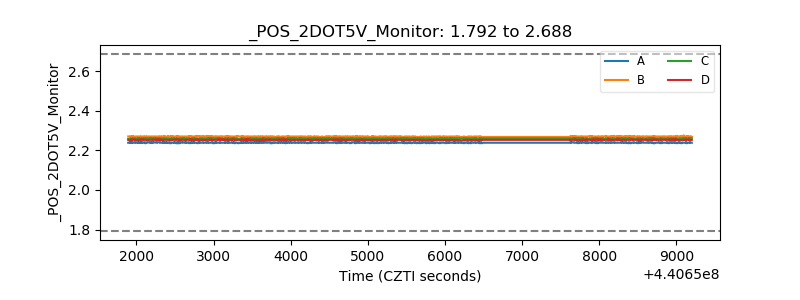 |
| +5 Volts monitor | 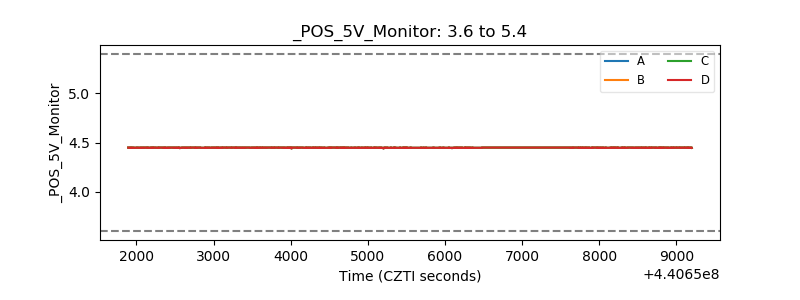 |
| _ROLL_ROT | 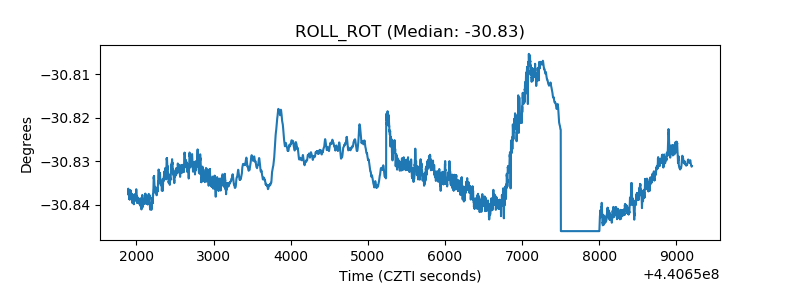 |
| _Roll_DEC | 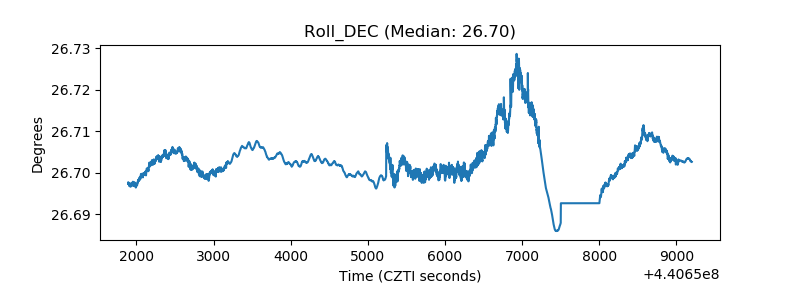 |
| _Roll_RA | 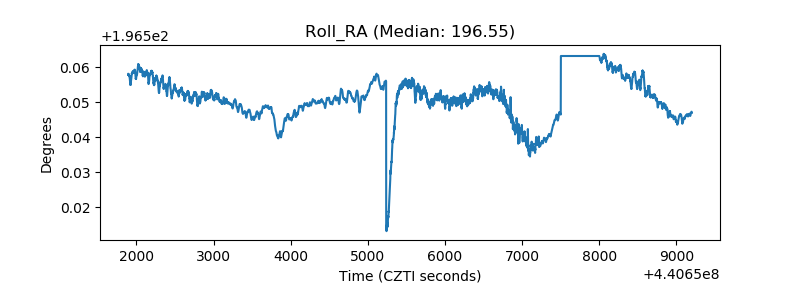 |
| Veto Counter | 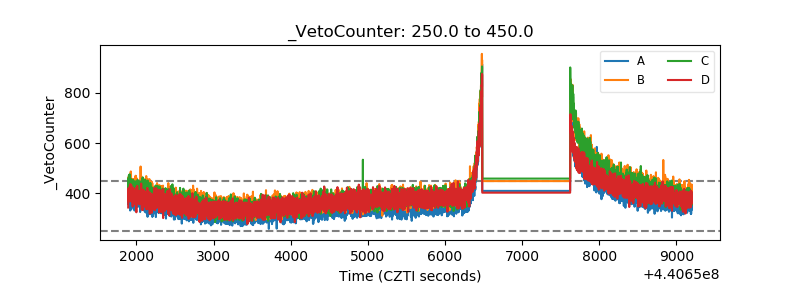 |