| Param | Original file | Final file |
|---|---|---|
| Filename | modeM0/AS1A13_072T03_9000006000_44476cztM0_level2.fits | modeM0/AS1A13_072T03_9000006000_44476cztM0_level2_quad_clean.evt |
| Size (bytes) | 218,088,000 | 52,246,080 |
| Size | 208.0 MB | 49.8 MB |
| Events in quadrant A | 2,264,002 | 337,029 |
| Events in quadrant B | 1,704,306 | 366,670 |
| Events in quadrant C | 1,592,237 | 345,438 |
| Events in quadrant D | 2,254,327 | 298,875 |
| Mode SS | |||
|---|---|---|---|
| Quadrant | BADHDUFLAG | Total packets | Discarded packets |
| A | 0 | 107 | 41 |
| B | 0 | 109 | 45 |
| C | 0 | 111 | 36 |
| D | 0 | 110 | 40 |
| Mode M9 | |||
|---|---|---|---|
| Quadrant | BADHDUFLAG | Total packets | Discarded packets |
| A | 0 | 9 | 3 |
| B | 0 | 10 | 3 |
| C | 0 | 9 | 2 |
| D | 0 | 9 | 3 |
| Mode M0 | |||
|---|---|---|---|
| Quadrant | BADHDUFLAG | Total packets | Discarded packets |
| A | 0 | 16150 | 6488 |
| B | 0 | 11798 | 4428 |
| C | 0 | 11264 | 4182 |
| D | 0 | 15026 | 6147 |
| Quadrant | Total seconds | Saturated seconds | Saturation percentage |
|---|---|---|---|
| A | 3211 | 72 | 2.242292% |
| B | 3350 | 55 | 1.641791% |
| C | 3338 | 26 | 0.778910% |
| D | 3237 | 136 | 4.201421% |
Noise dominated data is calculated using 1-second bins in cleaned event files. If a bin has >2000 counts, and if more than 50% of those come from <1% of pixels, then it is considered to be noise-dominated and hence unusable.
| Quadrant | # 1 sec bins | Bins with >0 counts | Bins with >2000 counts | High rate bins dominated by noise | Noise dominated (total time) | Noise dominated (detector-on time) | Marked lightcurve |
|---|---|---|---|---|---|---|---|
| A | 6710 | 3517 | 0 | 0 | 0.00% | 0.00% | 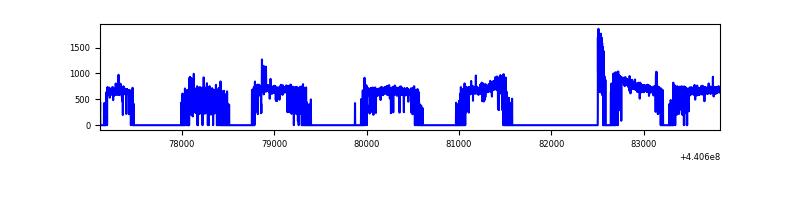 |
| B | 6696 | 3659 | 23 | 23 | 0.34% | 0.63% | 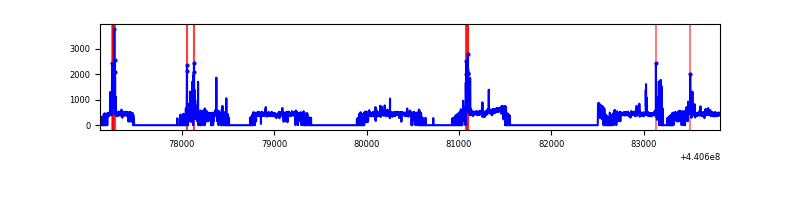 |
| C | 6710 | 3663 | 12 | 12 | 0.18% | 0.33% | 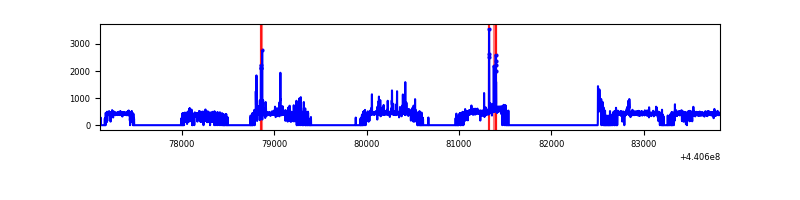 |
| D | 6709 | 3573 | 113 | 113 | 1.68% | 3.16% | 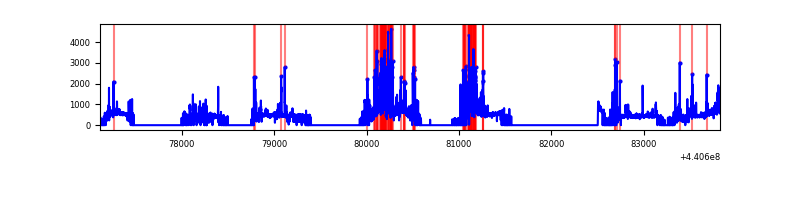 |
Top three noisy pixels from each quadrant. If the there are fewer than three noisy pixels in the level2.evt file, extra rows are filled as -1
| Pixel properties | Quadrant properties | ||||||
|---|---|---|---|---|---|---|---|
| Quadrant | DetID | PixID | Counts | Sigma | Mean | Median | Sigma |
| A | 10 | 83 | 833999 | 10648.04 | 368 | 359 | 78.3 |
| A | 0 | 243 | 8846 | 108.4 | 368 | 359 | 78.3 |
| A | 3 | 137 | 4172 | 48.7 | 368 | 359 | 78.3 |
| B | 5 | 172 | 162780 | 2114.31 | 379 | 367 | 76.8 |
| B | 0 | 229 | 24218 | 310.49 | 379 | 367 | 76.8 |
| B | 12 | 111 | 9520 | 119.15 | 379 | 367 | 76.8 |
| C | 14 | 254 | 57297 | 631.6 | 373 | 374 | 90.1 |
| C | 15 | 208 | 48761 | 536.89 | 373 | 374 | 90.1 |
| C | 3 | 233 | 23033 | 251.42 | 373 | 374 | 90.1 |
| D | 1 | 52 | 380319 | 4130.65 | 360 | 348 | 92.0 |
| D | 13 | 249 | 194662 | 2112.38 | 360 | 348 | 92.0 |
| D | 5 | 235 | 96233 | 1042.36 | 360 | 348 | 92.0 |
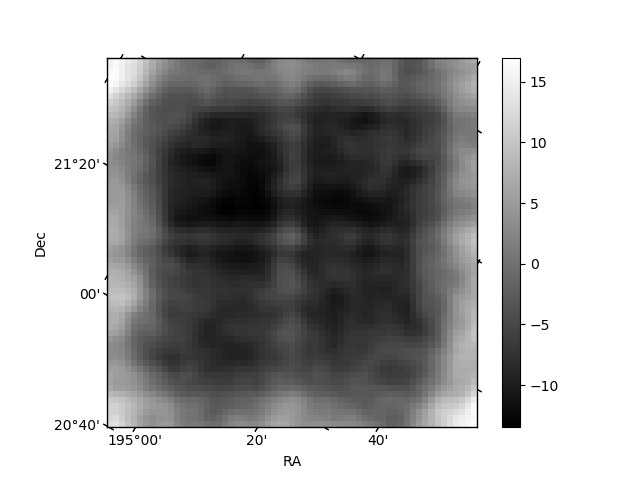
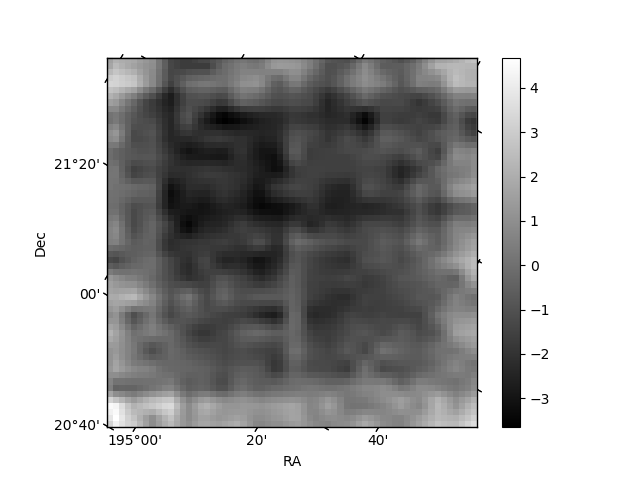
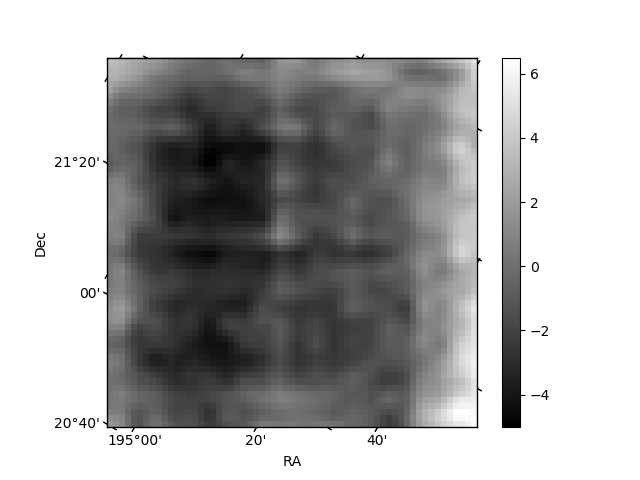
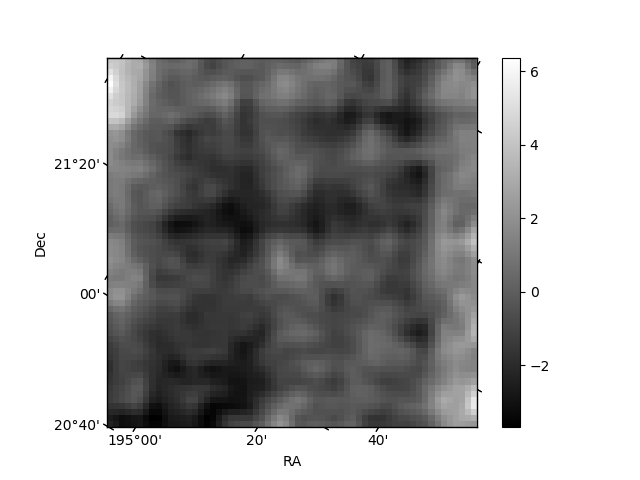
Histogram calculated using DETX and DETY for each event in the final _common_clean file
| Quadrant A | 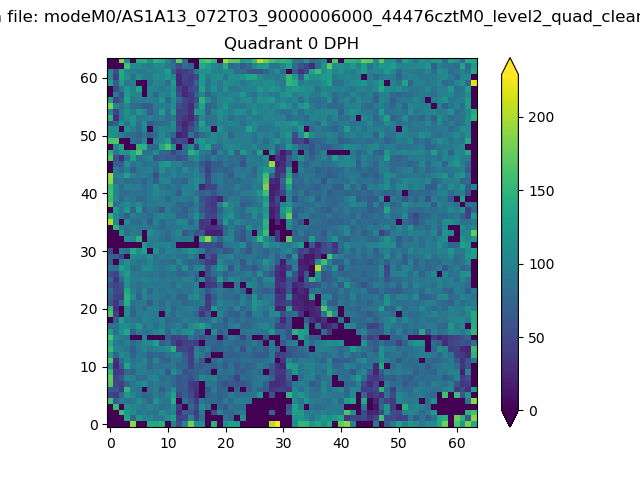 |
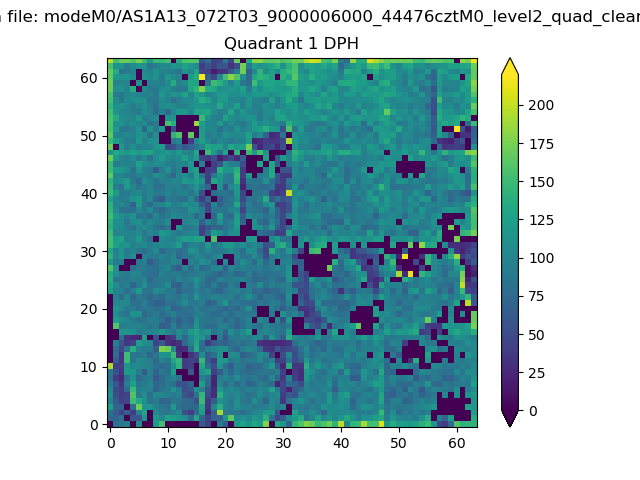 |
Quadrant B |
|---|---|---|---|
| Quadrant D | 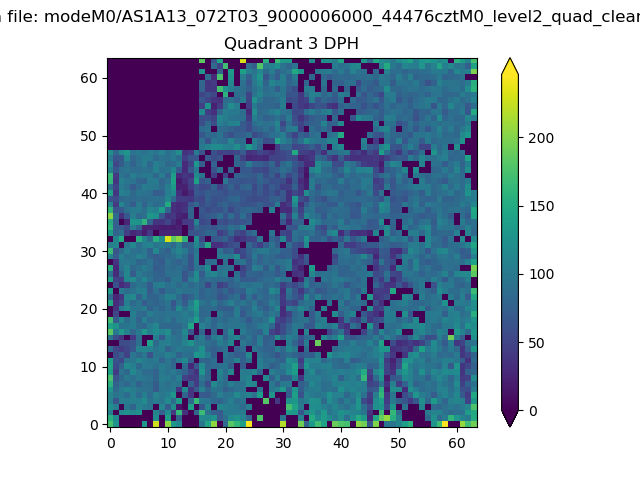 |
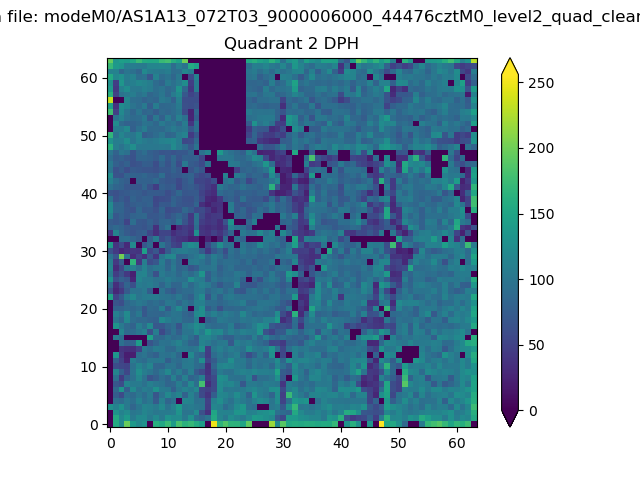 |
Quadrant C |
| Plot type | Count rate plots | Images |
|---|---|---|
| Comparison with Poisson distribution Blue bars denote a histogram of data divided into 1 sec bins. Red curve is a Poisson curve with rate = median count rate of data. |
 |
 |
| Quadrant-wise count rates Data is divided into 100 sec bins |
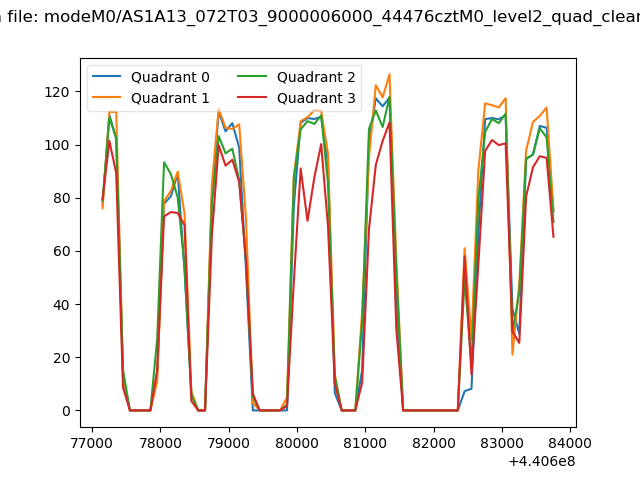 |
|
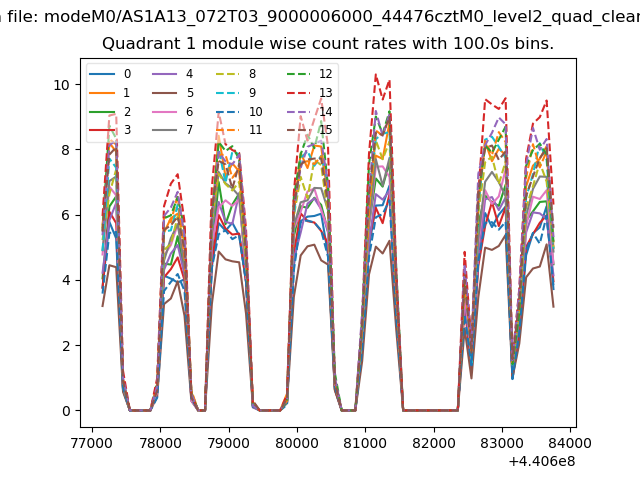
| Module-wise count rates for Quadrant A Data is divided into 100 sec bins |
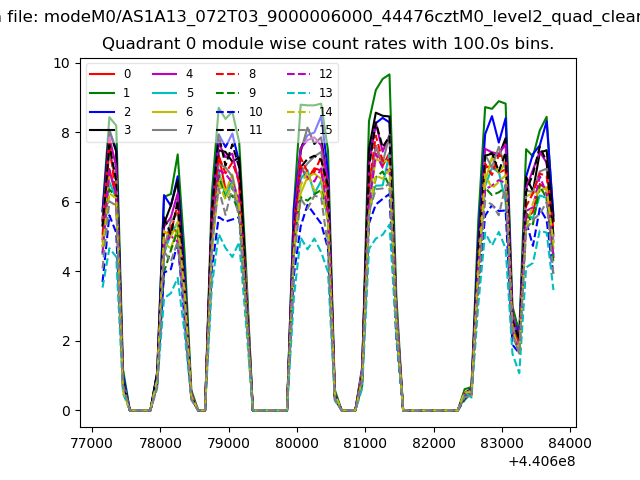 |
 |
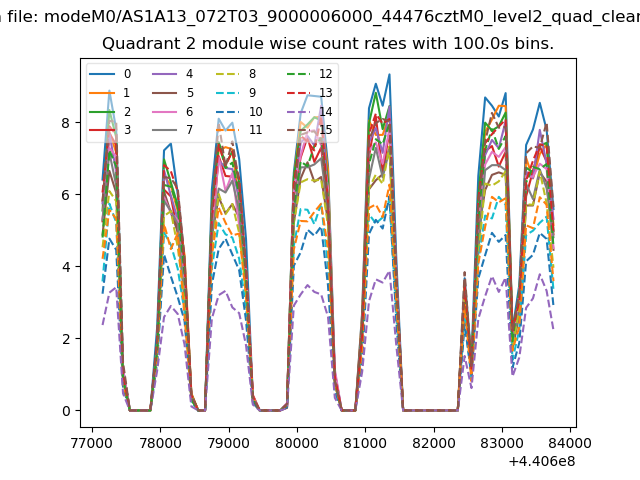
| Module-wise count rates for Quadrant B Data is divided into 100 sec bins |
 |
 |
| Module-wise count rates for Quadrant C Data is divided into 100 sec bins |
 |
 |
| Module-wise count rates for Quadrant D Data is divided into 100 sec bins |
 |
 |
| Parameter | Plot |
|---|---|
| CZT HV Monitor |  |
| D_VDD | 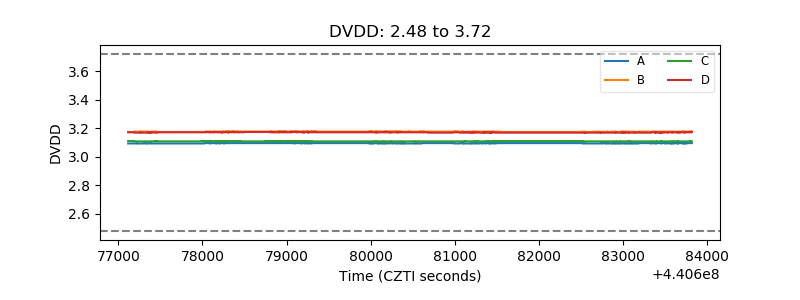 |
| Temperature 1 | 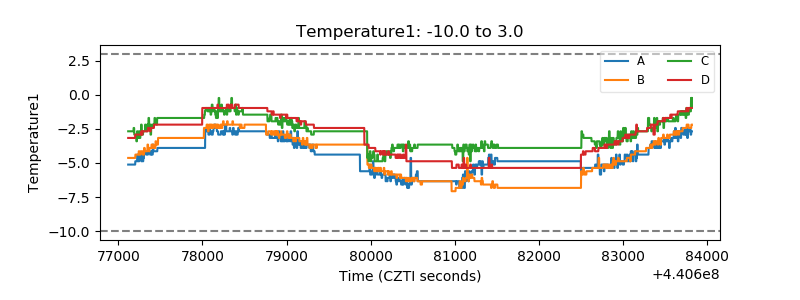 |
| Veto HV Monitor | 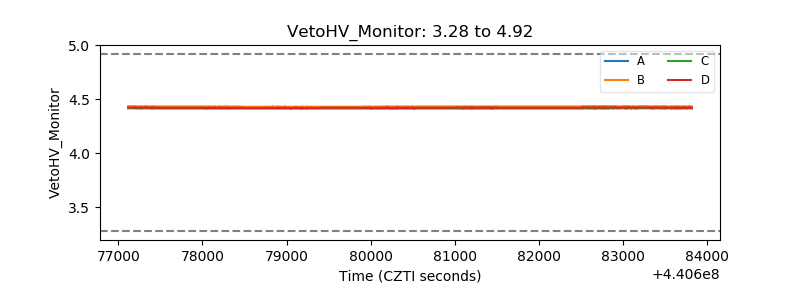 |
| Veto LLD | 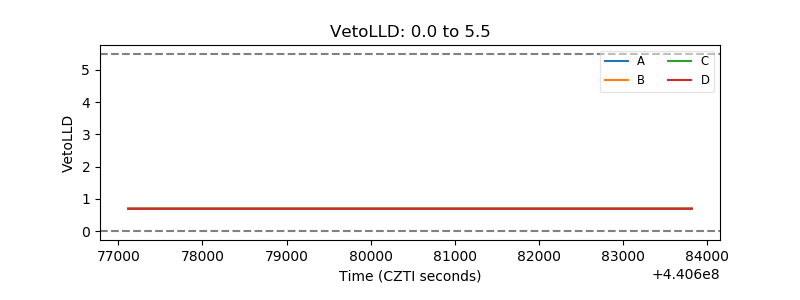 |
| Alpha Counter | 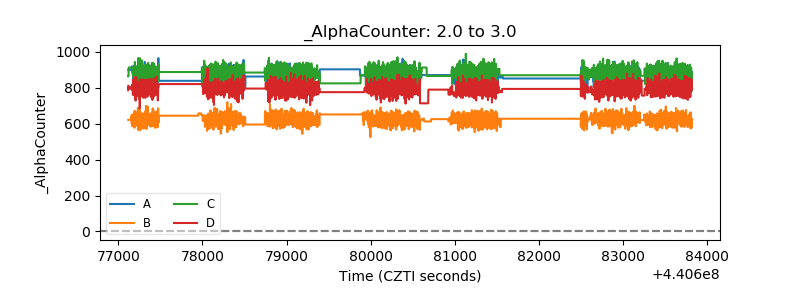 |
| _CPM_Rate | 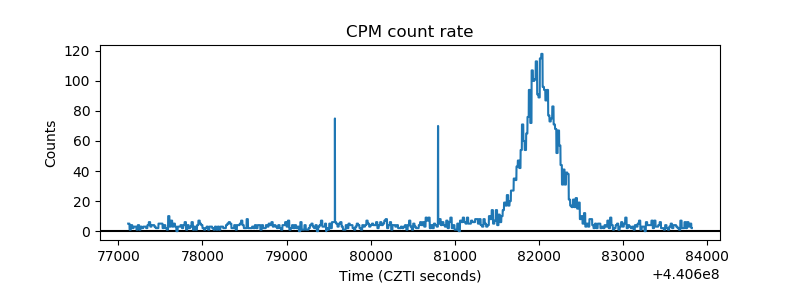 |
| CZT Counter | 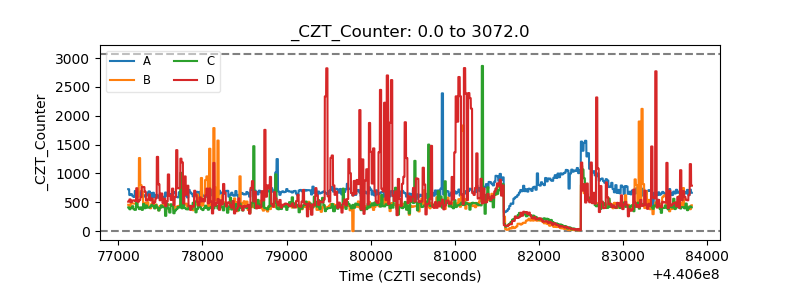 |
| +2.5 Volts monitor | 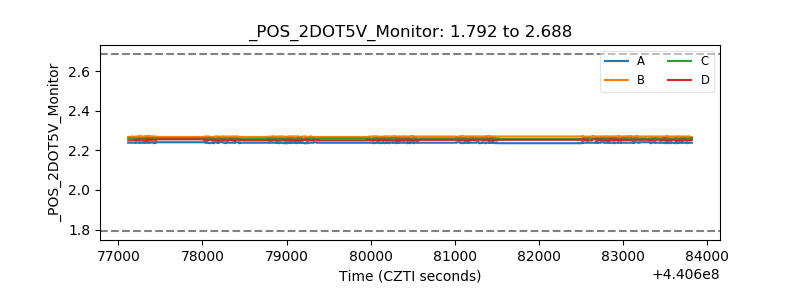 |
| +5 Volts monitor | 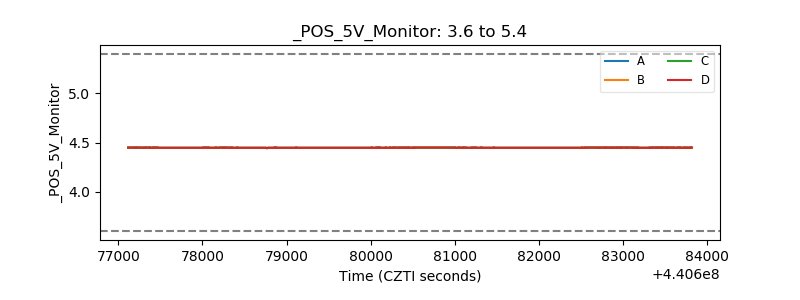 |
| _ROLL_ROT | 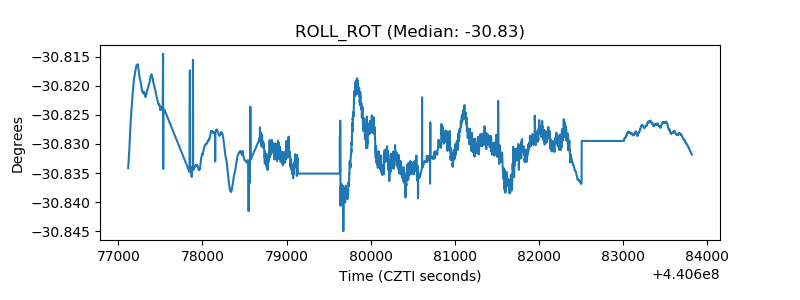 |
| _Roll_DEC | 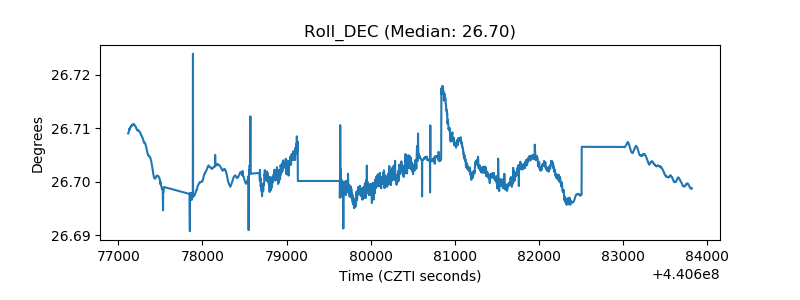 |
| _Roll_RA | 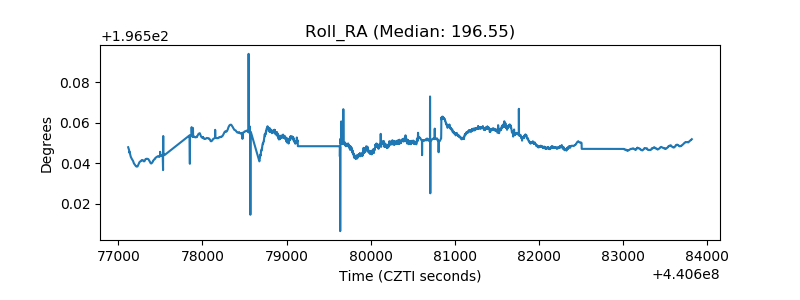 |
| Veto Counter | 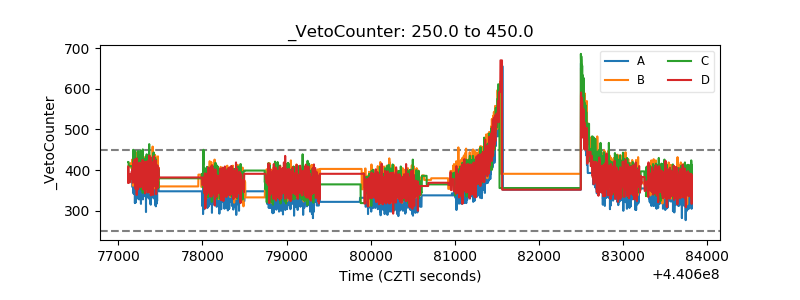 |