| Param | Original file | Final file |
|---|---|---|
| Filename | modeM0/AS1A13_072T03_9000006000_44477cztM0_level2.fits | modeM0/AS1A13_072T03_9000006000_44477cztM0_level2_quad_clean.evt |
| Size (bytes) | 405,993,600 | 91,186,560 |
| Size | 387.2 MB | 87.0 MB |
| Events in quadrant A | 4,041,882 | 603,606 |
| Events in quadrant B | 3,364,542 | 614,280 |
| Events in quadrant C | 2,903,835 | 601,510 |
| Events in quadrant D | 4,258,095 | 528,370 |
| Mode SS | |||
|---|---|---|---|
| Quadrant | BADHDUFLAG | Total packets | Discarded packets |
| A | 0 | 140 | 20 |
| B | 0 | 137 | 15 |
| C | 0 | 137 | 13 |
| D | 0 | 138 | 17 |
| Mode M9 | |||
|---|---|---|---|
| Quadrant | BADHDUFLAG | Total packets | Discarded packets |
| A | 0 | 4 | 0 |
| B | 0 | 4 | 1 |
| C | 0 | 4 | 0 |
| D | 0 | 4 | 0 |
| Mode M0 | |||
|---|---|---|---|
| Quadrant | BADHDUFLAG | Total packets | Discarded packets |
| A | 0 | 20278 | 2920 |
| B | 0 | 16696 | 2533 |
| C | 0 | 14743 | 1912 |
| D | 0 | 19946 | 3290 |
| Quadrant | Total seconds | Saturated seconds | Saturation percentage |
|---|---|---|---|
| A | 5860 | 270 | 4.607509% |
| B | 5930 | 466 | 7.858347% |
| C | 5938 | 207 | 3.486022% |
| D | 5896 | 474 | 8.039349% |
Noise dominated data is calculated using 1-second bins in cleaned event files. If a bin has >2000 counts, and if more than 50% of those come from <1% of pixels, then it is considered to be noise-dominated and hence unusable.
| Quadrant | # 1 sec bins | Bins with >0 counts | Bins with >2000 counts | High rate bins dominated by noise | Noise dominated (total time) | Noise dominated (detector-on time) | Marked lightcurve |
|---|---|---|---|---|---|---|---|
| A | 7266 | 6064 | 0 | 0 | 0.00% | 0.00% | 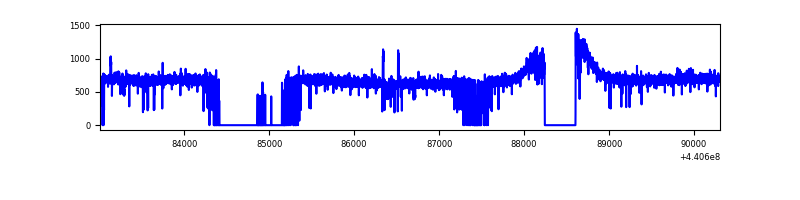 |
| B | 7294 | 6119 | 162 | 162 | 2.22% | 2.65% | 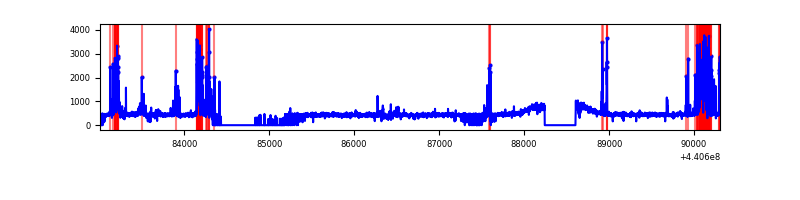 |
| C | 7291 | 6133 | 4 | 4 | 0.05% | 0.07% | 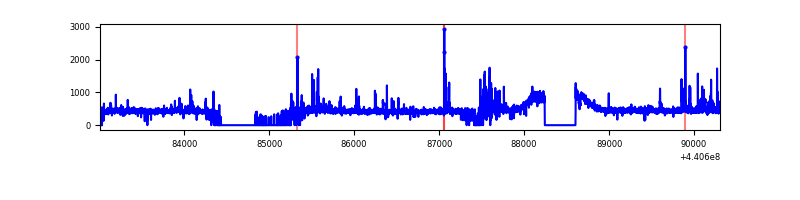 |
| D | 7287 | 6111 | 226 | 226 | 3.10% | 3.70% | 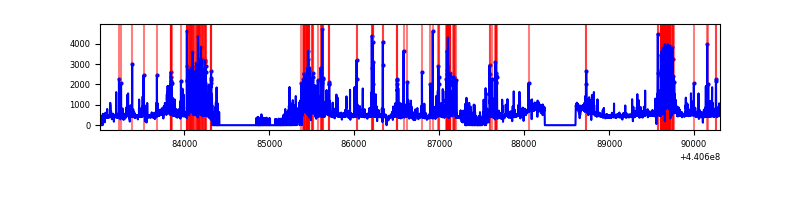 |
Top three noisy pixels from each quadrant. If the there are fewer than three noisy pixels in the level2.evt file, extra rows are filled as -1
| Pixel properties | Quadrant properties | ||||||
|---|---|---|---|---|---|---|---|
| Quadrant | DetID | PixID | Counts | Sigma | Mean | Median | Sigma |
| A | 10 | 83 | 1400522 | 9857.94 | 683 | 666 | 142.0 |
| A | 3 | 137 | 8114 | 52.45 | 683 | 666 | 142.0 |
| A | 0 | 243 | 6212 | 39.06 | 683 | 666 | 142.0 |
| B | 5 | 172 | 664956 | 4945.27 | 672 | 651 | 134.3 |
| B | 0 | 229 | 22024 | 159.1 | 672 | 651 | 134.3 |
| B | 12 | 111 | 17358 | 124.37 | 672 | 651 | 134.3 |
| C | 3 | 233 | 62384 | 384.13 | 681 | 683 | 160.6 |
| C | 14 | 254 | 57227 | 352.02 | 681 | 683 | 160.6 |
| C | 2 | 14 | 53383 | 328.09 | 681 | 683 | 160.6 |
| D | 13 | 249 | 695209 | 4116.65 | 669 | 648 | 168.7 |
| D | 5 | 235 | 385113 | 2278.71 | 669 | 648 | 168.7 |
| D | 12 | 233 | 232651 | 1375.08 | 669 | 648 | 168.7 |
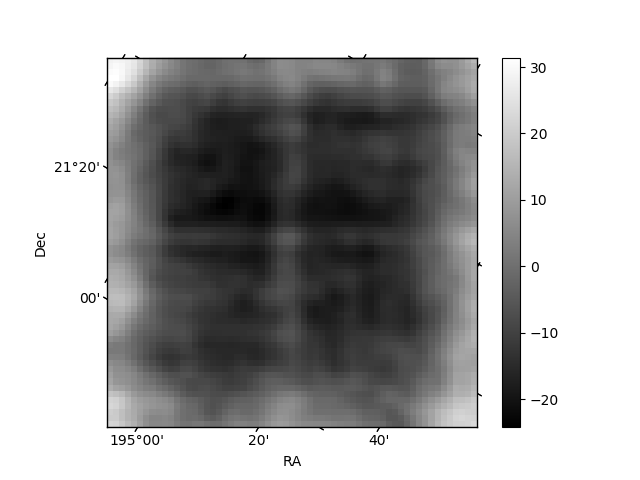
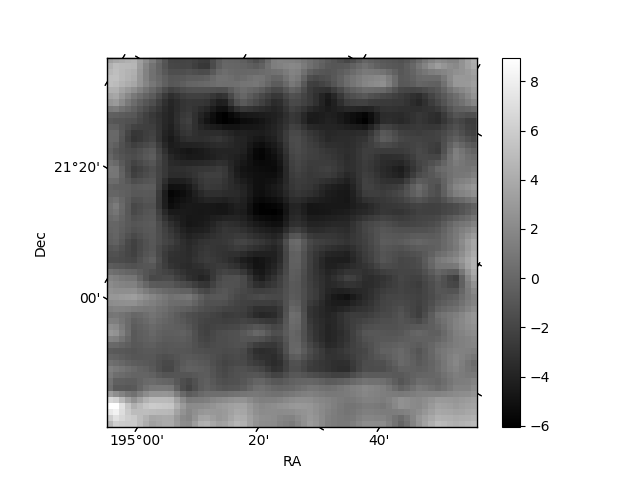
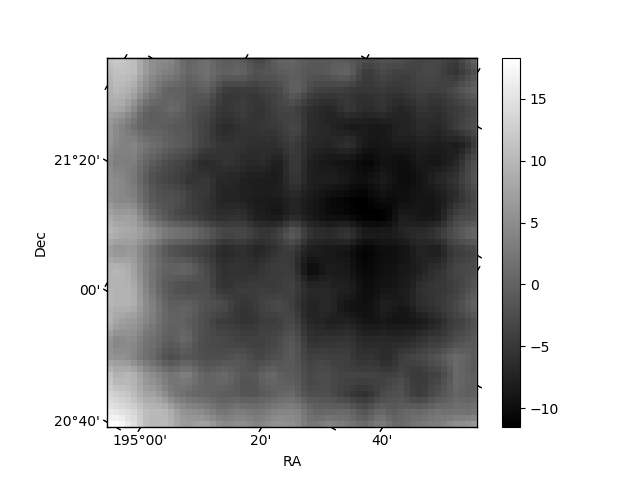
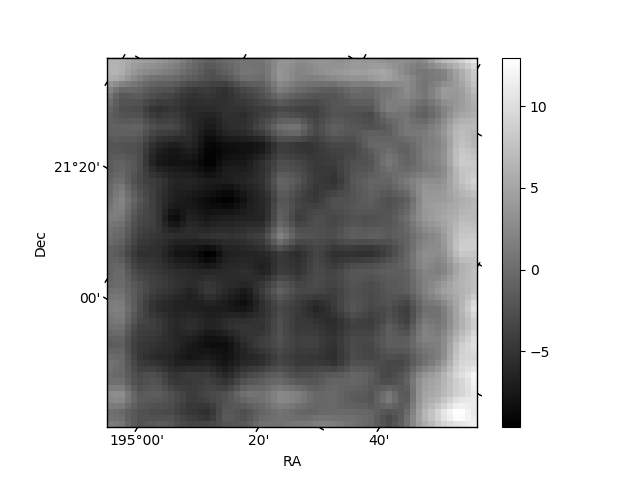
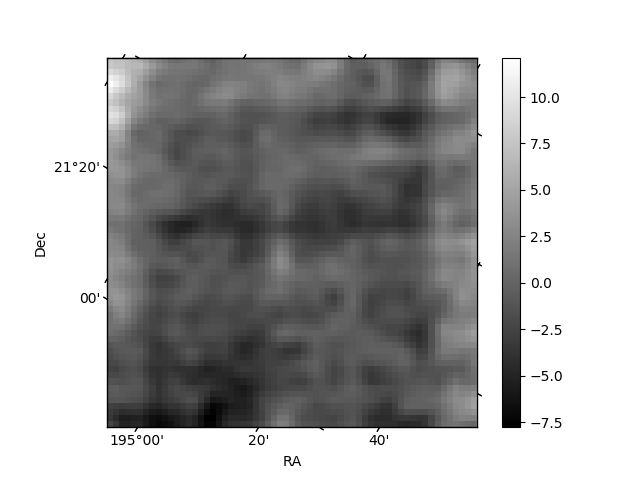
Histogram calculated using DETX and DETY for each event in the final _common_clean file
| Quadrant A | 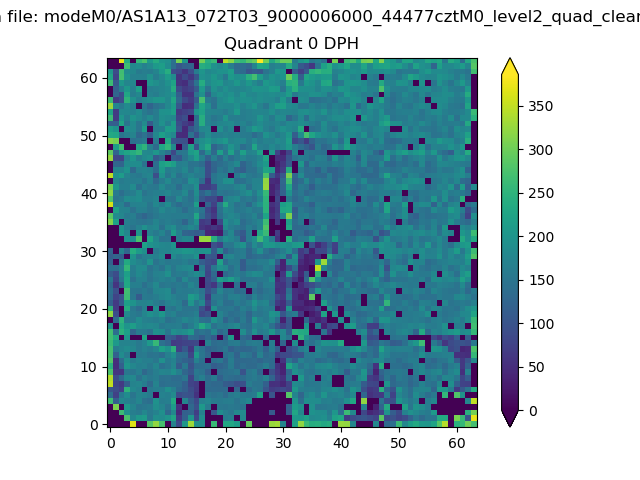 |
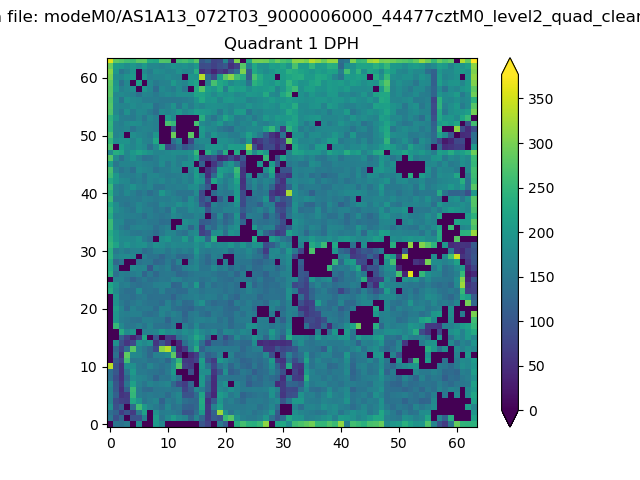 |
Quadrant B |
|---|---|---|---|
| Quadrant D | 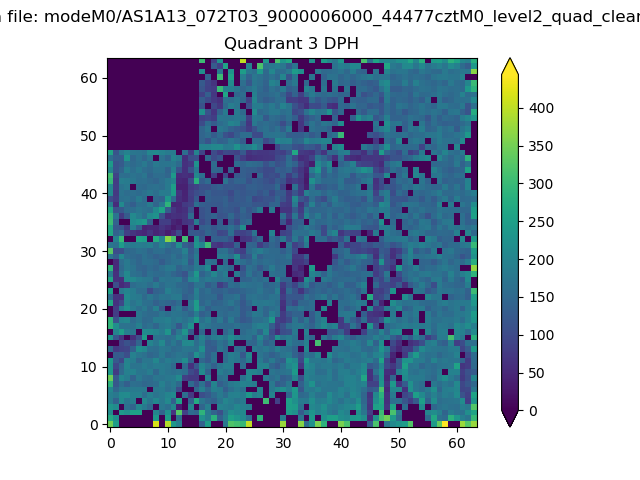 |
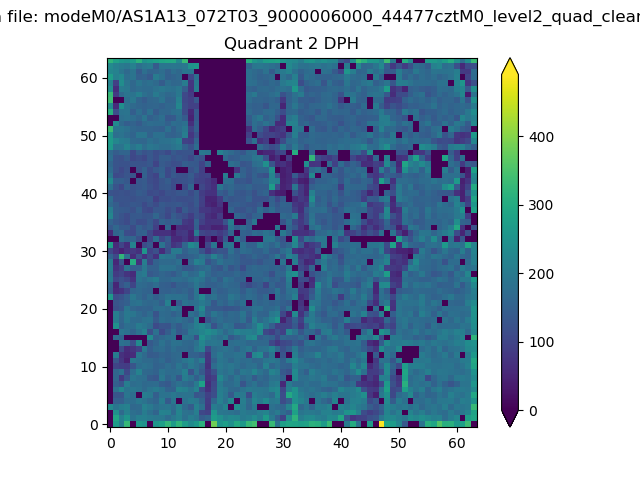 |
Quadrant C |
| Plot type | Count rate plots | Images |
|---|---|---|
| Comparison with Poisson distribution Blue bars denote a histogram of data divided into 1 sec bins. Red curve is a Poisson curve with rate = median count rate of data. |
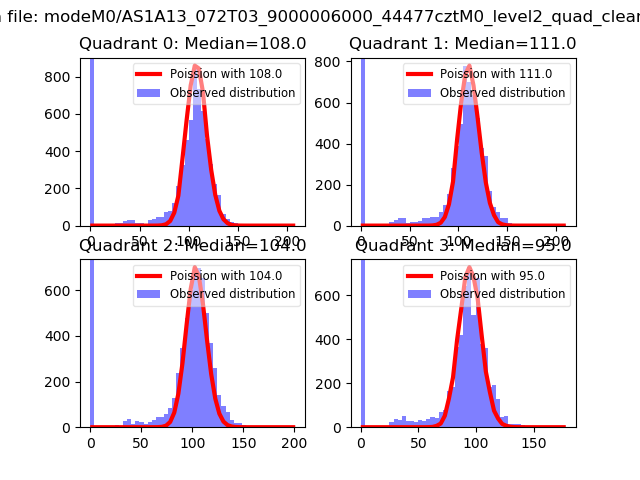 |
 |
| Quadrant-wise count rates Data is divided into 100 sec bins |
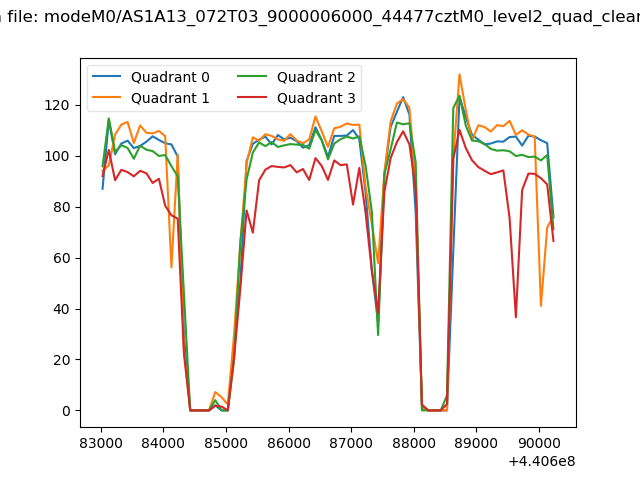 |
|
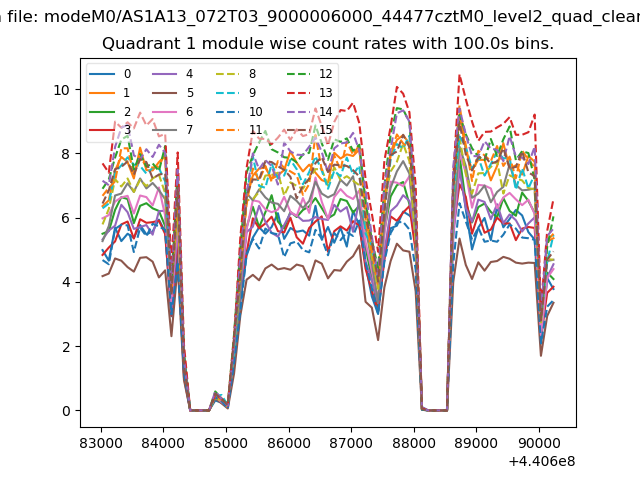
| Module-wise count rates for Quadrant A Data is divided into 100 sec bins |
 |
 |
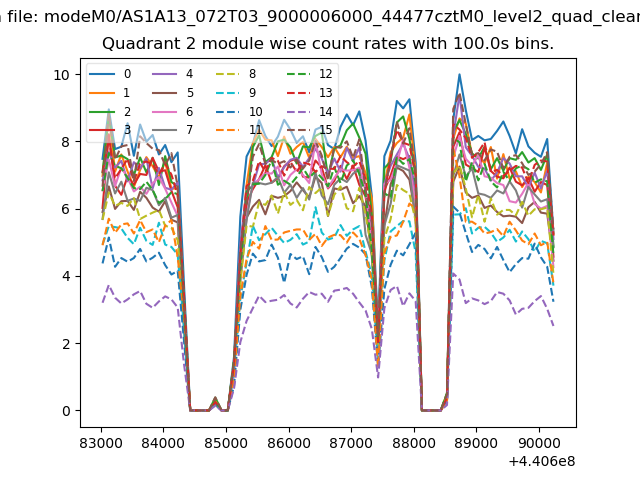
| Module-wise count rates for Quadrant B Data is divided into 100 sec bins |
 |
 |
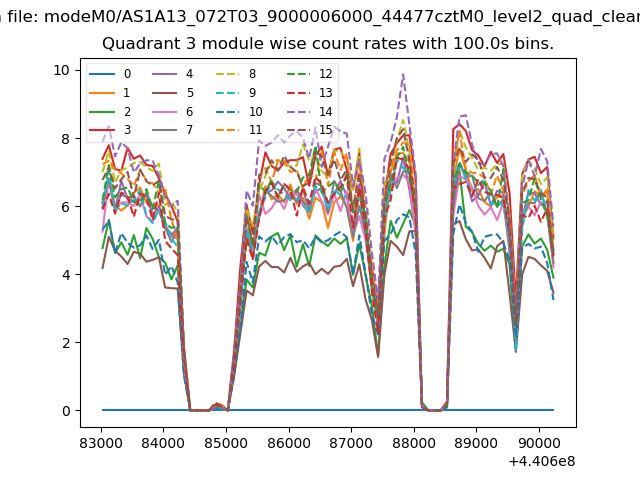
| Module-wise count rates for Quadrant C Data is divided into 100 sec bins |
 |
 |
| Module-wise count rates for Quadrant D Data is divided into 100 sec bins |
 |
 |
| Parameter | Plot |
|---|---|
| CZT HV Monitor | 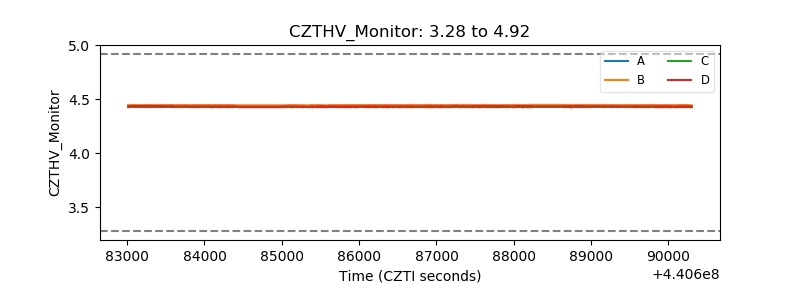 |
| D_VDD | 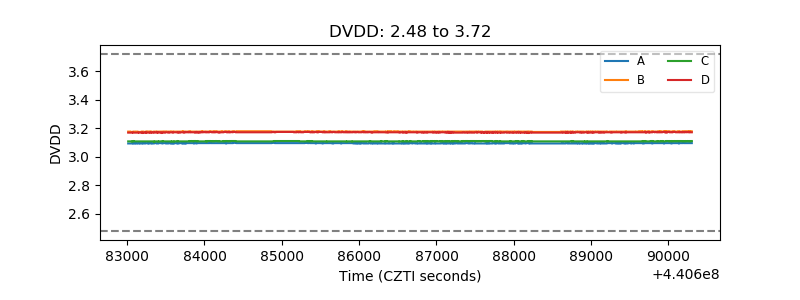 |
| Temperature 1 | 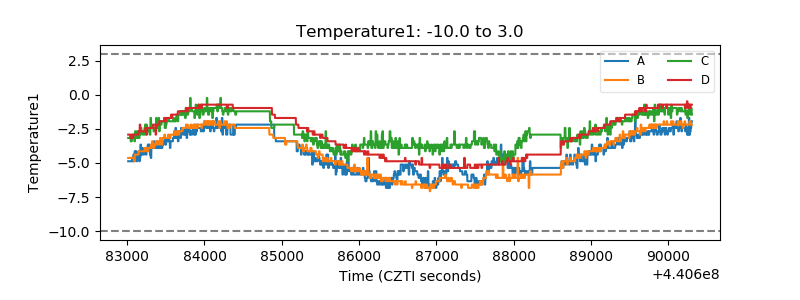 |
| Veto HV Monitor | 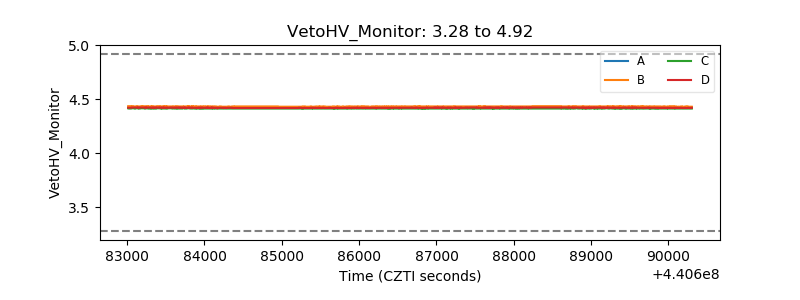 |
| Veto LLD | 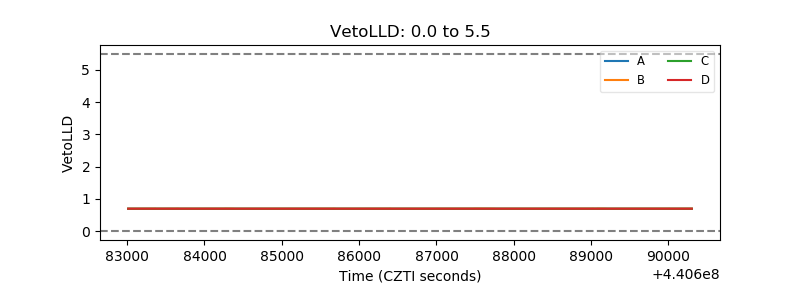 |
| Alpha Counter | 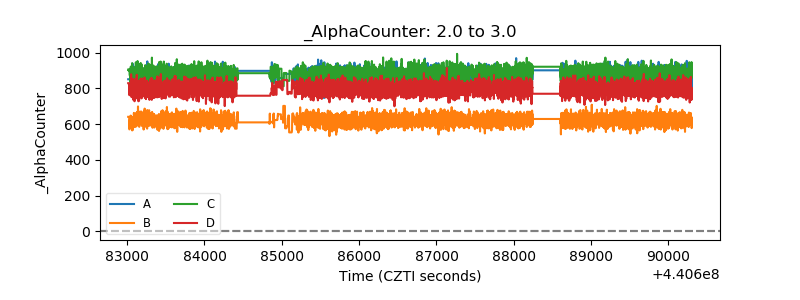 |
| _CPM_Rate | 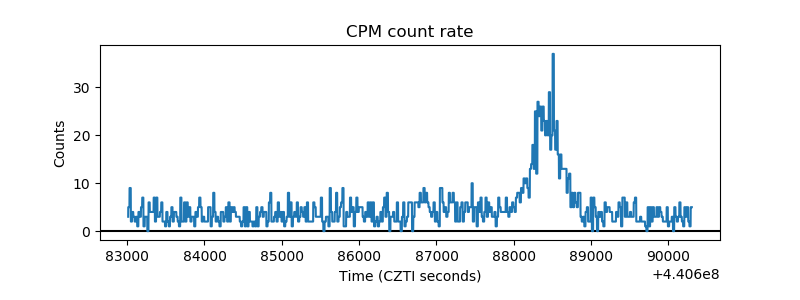 |
| CZT Counter | 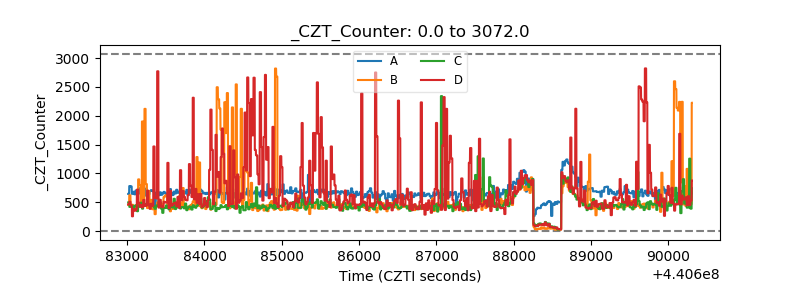 |
| +2.5 Volts monitor | 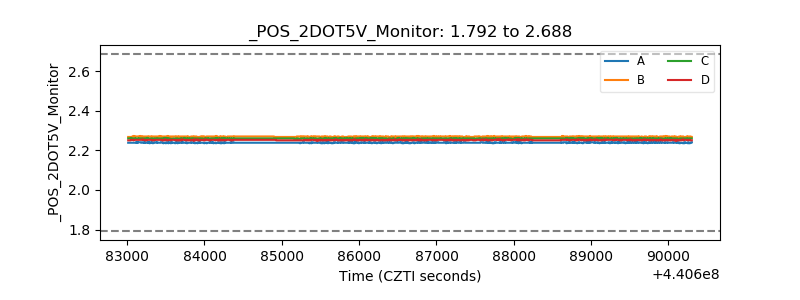 |
| +5 Volts monitor | 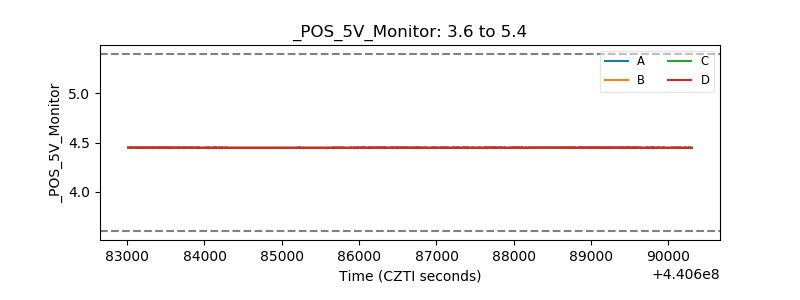 |
| _ROLL_ROT | 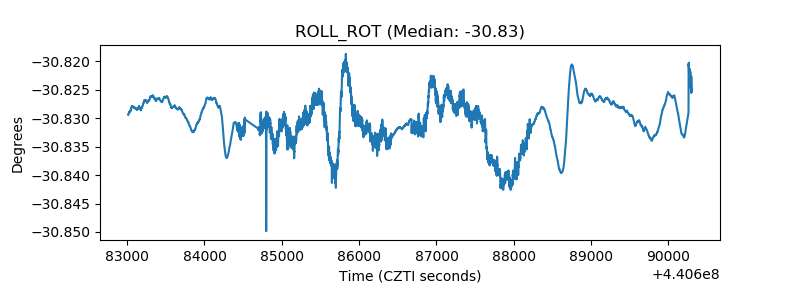 |
| _Roll_DEC | 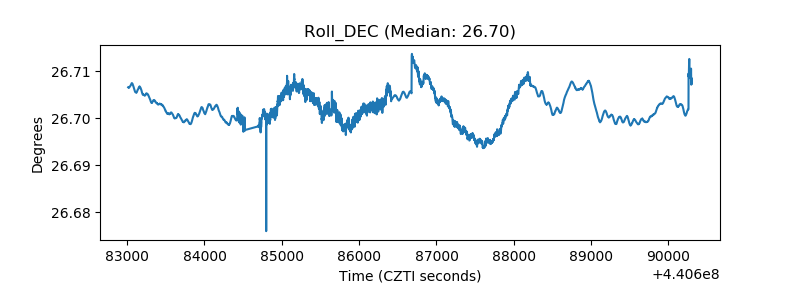 |
| _Roll_RA | 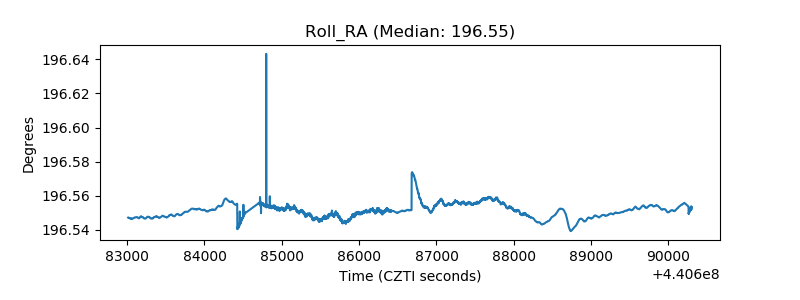 |
| Veto Counter |  |