| Param | Original file | Final file |
|---|---|---|
| Filename | modeM0/AS1A13_072T03_9000006000_44484cztM0_level2.fits | modeM0/AS1A13_072T03_9000006000_44484cztM0_level2_quad_clean.evt |
| Size (bytes) | 24,390,720 | 4,973,760 |
| Size | 23.3 MB | 4.7 MB |
| Events in quadrant A | 198,912 | 20,984 |
| Events in quadrant B | 239,204 | 40,362 |
| Events in quadrant C | 229,486 | 28,974 |
| Events in quadrant D | 200,636 | 23,714 |
| Mode SS | |||
|---|---|---|---|
| Quadrant | BADHDUFLAG | Total packets | Discarded packets |
| A | 0 | 49 | 35 |
| B | 0 | 45 | 27 |
| C | 0 | 46 | 34 |
| D | 0 | 49 | 37 |
| Mode M9 | |||
|---|---|---|---|
| Quadrant | BADHDUFLAG | Total packets | Discarded packets |
| A | 0 | 7 | 5 |
| B | 0 | 8 | 6 |
| C | 0 | 7 | 2 |
| D | 0 | 7 | 3 |
| Mode M0 | |||
|---|---|---|---|
| Quadrant | BADHDUFLAG | Total packets | Discarded packets |
| A | 0 | 6705 | 5871 |
| B | 0 | 4908 | 3865 |
| C | 0 | 5238 | 4272 |
| D | 0 | 6180 | 5349 |
| Quadrant | Total seconds | Saturated seconds | Saturation percentage |
|---|---|---|---|
| A | 309 | 1 | 0.323625% |
| B | 487 | 5 | 1.026694% |
| C | 420 | 16 | 3.809524% |
| D | 362 | 3 | 0.828729% |
Noise dominated data is calculated using 1-second bins in cleaned event files. If a bin has >2000 counts, and if more than 50% of those come from <1% of pixels, then it is considered to be noise-dominated and hence unusable.
| Quadrant | # 1 sec bins | Bins with >0 counts | Bins with >2000 counts | High rate bins dominated by noise | Noise dominated (total time) | Noise dominated (detector-on time) | Marked lightcurve |
|---|---|---|---|---|---|---|---|
| A | 1432 | 452 | 0 | 0 | 0.00% | 0.00% | 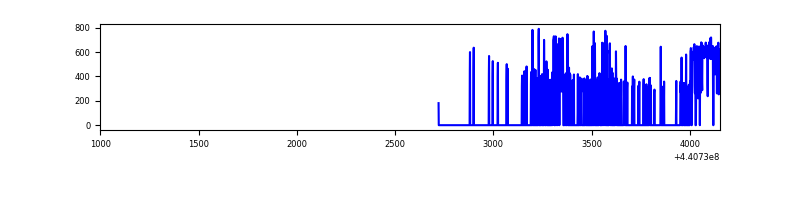 |
| B | 3156 | 709 | 1 | 1 | 0.03% | 0.14% | 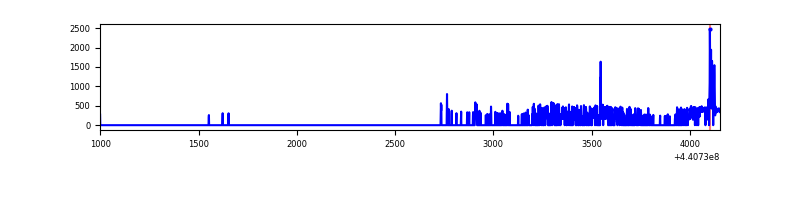 |
| C | 3140 | 630 | 12 | 12 | 0.38% | 1.90% | 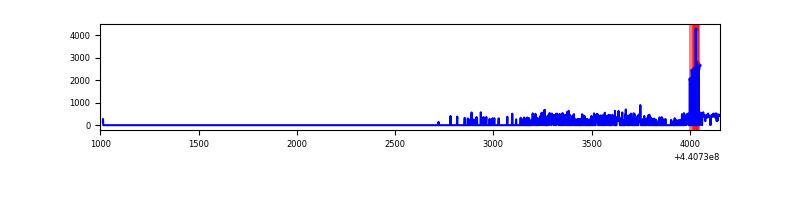 |
| D | 2545 | 544 | 3 | 3 | 0.12% | 0.55% | 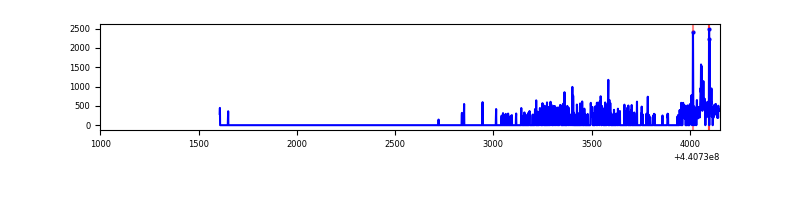 |
Top three noisy pixels from each quadrant. If the there are fewer than three noisy pixels in the level2.evt file, extra rows are filled as -1
| Pixel properties | Quadrant properties | ||||||
|---|---|---|---|---|---|---|---|
| Quadrant | DetID | PixID | Counts | Sigma | Mean | Median | Sigma |
| A | 10 | 83 | 72859 | 8236.69 | 32 | 31 | 8.8 |
| A | 3 | 137 | 365 | 37.77 | 32 | 31 | 8.8 |
| A | 0 | 243 | 269 | 26.92 | 32 | 31 | 8.8 |
| B | 5 | 172 | 20012 | 1561.19 | 54 | 52 | 12.8 |
| B | 0 | 189 | 3134 | 241.06 | 54 | 52 | 12.8 |
| B | 12 | 111 | 1336 | 100.43 | 54 | 52 | 12.8 |
| C | 14 | 254 | 40489 | 3315.04 | 43 | 43 | 12.2 |
| C | 3 | 233 | 18295 | 1495.97 | 43 | 43 | 12.2 |
| C | 13 | 61 | 316 | 22.38 | 43 | 43 | 12.2 |
| D | 1 | 52 | 28813 | 2597.95 | 36 | 35 | 11.1 |
| D | 13 | 249 | 19800 | 1784.29 | 36 | 35 | 11.1 |
| D | 2 | 249 | 10924 | 983.01 | 36 | 35 | 11.1 |
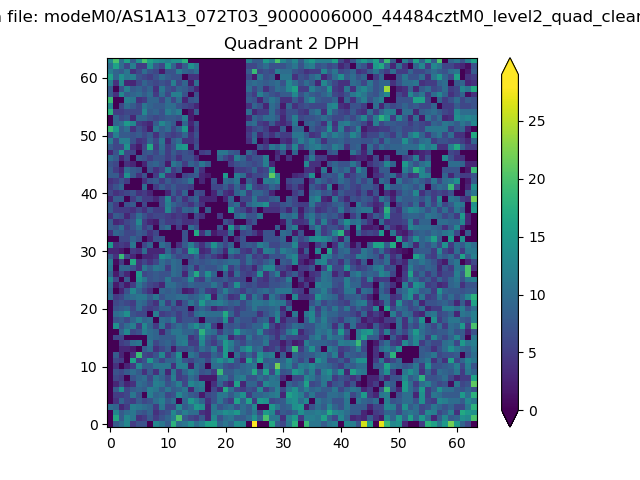
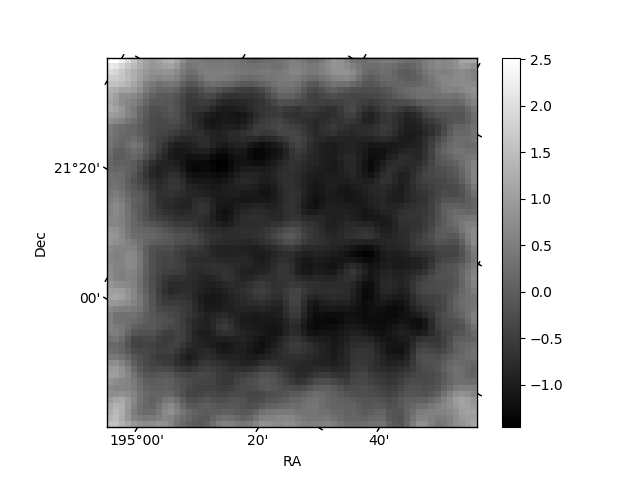
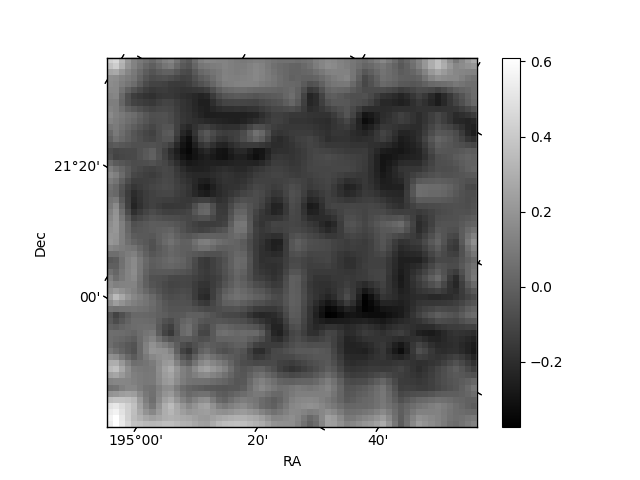
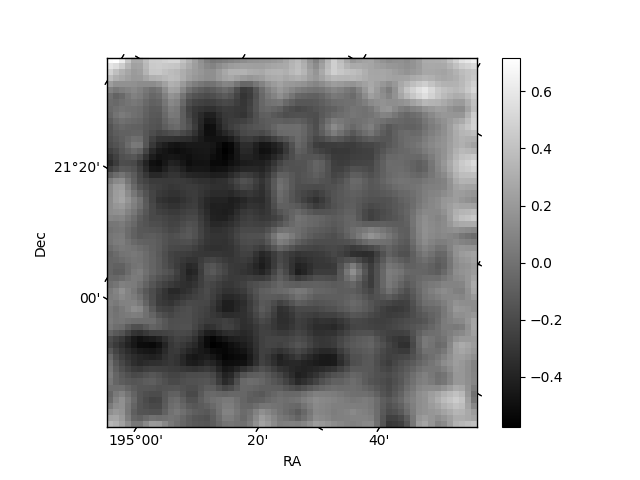
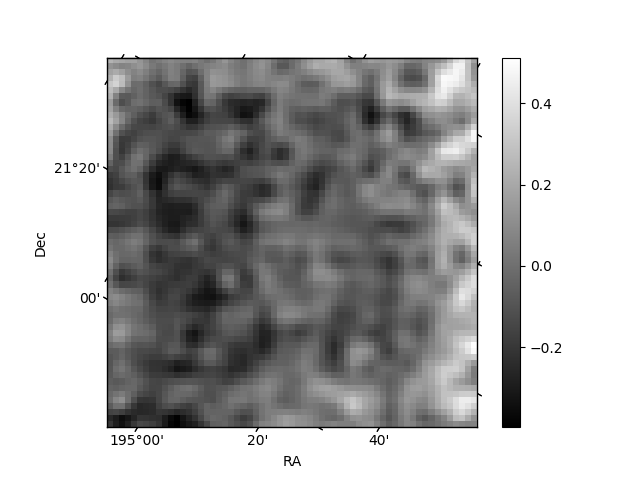
Histogram calculated using DETX and DETY for each event in the final _common_clean file
| Quadrant A | 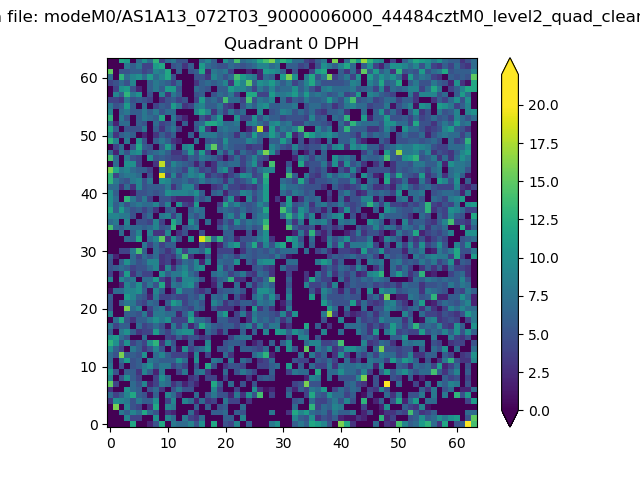 |
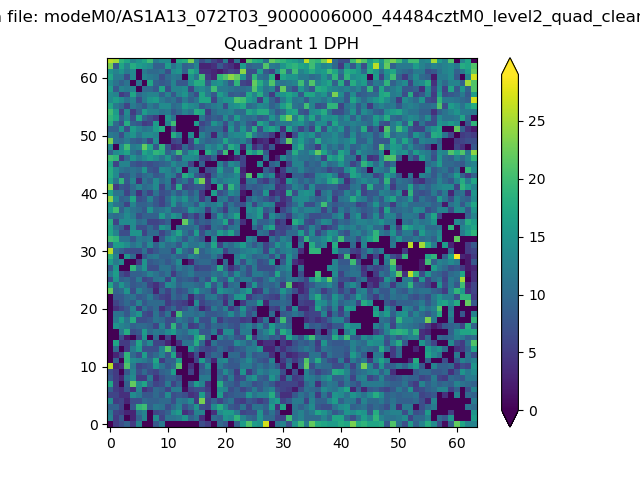 |
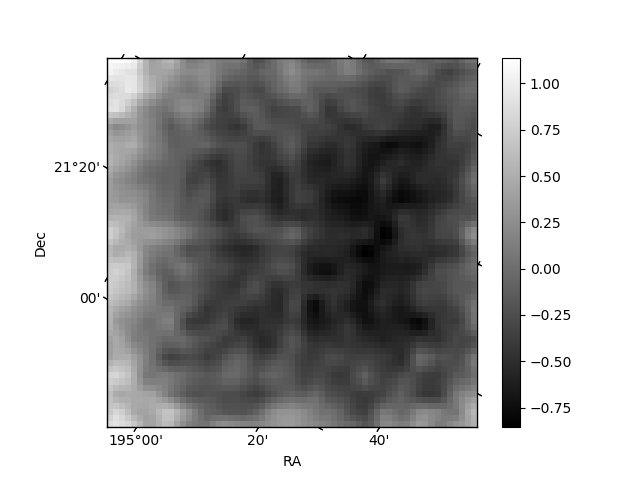
Quadrant B |
|---|---|---|---|
| Quadrant D | 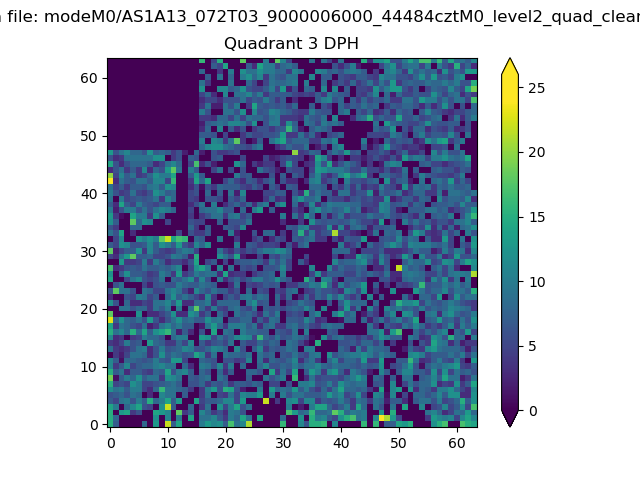 |
 |
Quadrant C |
| Plot type | Count rate plots | Images |
|---|---|---|
| Comparison with Poisson distribution Blue bars denote a histogram of data divided into 1 sec bins. Red curve is a Poisson curve with rate = median count rate of data. |
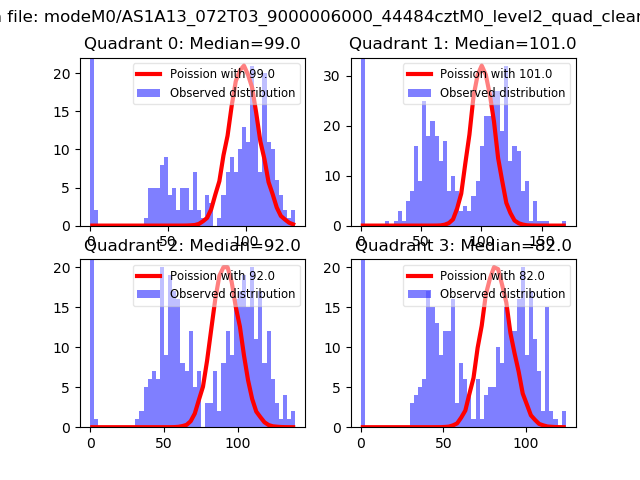 |
 |
| Quadrant-wise count rates Data is divided into 100 sec bins |
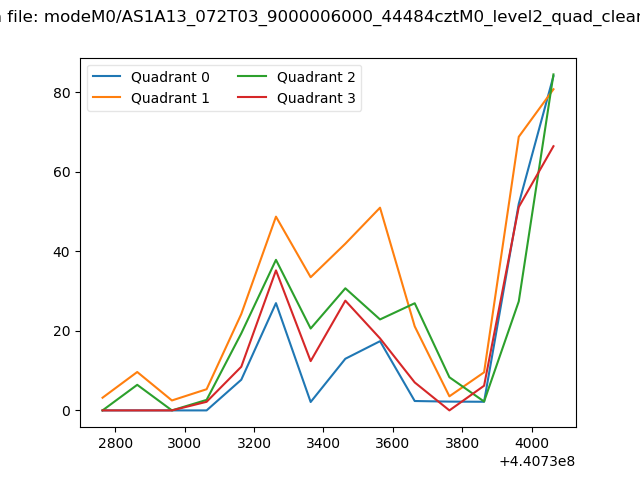 |
|
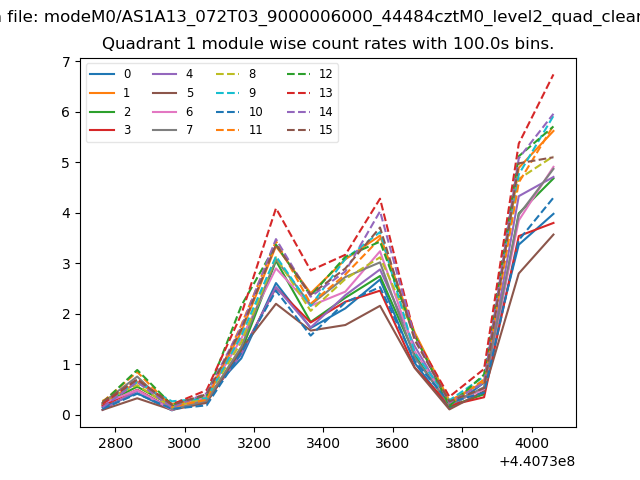
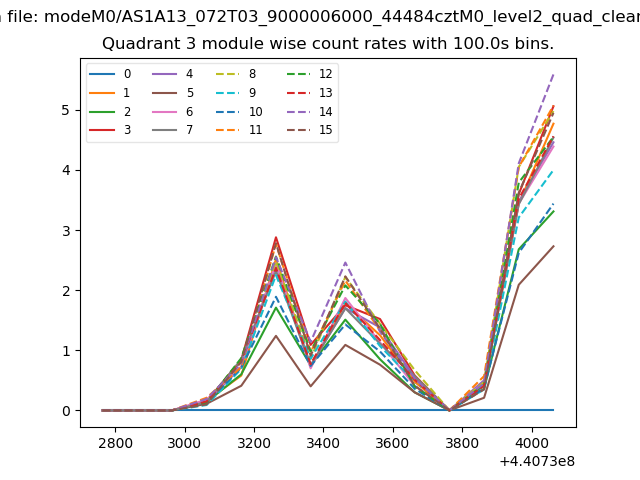
| Module-wise count rates for Quadrant A Data is divided into 100 sec bins |
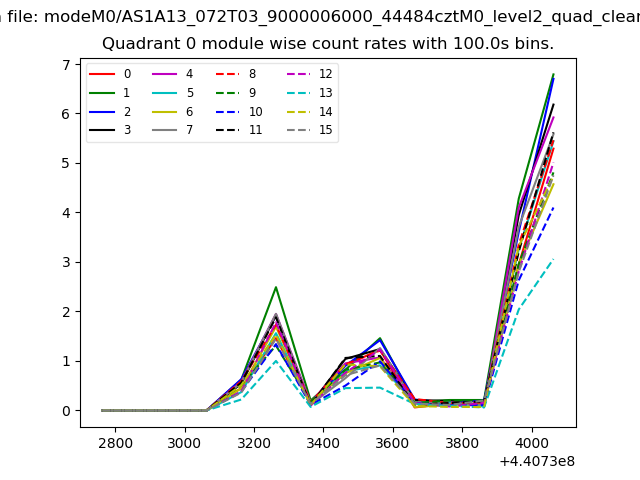 |
 |
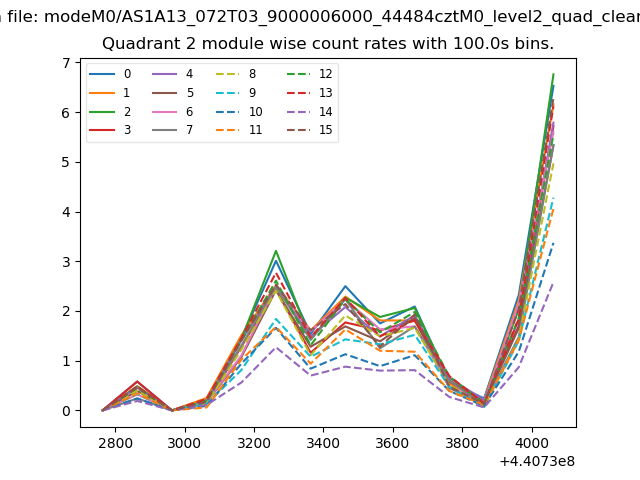
| Module-wise count rates for Quadrant B Data is divided into 100 sec bins |
 |
 |
| Module-wise count rates for Quadrant C Data is divided into 100 sec bins |
 |
 |
| Module-wise count rates for Quadrant D Data is divided into 100 sec bins |
 |
 |
| Parameter | Plot |
|---|---|
| CZT HV Monitor | 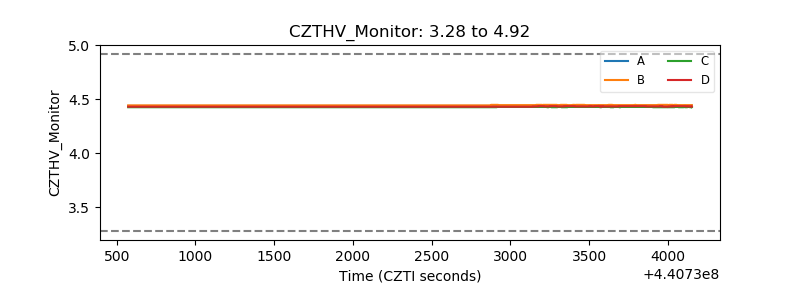 |
| D_VDD | 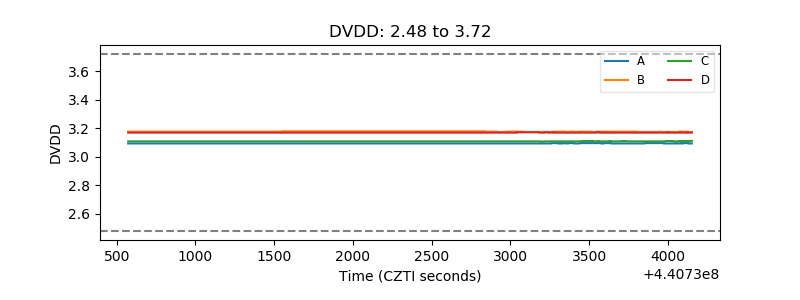 |
| Temperature 1 | 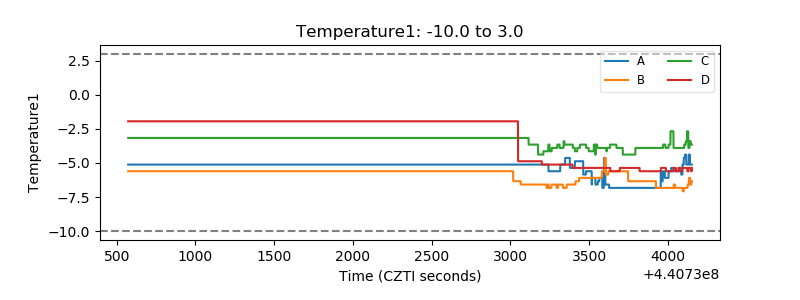 |
| Veto HV Monitor | 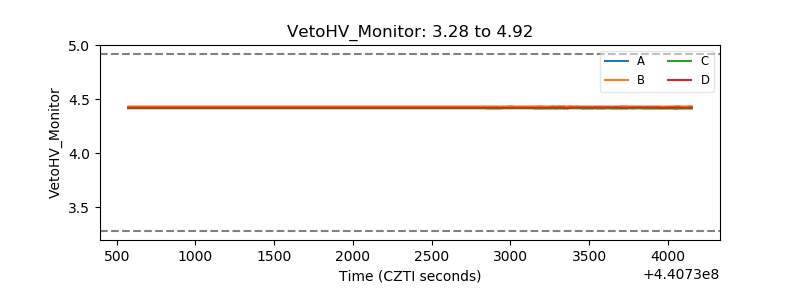 |
| Veto LLD | 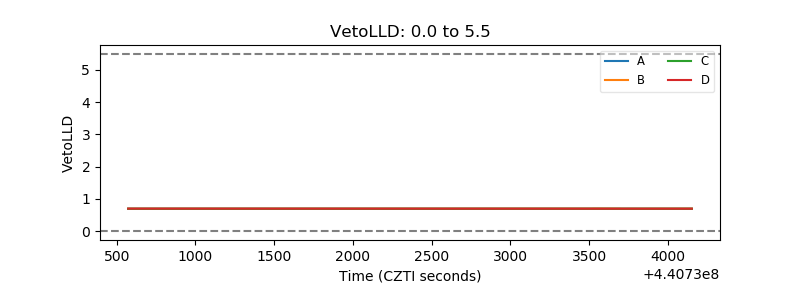 |
| Alpha Counter | 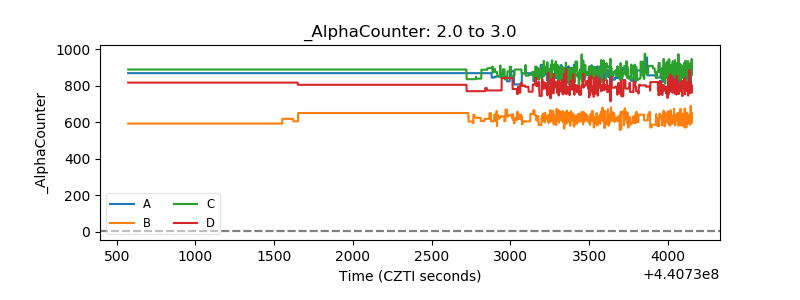 |
| _CPM_Rate | 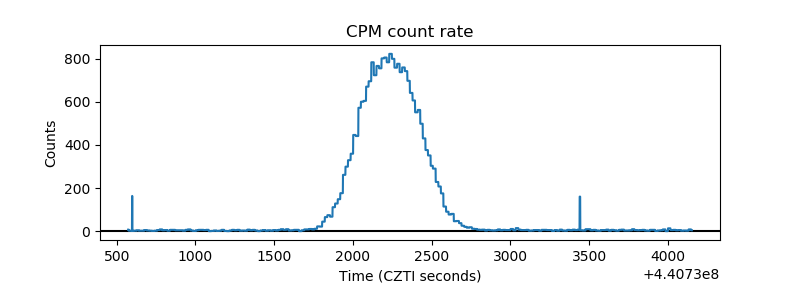 |
| CZT Counter | 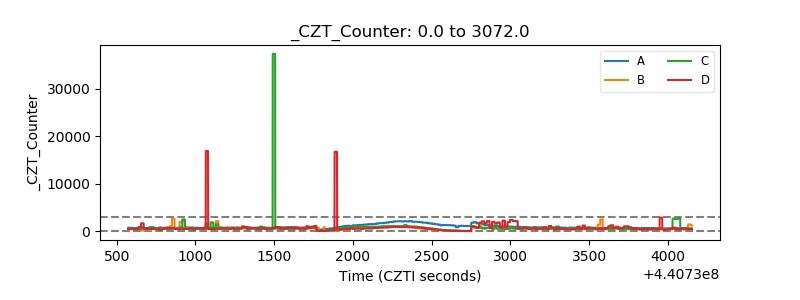 |
| +2.5 Volts monitor | 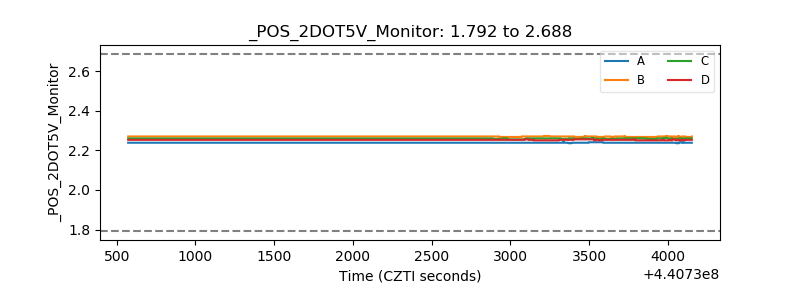 |
| +5 Volts monitor | 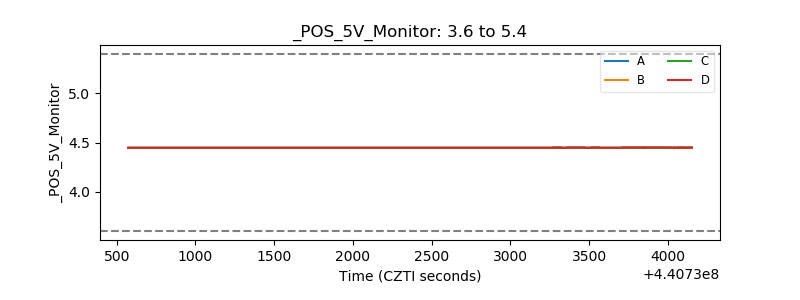 |
| _ROLL_ROT | 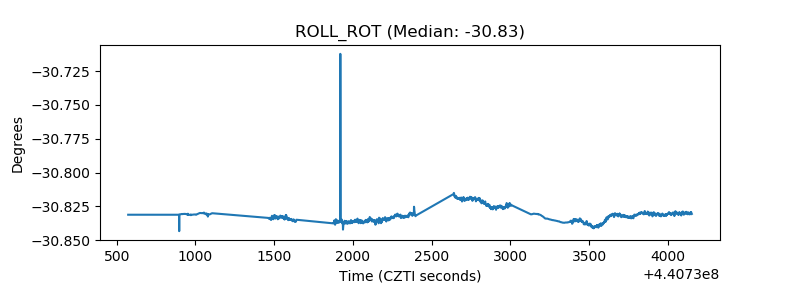 |
| _Roll_DEC | 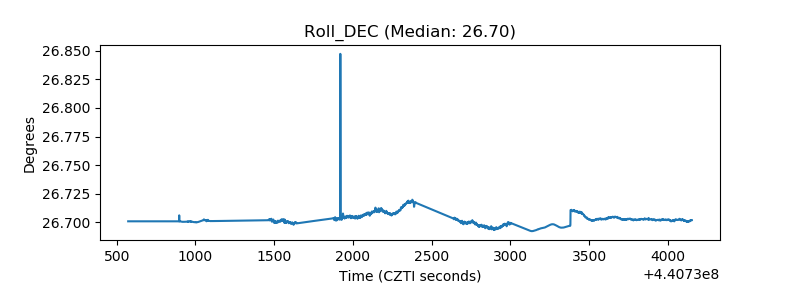 |
| _Roll_RA | 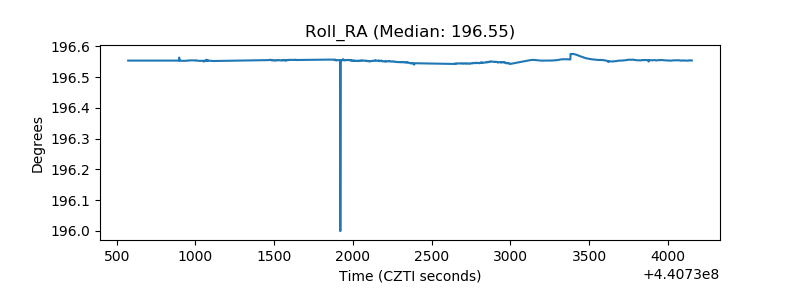 |
| Veto Counter | 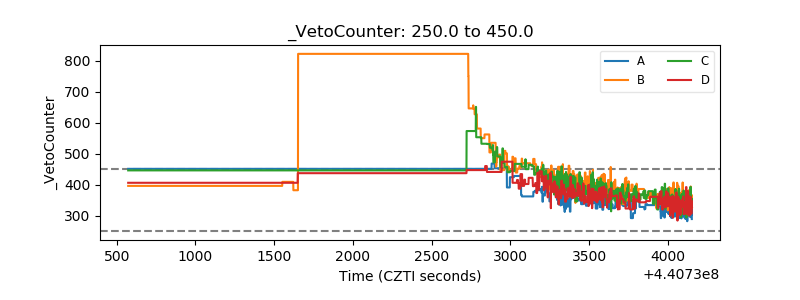 |