| Param | Original file | Final file |
|---|---|---|
| Filename | modeM0/AS1A13_072T03_9000006000_44486cztM0_level2.fits | modeM0/AS1A13_072T03_9000006000_44486cztM0_level2_quad_clean.evt |
| Size (bytes) | 486,751,680 | 110,237,760 |
| Size | 464.2 MB | 105.1 MB |
| Events in quadrant A | 4,829,585 | 752,679 |
| Events in quadrant B | 4,086,512 | 737,435 |
| Events in quadrant C | 3,417,766 | 739,880 |
| Events in quadrant D | 5,157,076 | 634,730 |
| Mode SS | |||
|---|---|---|---|
| Quadrant | BADHDUFLAG | Total packets | Discarded packets |
| A | 0 | 140 | 0 |
| B | 0 | 140 | 0 |
| C | 0 | 140 | 0 |
| D | 0 | 140 | 0 |
| Mode M9 | |||
|---|---|---|---|
| Quadrant | BADHDUFLAG | Total packets | Discarded packets |
| A | 0 | 14 | 0 |
| B | 0 | 15 | 0 |
| C | 0 | 15 | 0 |
| D | 0 | 15 | 0 |
| Mode M0 | |||
|---|---|---|---|
| Quadrant | BADHDUFLAG | Total packets | Discarded packets |
| A | 0 | 19770 | 2 |
| B | 0 | 17048 | 2 |
| C | 0 | 14898 | 2 |
| D | 0 | 20263 | 2 |
| Quadrant | Total seconds | Saturated seconds | Saturation percentage |
|---|---|---|---|
| A | 6784 | 99 | 1.459316% |
| B | 6784 | 466 | 6.869104% |
| C | 6784 | 79 | 1.164505% |
| D | 6784 | 566 | 8.343160% |
Noise dominated data is calculated using 1-second bins in cleaned event files. If a bin has >2000 counts, and if more than 50% of those come from <1% of pixels, then it is considered to be noise-dominated and hence unusable.
| Quadrant | # 1 sec bins | Bins with >0 counts | Bins with >2000 counts | High rate bins dominated by noise | Noise dominated (total time) | Noise dominated (detector-on time) | Marked lightcurve |
|---|---|---|---|---|---|---|---|
| A | 7936 | 6812 | 6 | 6 | 0.08% | 0.09% | 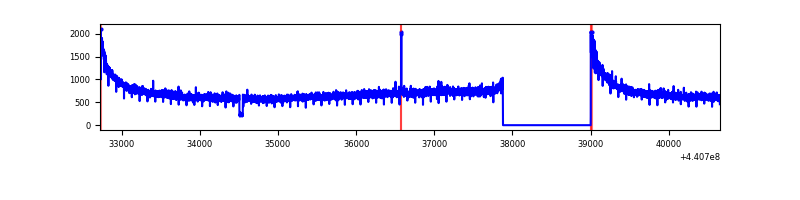 |
| B | 7936 | 6812 | 310 | 310 | 3.91% | 4.55% | 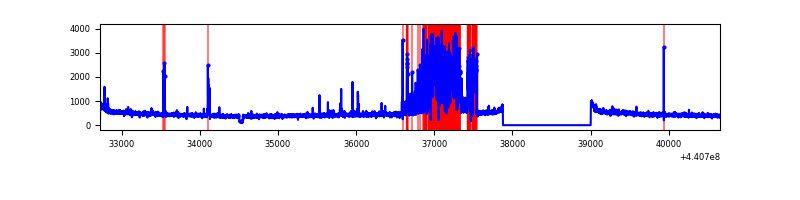 |
| C | 7936 | 6812 | 54 | 54 | 0.68% | 0.79% | 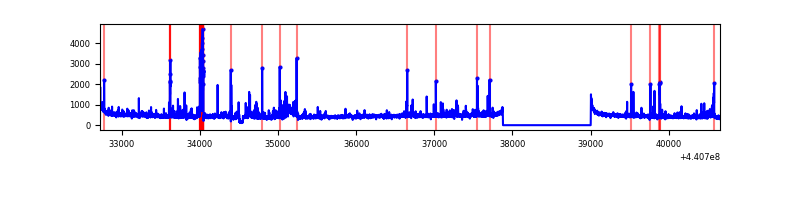 |
| D | 7936 | 6812 | 448 | 448 | 5.65% | 6.58% | 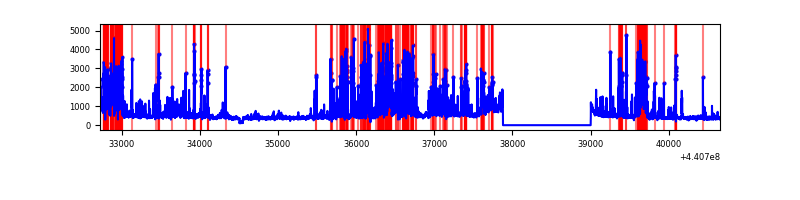 |
Top three noisy pixels from each quadrant. If the there are fewer than three noisy pixels in the level2.evt file, extra rows are filled as -1
| Pixel properties | Quadrant properties | ||||||
|---|---|---|---|---|---|---|---|
| Quadrant | DetID | PixID | Counts | Sigma | Mean | Median | Sigma |
| A | 10 | 83 | 1899747 | 12139.73 | 756 | 742 | 156.4 |
| A | 0 | 243 | 9535 | 56.21 | 756 | 742 | 156.4 |
| A | 3 | 137 | 8607 | 50.28 | 756 | 742 | 156.4 |
| B | 5 | 172 | 1104643 | 7579.32 | 739 | 719 | 145.6 |
| B | 5 | 255 | 22705 | 150.95 | 739 | 719 | 145.6 |
| B | 12 | 111 | 18381 | 121.26 | 739 | 719 | 145.6 |
| C | 14 | 254 | 282714 | 1611.32 | 740 | 746 | 175.0 |
| C | 3 | 233 | 215926 | 1229.66 | 740 | 746 | 175.0 |
| C | 12 | 249 | 27788 | 154.53 | 740 | 746 | 175.0 |
| D | 13 | 249 | 1057834 | 5876.06 | 711 | 688 | 179.9 |
| D | 2 | 249 | 805440 | 4473.15 | 711 | 688 | 179.9 |
| D | 1 | 52 | 531774 | 2952.0 | 711 | 688 | 179.9 |
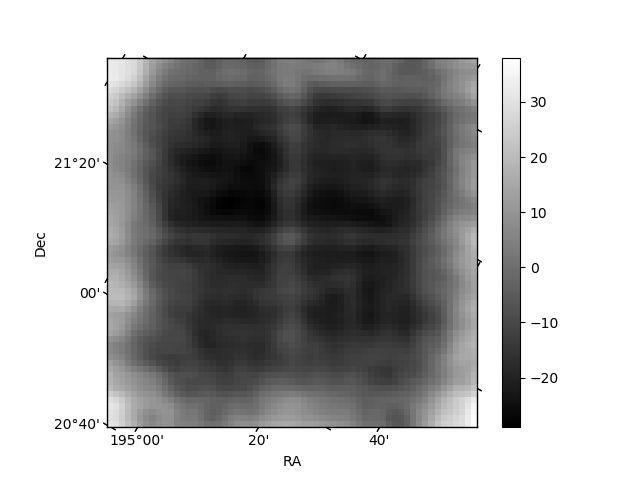
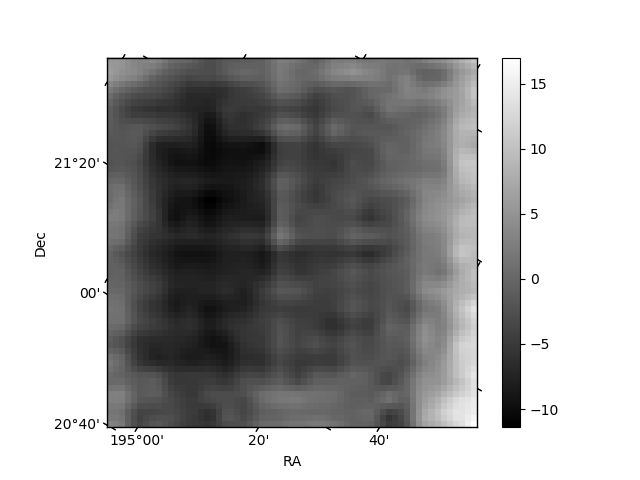
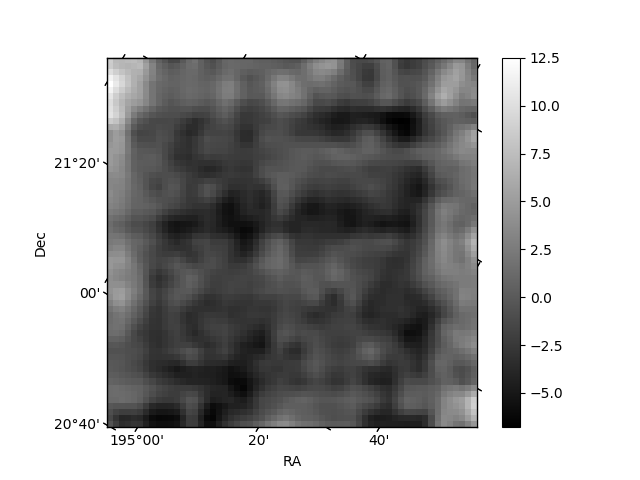
Histogram calculated using DETX and DETY for each event in the final _common_clean file
| Quadrant A | 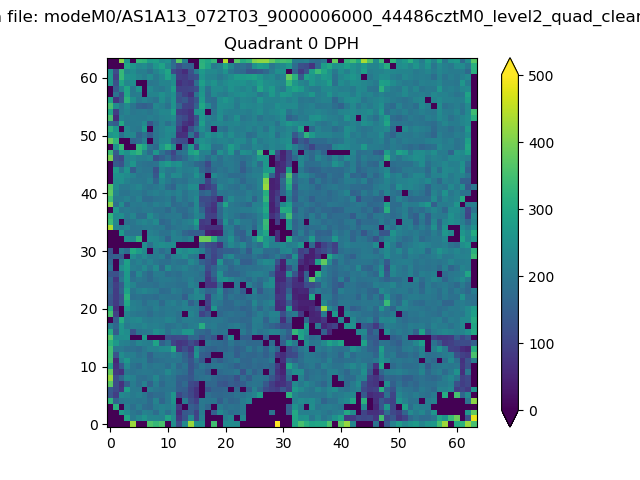 |
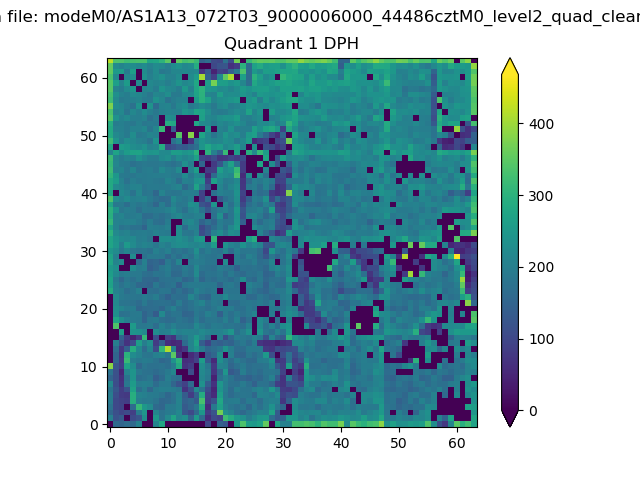 |
Quadrant B |
|---|---|---|---|
| Quadrant D | 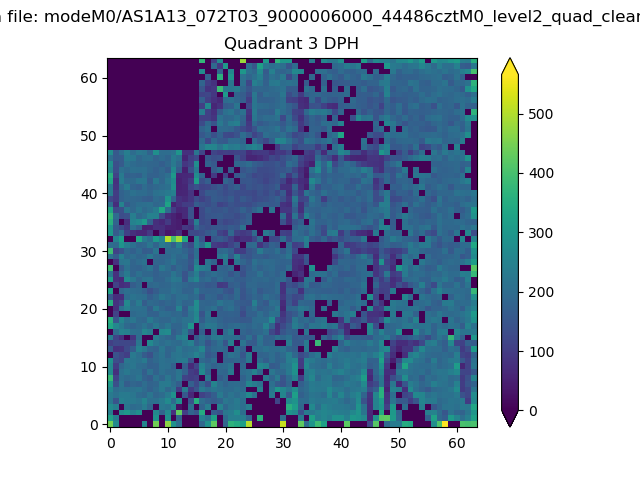 |
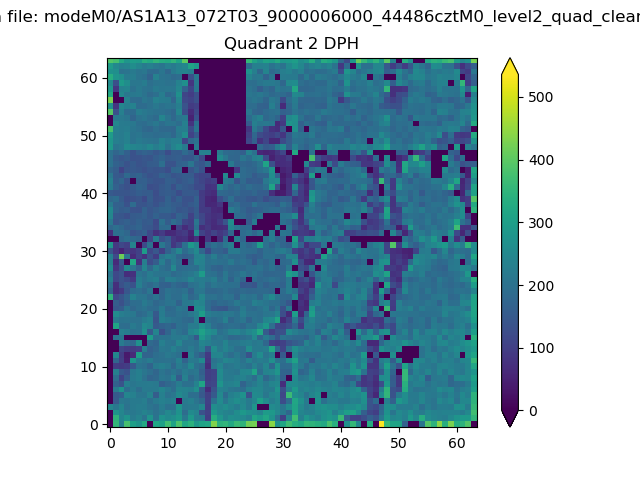 |
Quadrant C |
| Plot type | Count rate plots | Images |
|---|---|---|
| Comparison with Poisson distribution Blue bars denote a histogram of data divided into 1 sec bins. Red curve is a Poisson curve with rate = median count rate of data. |
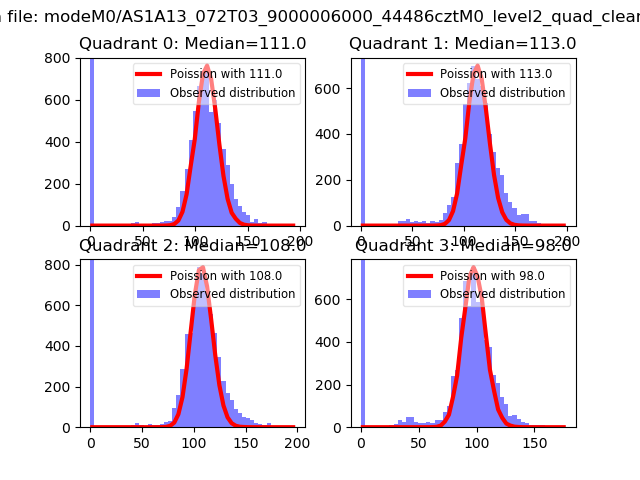 |
 |
| Quadrant-wise count rates Data is divided into 100 sec bins |
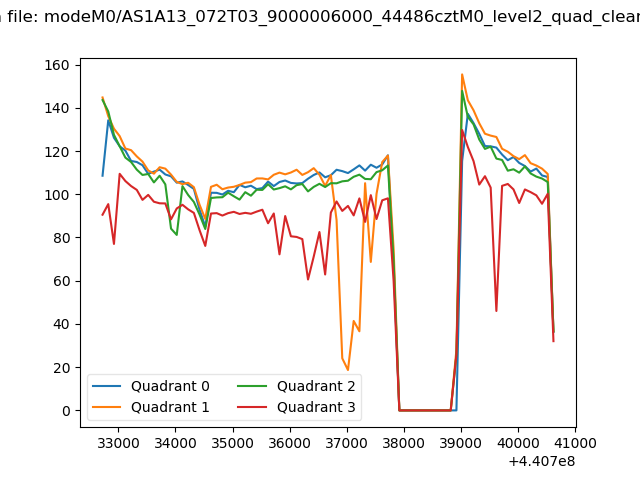 |
|
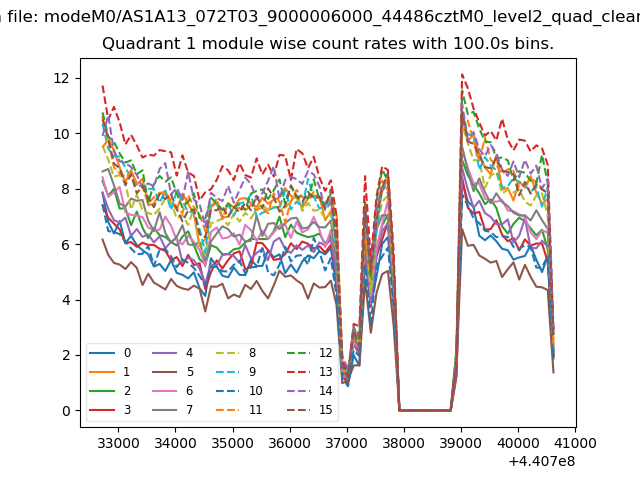
| Module-wise count rates for Quadrant A Data is divided into 100 sec bins |
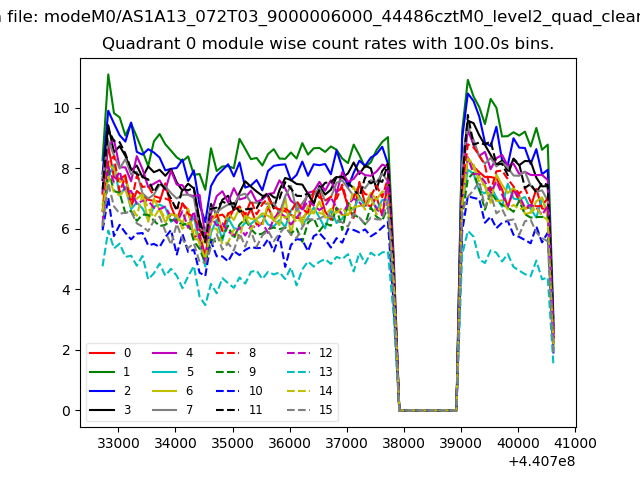 |
 |
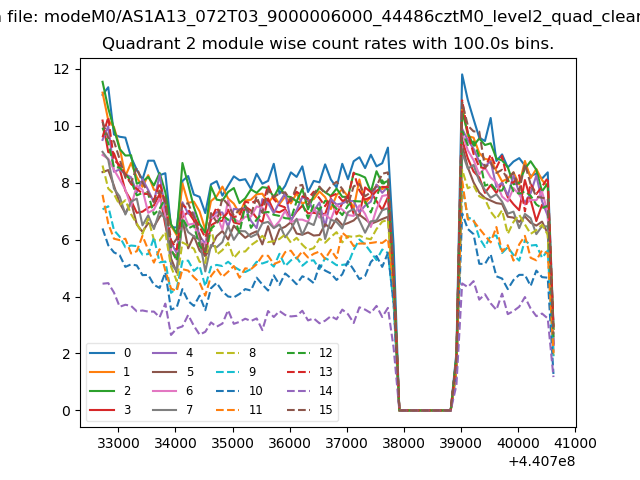
| Module-wise count rates for Quadrant B Data is divided into 100 sec bins |
 |
 |
| Module-wise count rates for Quadrant C Data is divided into 100 sec bins |
 |
 |
| Module-wise count rates for Quadrant D Data is divided into 100 sec bins |
 |
 |
| Parameter | Plot |
|---|---|
| CZT HV Monitor | 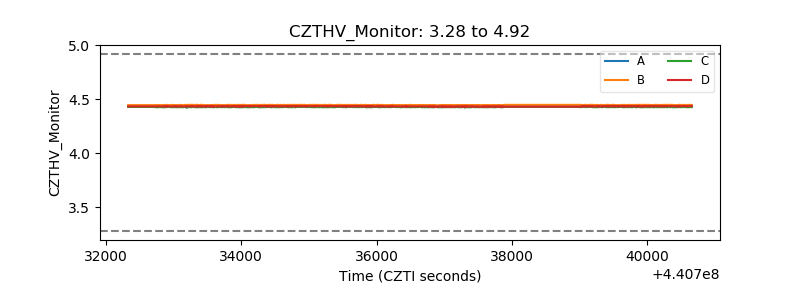 |
| D_VDD | 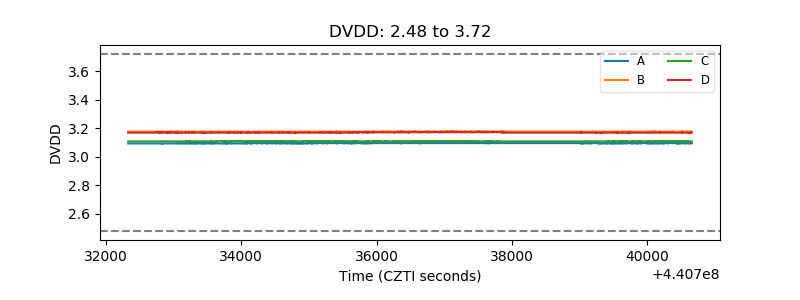 |
| Temperature 1 | 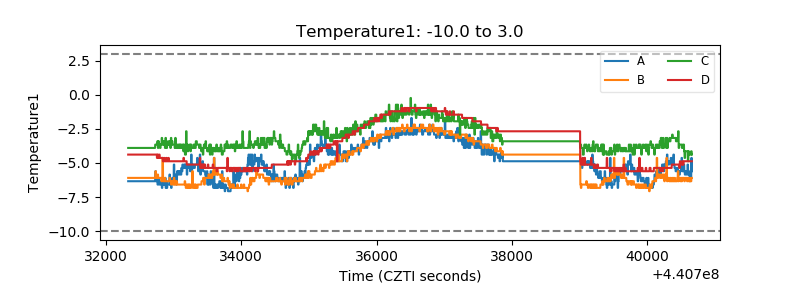 |
| Veto HV Monitor | 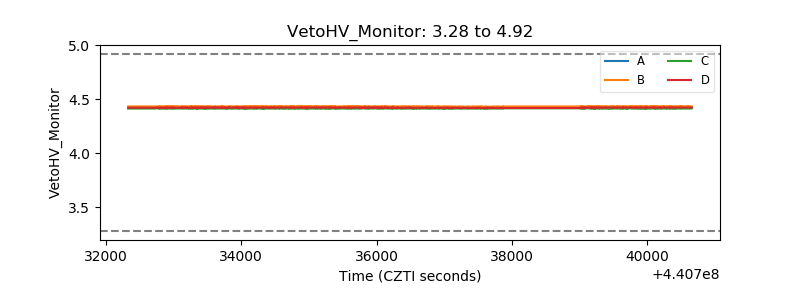 |
| Veto LLD | 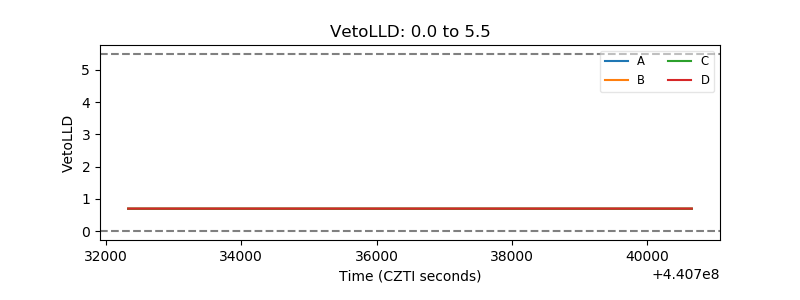 |
| Alpha Counter | 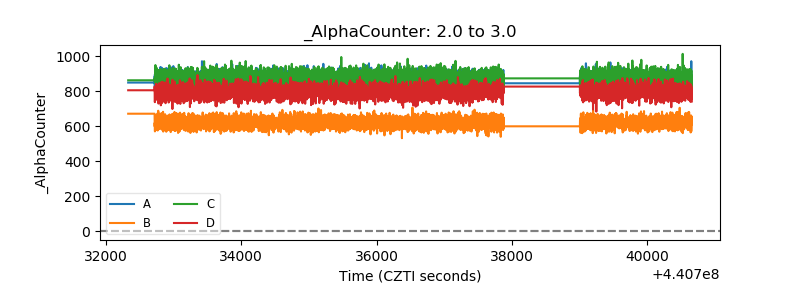 |
| _CPM_Rate | 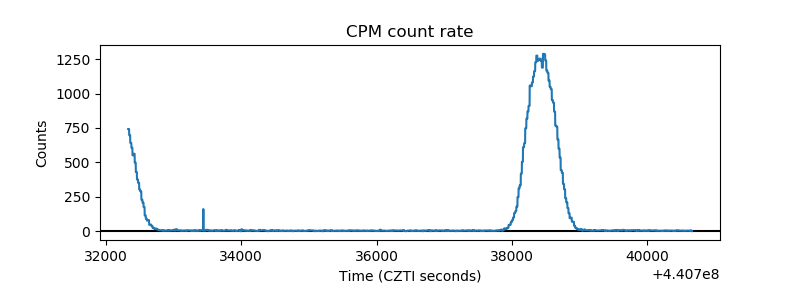 |
| CZT Counter | 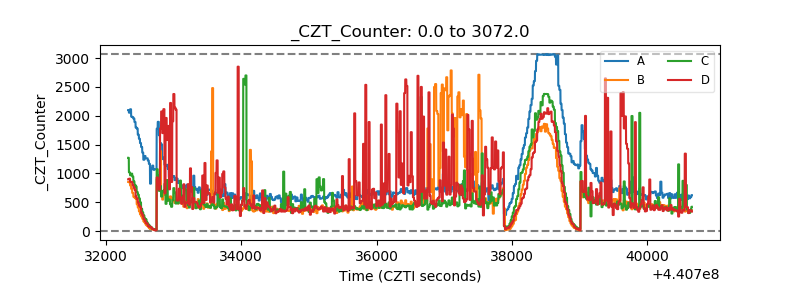 |
| +2.5 Volts monitor | 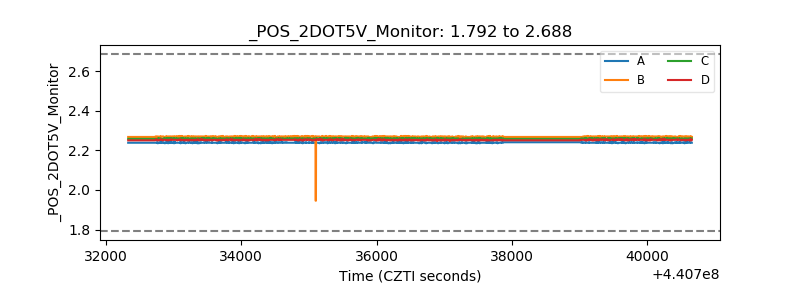 |
| +5 Volts monitor | 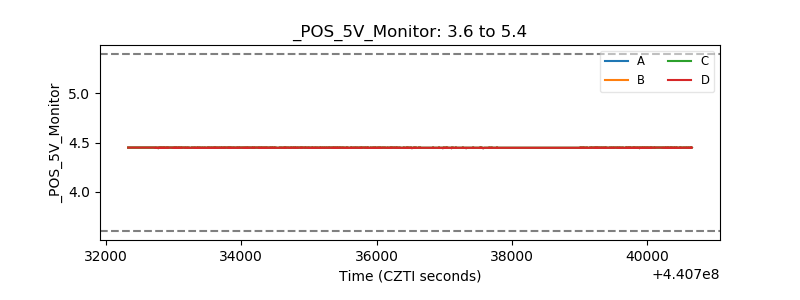 |
| _ROLL_ROT | 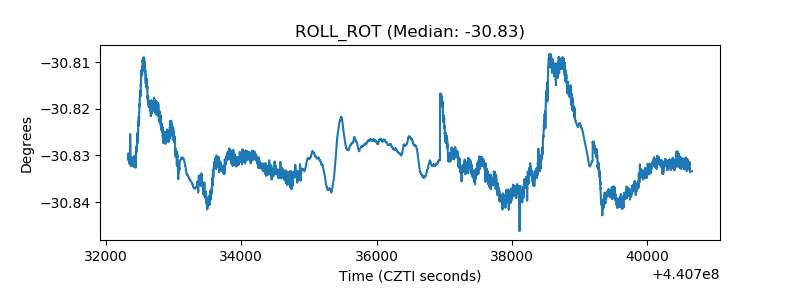 |
| _Roll_DEC | 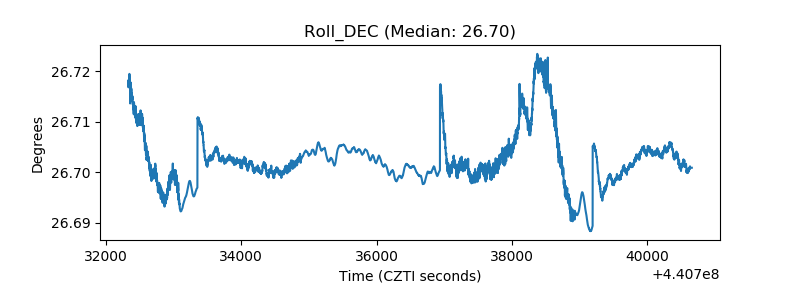 |
| _Roll_RA | 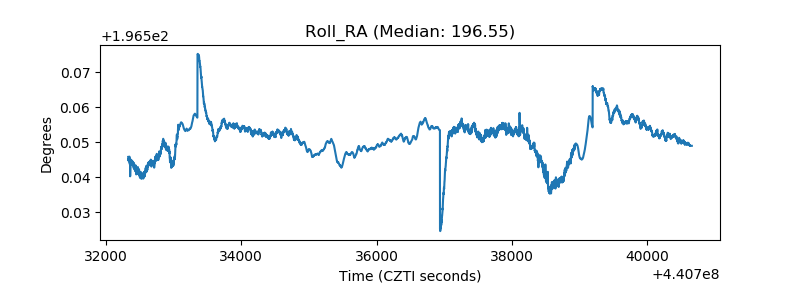 |
| Veto Counter | 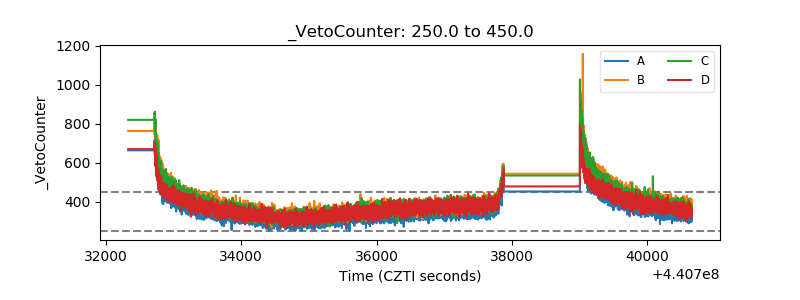 |