| Param | Original file | Final file |
|---|---|---|
| Filename | modeM0/AS1A13_072T03_9000006000_44487cztM0_level2.fits | modeM0/AS1A13_072T03_9000006000_44487cztM0_level2_quad_clean.evt |
| Size (bytes) | 2,187,754,560 | 537,143,040 |
| Size | 2.0 GB | 512.3 MB |
| Events in quadrant A | 22,849,737 | 3,613,555 |
| Events in quadrant B | 16,715,141 | 3,683,656 |
| Events in quadrant C | 16,050,228 | 3,553,615 |
| Events in quadrant D | 22,775,120 | 3,108,102 |
| Mode SS | |||
|---|---|---|---|
| Quadrant | BADHDUFLAG | Total packets | Discarded packets |
| A | 0 | 680 | 0 |
| B | 0 | 680 | 0 |
| C | 0 | 680 | 0 |
| D | 0 | 680 | 0 |
| Mode M9 | |||
|---|---|---|---|
| Quadrant | BADHDUFLAG | Total packets | Discarded packets |
| A | 0 | 53 | 0 |
| B | 0 | 53 | 0 |
| C | 0 | 53 | 0 |
| D | 0 | 53 | 0 |
| Mode M0 | |||
|---|---|---|---|
| Quadrant | BADHDUFLAG | Total packets | Discarded packets |
| A | 0 | 94412 | 5 |
| B | 0 | 73970 | 5 |
| C | 0 | 71978 | 5 |
| D | 0 | 92481 | 5 |
| Quadrant | Total seconds | Saturated seconds | Saturation percentage |
|---|---|---|---|
| A | 33545 | 408 | 1.216277% |
| B | 33546 | 877 | 2.614321% |
| C | 33546 | 264 | 0.786979% |
| D | 33546 | 2133 | 6.358433% |
Noise dominated data is calculated using 1-second bins in cleaned event files. If a bin has >2000 counts, and if more than 50% of those come from <1% of pixels, then it is considered to be noise-dominated and hence unusable.
| Quadrant | # 1 sec bins | Bins with >0 counts | Bins with >2000 counts | High rate bins dominated by noise | Noise dominated (total time) | Noise dominated (detector-on time) | Marked lightcurve |
|---|---|---|---|---|---|---|---|
| A | 38790 | 33578 | 14 | 14 | 0.04% | 0.04% | 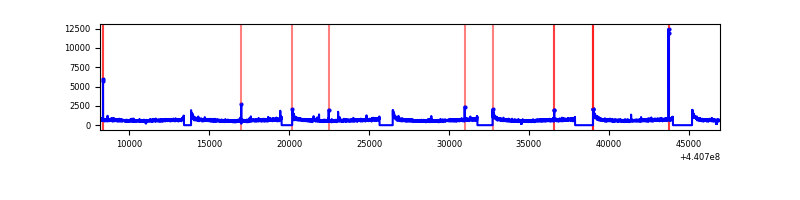 |
| B | 38791 | 33579 | 455 | 455 | 1.17% | 1.36% | 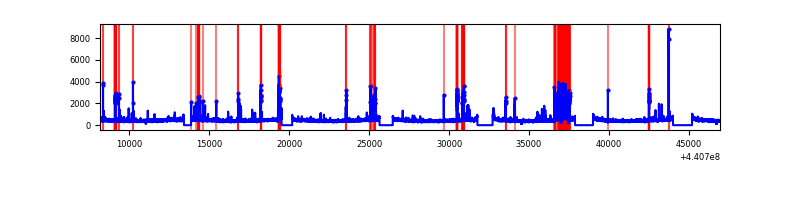 |
| C | 38791 | 33579 | 118 | 118 | 0.30% | 0.35% | 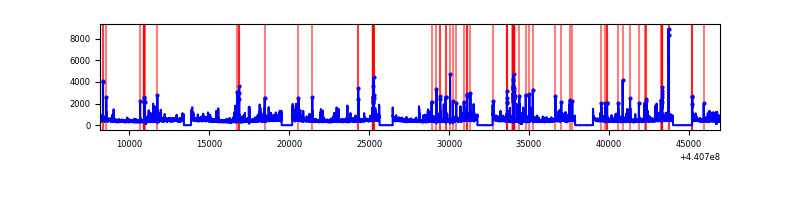 |
| D | 38791 | 33579 | 1629 | 1629 | 4.20% | 4.85% | 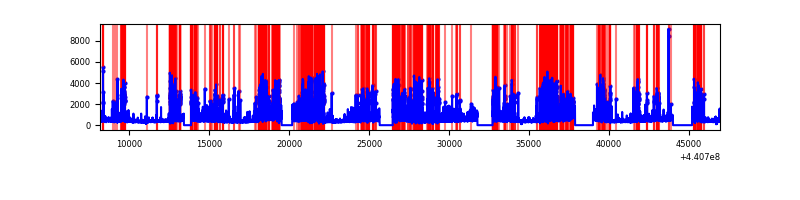 |
Top three noisy pixels from each quadrant. If the there are fewer than three noisy pixels in the level2.evt file, extra rows are filled as -1
| Pixel properties | Quadrant properties | ||||||
|---|---|---|---|---|---|---|---|
| Quadrant | DetID | PixID | Counts | Sigma | Mean | Median | Sigma |
| A | 10 | 83 | 8452827 | 11029.52 | 3711 | 3631 | 766.1 |
| A | 0 | 243 | 57956 | 70.92 | 3711 | 3631 | 766.1 |
| A | 3 | 137 | 42691 | 50.99 | 3711 | 3631 | 766.1 |
| B | 5 | 172 | 1683893 | 2340.23 | 3667 | 3553 | 718.0 |
| B | 0 | 189 | 165723 | 225.86 | 3667 | 3553 | 718.0 |
| B | 0 | 168 | 164492 | 224.14 | 3667 | 3553 | 718.0 |
| C | 14 | 254 | 810763 | 951.86 | 3624 | 3650 | 847.9 |
| C | 3 | 233 | 694072 | 814.24 | 3624 | 3650 | 847.9 |
| C | 2 | 14 | 148657 | 171.01 | 3624 | 3650 | 847.9 |
| D | 13 | 249 | 3232760 | 3673.14 | 3521 | 3417 | 879.2 |
| D | 1 | 52 | 2589956 | 2942.0 | 3521 | 3417 | 879.2 |
| D | 2 | 249 | 2520797 | 2863.33 | 3521 | 3417 | 879.2 |
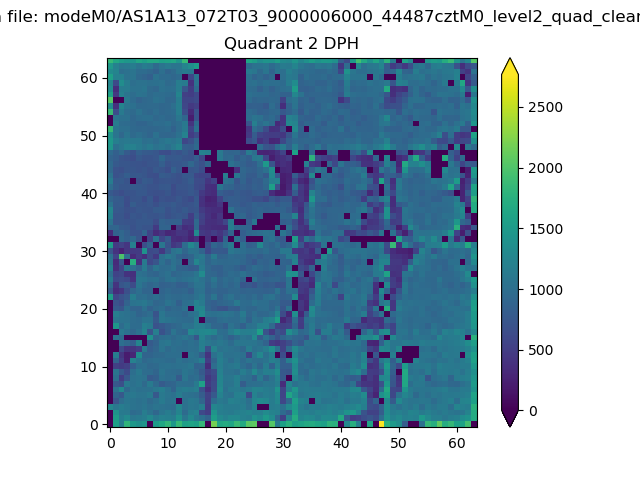
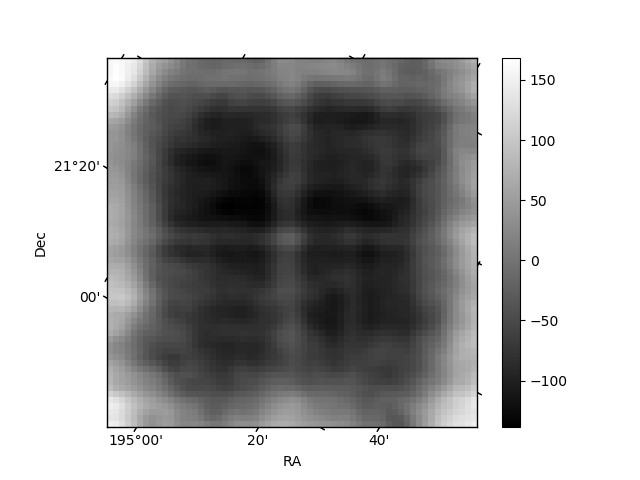
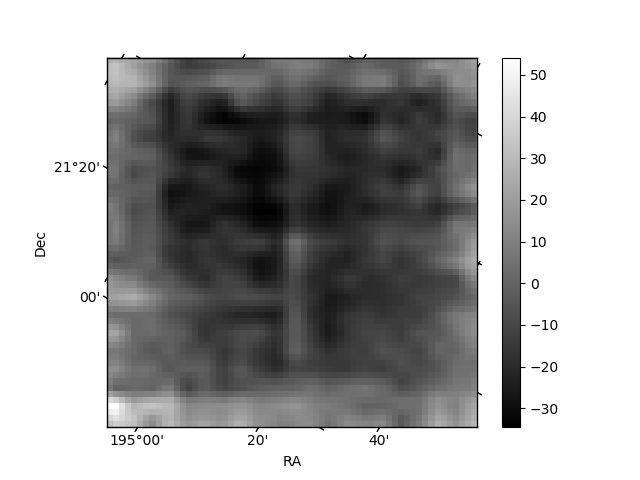
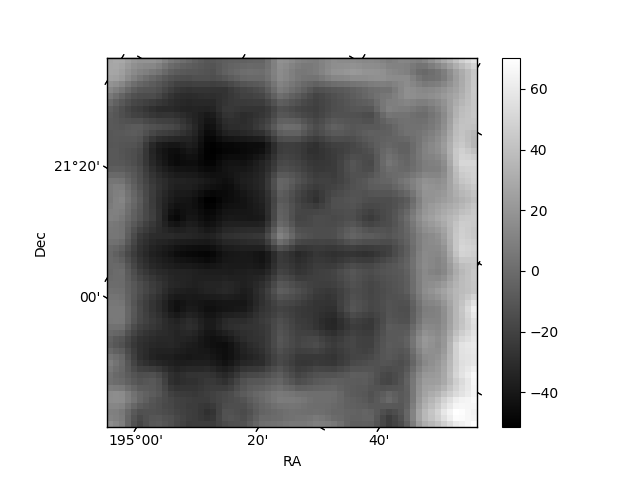
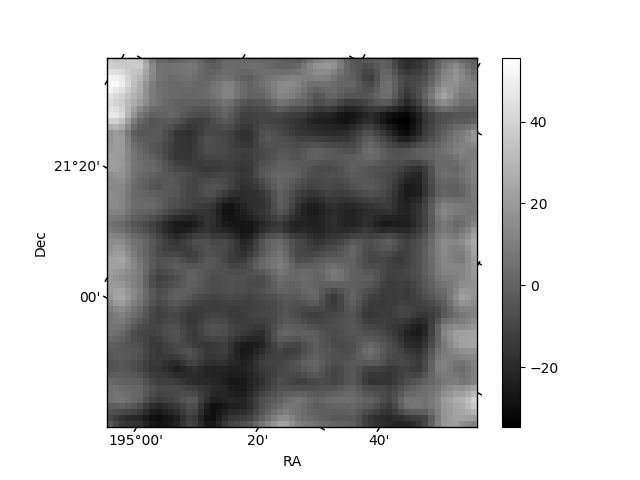
Histogram calculated using DETX and DETY for each event in the final _common_clean file
| Quadrant A | 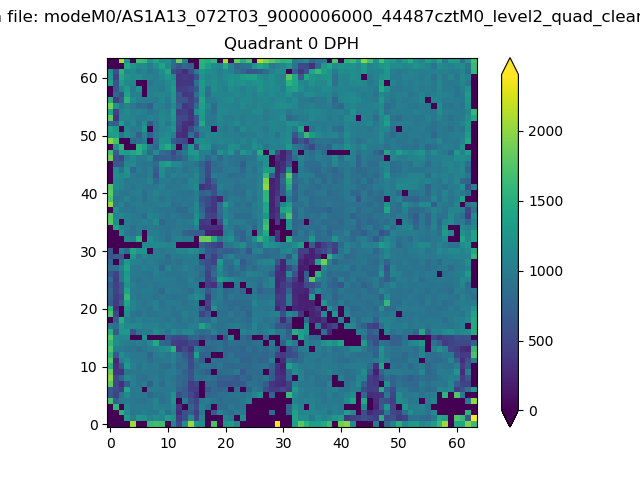 |
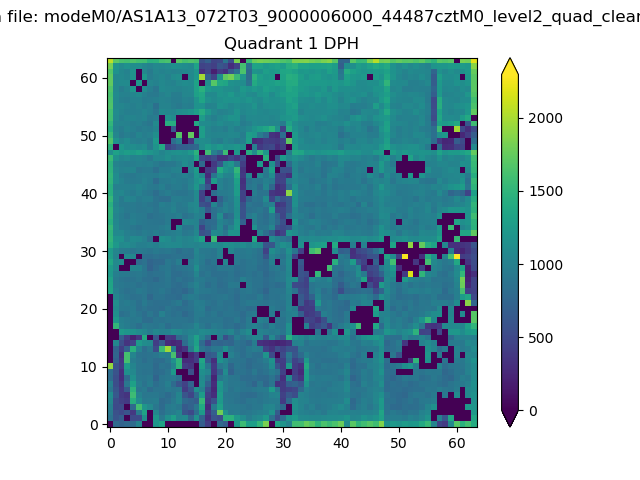 |
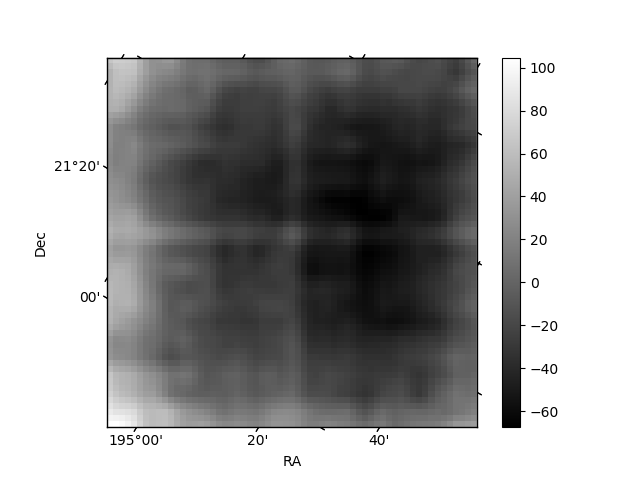
Quadrant B |
|---|---|---|---|
| Quadrant D | 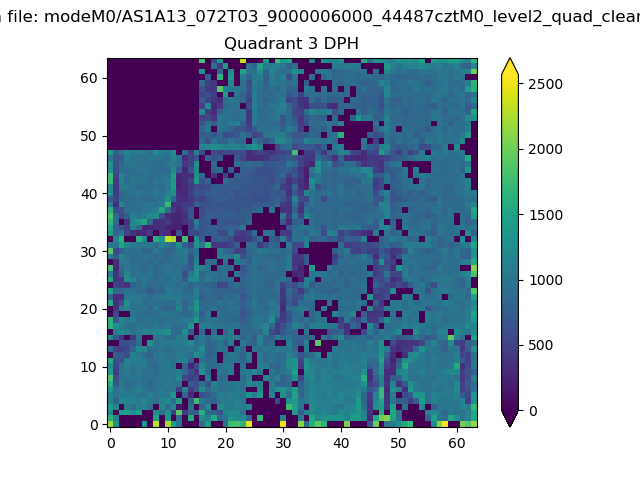 |
 |
Quadrant C |
| Plot type | Count rate plots | Images |
|---|---|---|
| Comparison with Poisson distribution Blue bars denote a histogram of data divided into 1 sec bins. Red curve is a Poisson curve with rate = median count rate of data. |
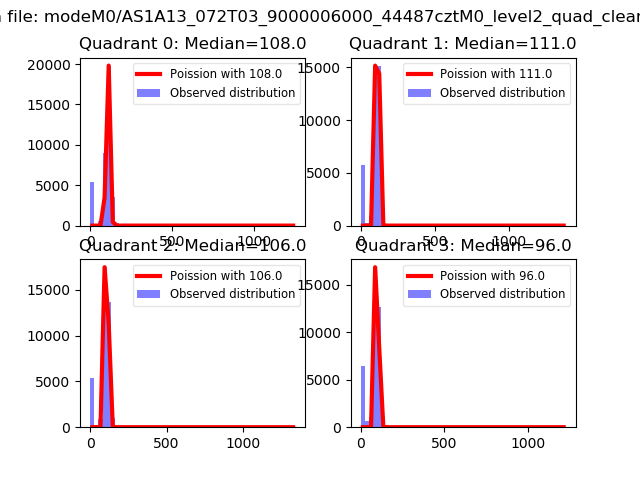 |
 |
| Quadrant-wise count rates Data is divided into 100 sec bins |
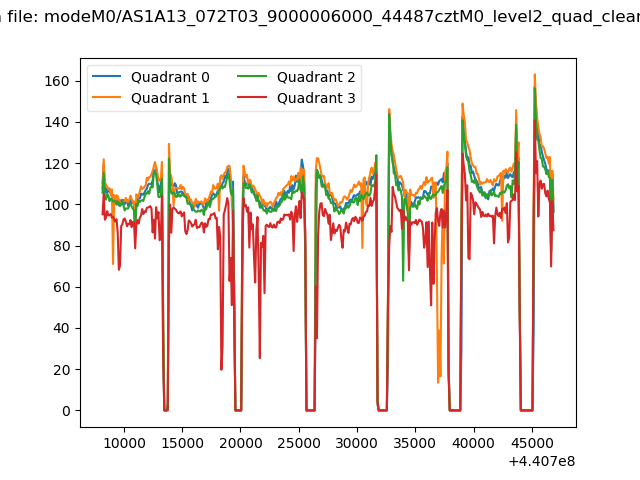 |
|
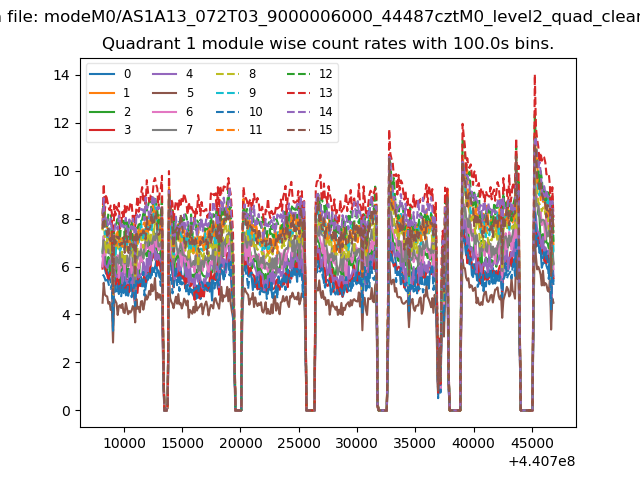
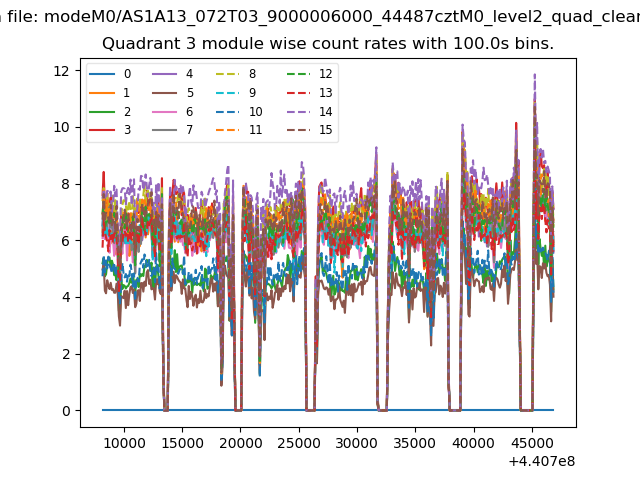
| Module-wise count rates for Quadrant A Data is divided into 100 sec bins |
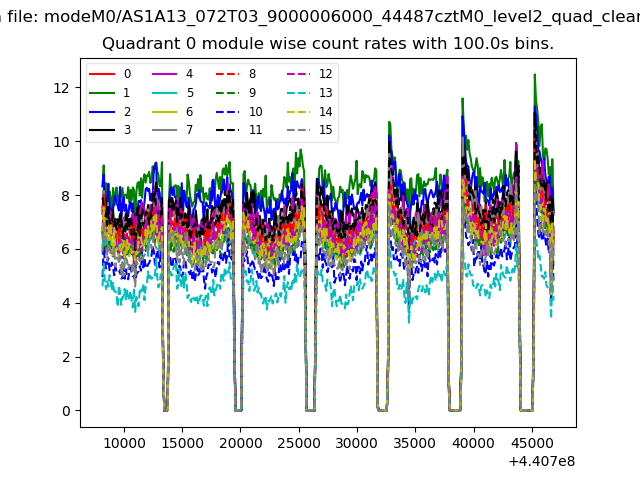 |
 |
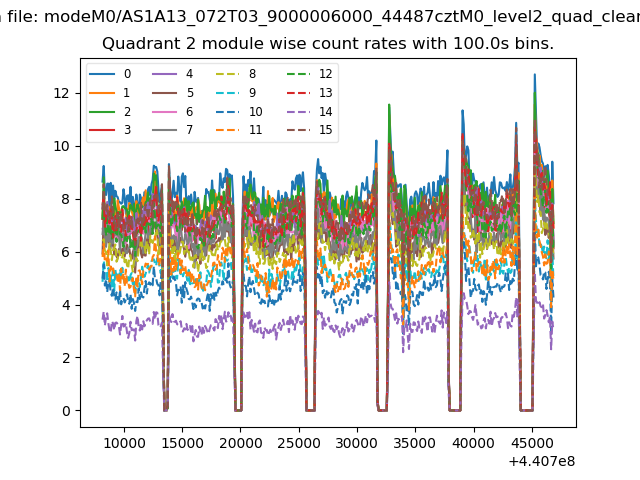
| Module-wise count rates for Quadrant B Data is divided into 100 sec bins |
 |
 |
| Module-wise count rates for Quadrant C Data is divided into 100 sec bins |
 |
 |
| Module-wise count rates for Quadrant D Data is divided into 100 sec bins |
 |
 |
| Parameter | Plot |
|---|---|
| CZT HV Monitor | 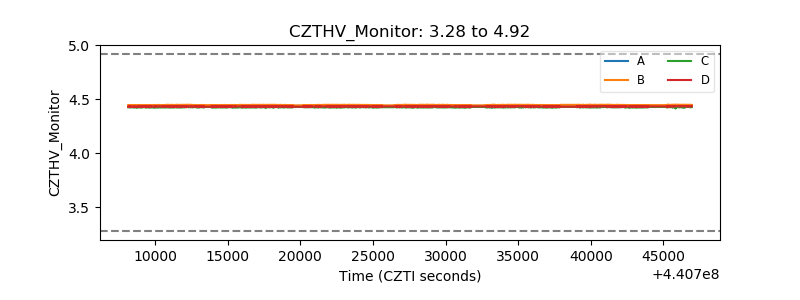 |
| D_VDD | 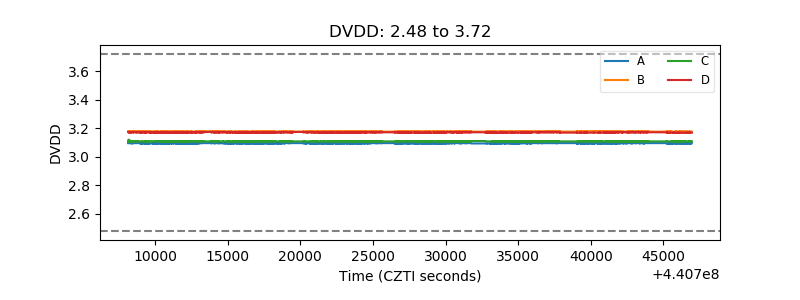 |
| Temperature 1 | 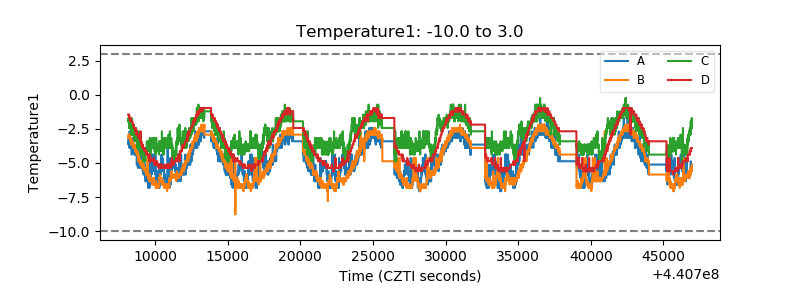 |
| Veto HV Monitor | 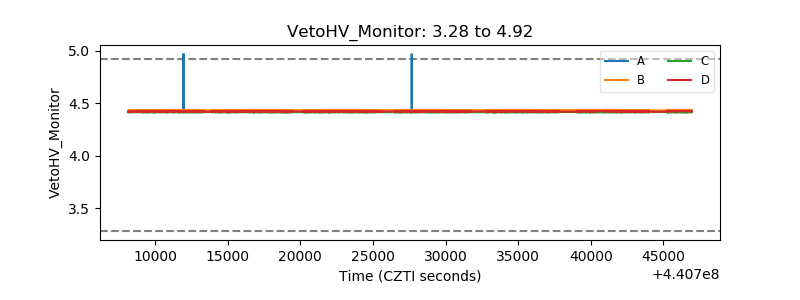 |
| Veto LLD | 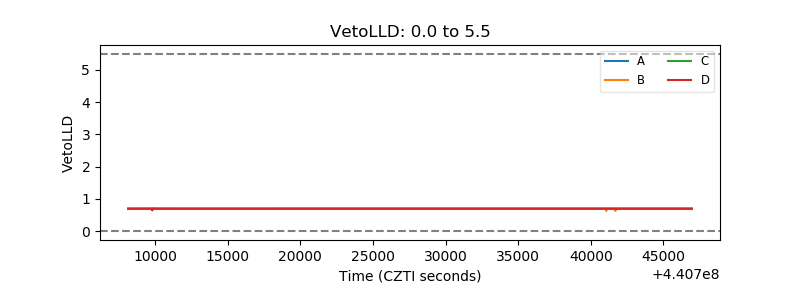 |
| Alpha Counter | 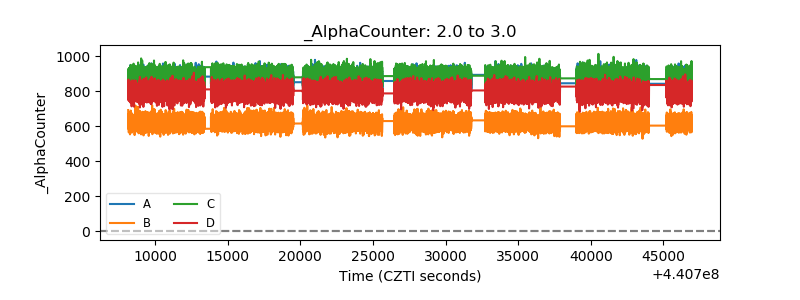 |
| _CPM_Rate | 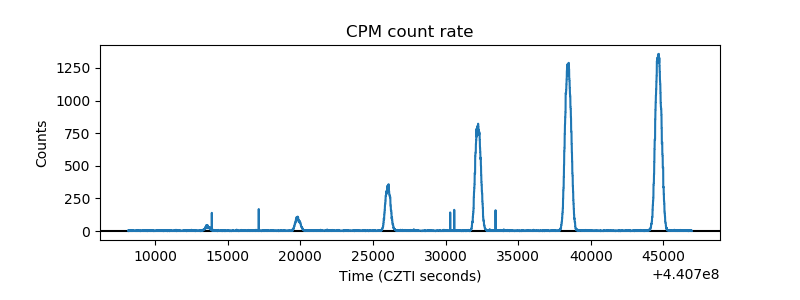 |
| CZT Counter | 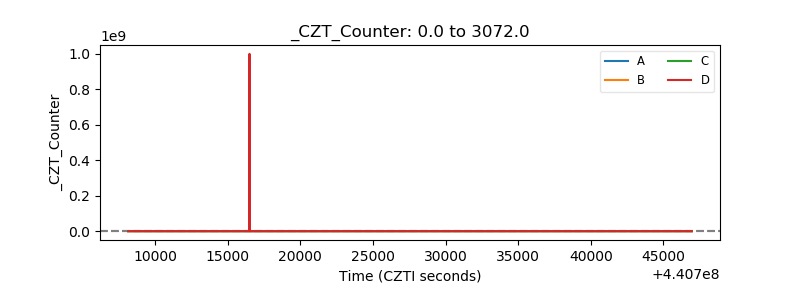 |
| +2.5 Volts monitor | 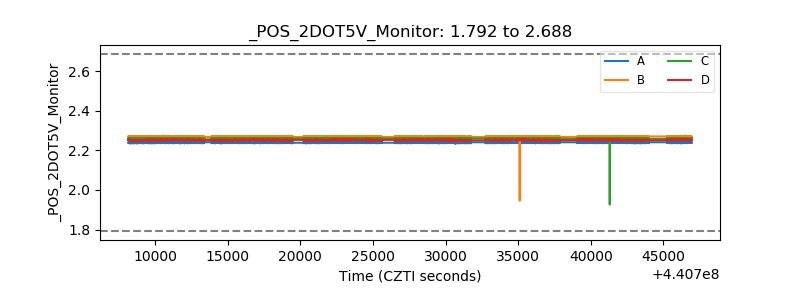 |
| +5 Volts monitor | 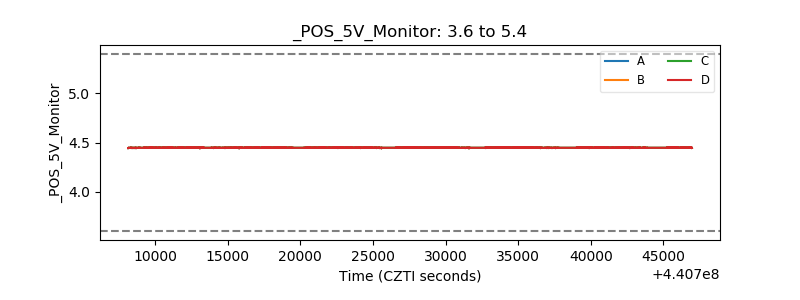 |
| _ROLL_ROT | 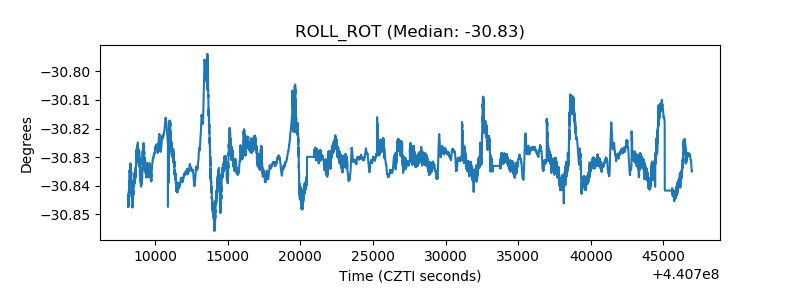 |
| _Roll_DEC | 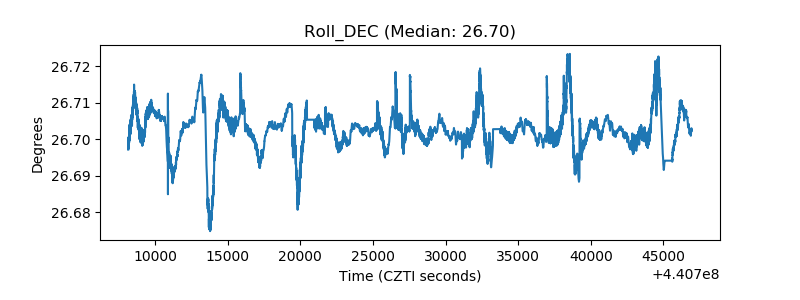 |
| _Roll_RA | 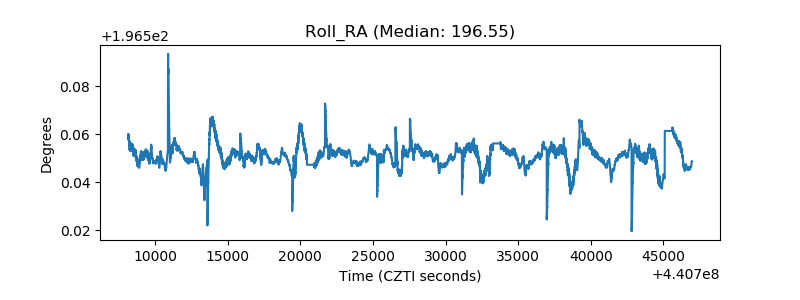 |
| Veto Counter |  |