| Param | Original file | Final file |
|---|---|---|
| Filename | modeM0/AS1A13_072T03_9000006000_44488cztM0_level2.fits | modeM0/AS1A13_072T03_9000006000_44488cztM0_level2_quad_clean.evt |
| Size (bytes) | 421,352,640 | 106,738,560 |
| Size | 401.8 MB | 101.8 MB |
| Events in quadrant A | 4,399,709 | 729,148 |
| Events in quadrant B | 3,247,668 | 743,704 |
| Events in quadrant C | 3,007,835 | 715,378 |
| Events in quadrant D | 4,458,776 | 610,410 |
| Mode SS | |||
|---|---|---|---|
| Quadrant | BADHDUFLAG | Total packets | Discarded packets |
| A | 0 | 126 | 0 |
| B | 0 | 126 | 0 |
| C | 0 | 126 | 0 |
| D | 0 | 126 | 0 |
| Mode M9 | |||
|---|---|---|---|
| Quadrant | BADHDUFLAG | Total packets | Discarded packets |
| A | 0 | 12 | 0 |
| B | 0 | 12 | 0 |
| C | 0 | 12 | 0 |
| D | 0 | 12 | 0 |
| Mode M0 | |||
|---|---|---|---|
| Quadrant | BADHDUFLAG | Total packets | Discarded packets |
| A | 0 | 18429 | 1 |
| B | 0 | 13898 | 1 |
| C | 0 | 13173 | 1 |
| D | 0 | 17656 | 5 |
| Quadrant | Total seconds | Saturated seconds | Saturation percentage |
|---|---|---|---|
| A | 6213 | 85 | 1.368099% |
| B | 6213 | 217 | 3.492677% |
| C | 6213 | 38 | 0.611621% |
| D | 6212 | 466 | 7.501610% |
Noise dominated data is calculated using 1-second bins in cleaned event files. If a bin has >2000 counts, and if more than 50% of those come from <1% of pixels, then it is considered to be noise-dominated and hence unusable.
| Quadrant | # 1 sec bins | Bins with >0 counts | Bins with >2000 counts | High rate bins dominated by noise | Noise dominated (total time) | Noise dominated (detector-on time) | Marked lightcurve |
|---|---|---|---|---|---|---|---|
| A | 7465 | 6247 | 4 | 4 | 0.05% | 0.06% | 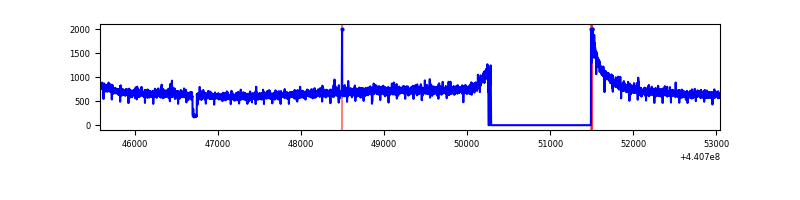 |
| B | 7465 | 6247 | 111 | 111 | 1.49% | 1.78% | 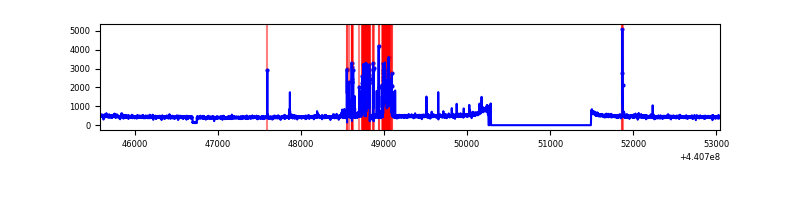 |
| C | 7465 | 6247 | 14 | 14 | 0.19% | 0.22% | 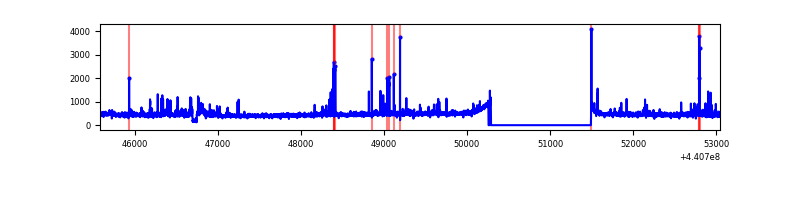 |
| D | 7464 | 6246 | 357 | 357 | 4.78% | 5.72% |  |
Top three noisy pixels from each quadrant. If the there are fewer than three noisy pixels in the level2.evt file, extra rows are filled as -1
| Pixel properties | Quadrant properties | ||||||
|---|---|---|---|---|---|---|---|
| Quadrant | DetID | PixID | Counts | Sigma | Mean | Median | Sigma |
| A | 10 | 83 | 1603180 | 10749.82 | 721 | 707 | 149.1 |
| A | 0 | 243 | 9819 | 61.13 | 721 | 707 | 149.1 |
| A | 3 | 137 | 7862 | 48.0 | 721 | 707 | 149.1 |
| B | 5 | 172 | 402915 | 2909.81 | 710 | 688 | 138.2 |
| B | 0 | 189 | 17291 | 120.11 | 710 | 688 | 138.2 |
| B | 12 | 111 | 17261 | 119.89 | 710 | 688 | 138.2 |
| C | 14 | 254 | 123708 | 744.91 | 704 | 708 | 165.1 |
| C | 3 | 233 | 93652 | 562.88 | 704 | 708 | 165.1 |
| C | 1 | 3 | 15665 | 90.58 | 704 | 708 | 165.1 |
| D | 2 | 249 | 632348 | 3687.76 | 679 | 659 | 171.3 |
| D | 13 | 187 | 485144 | 2828.4 | 679 | 659 | 171.3 |
| D | 12 | 233 | 242981 | 1414.66 | 679 | 659 | 171.3 |
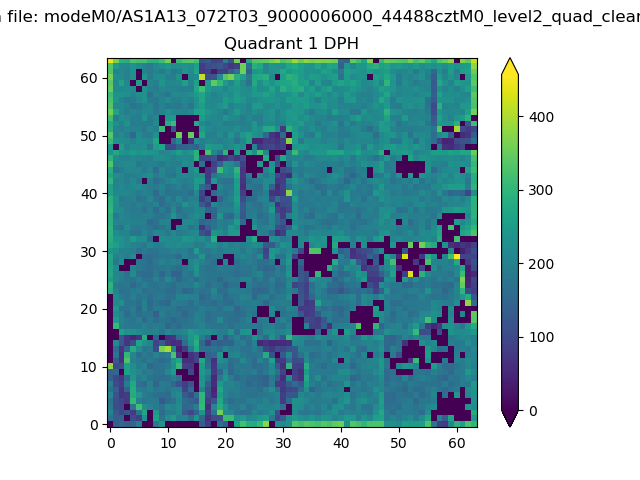
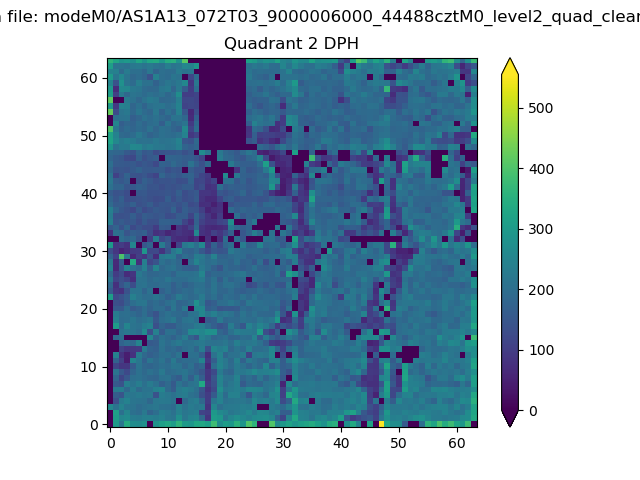
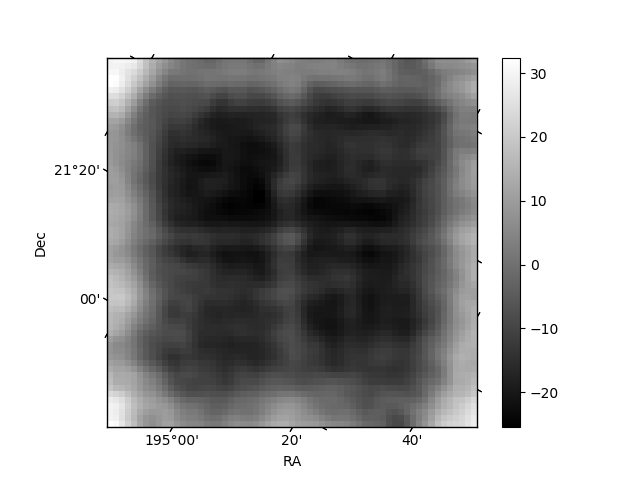
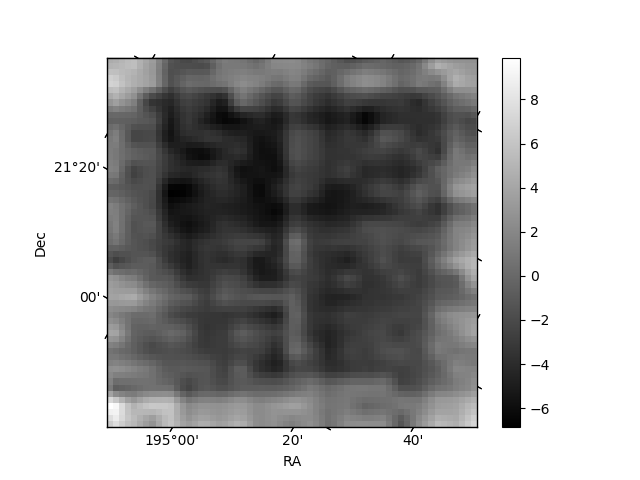
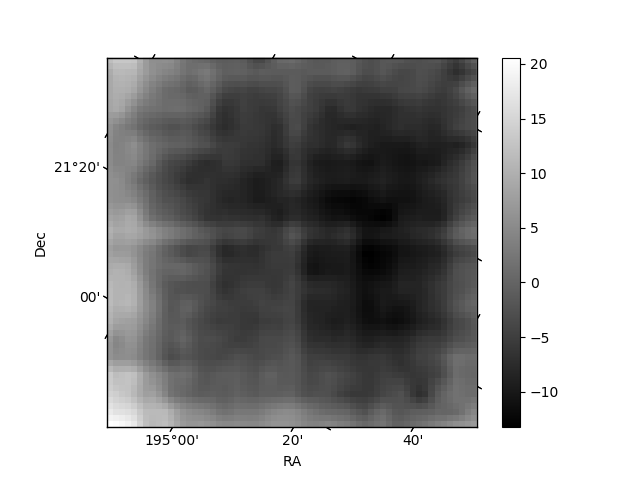
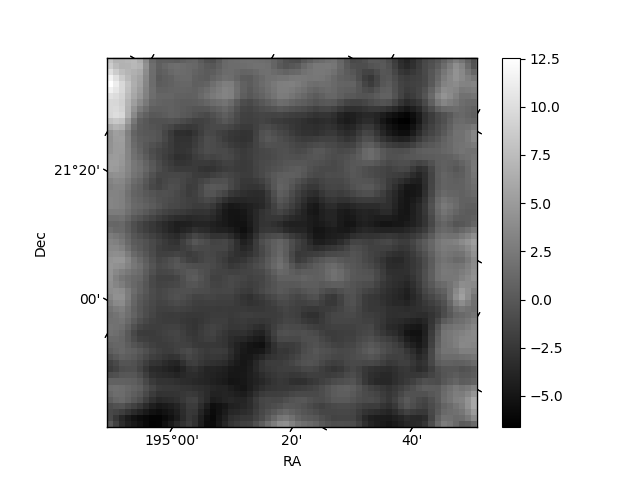
Histogram calculated using DETX and DETY for each event in the final _common_clean file
| Quadrant A | 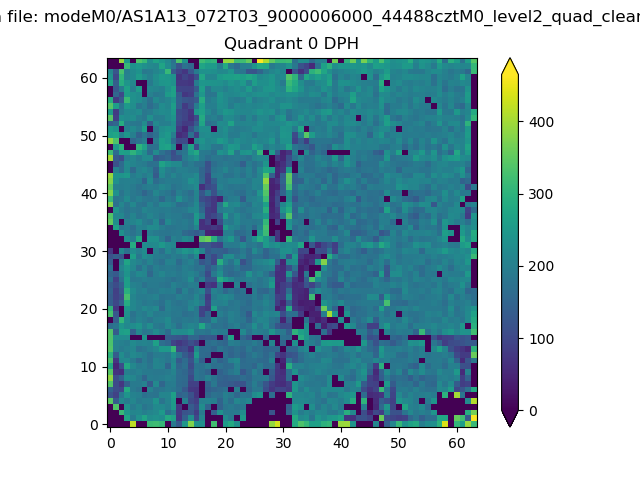 |
 |
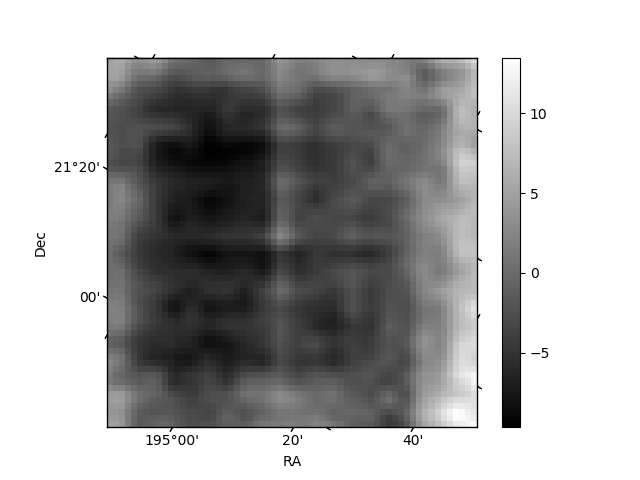
Quadrant B |
|---|---|---|---|
| Quadrant D | 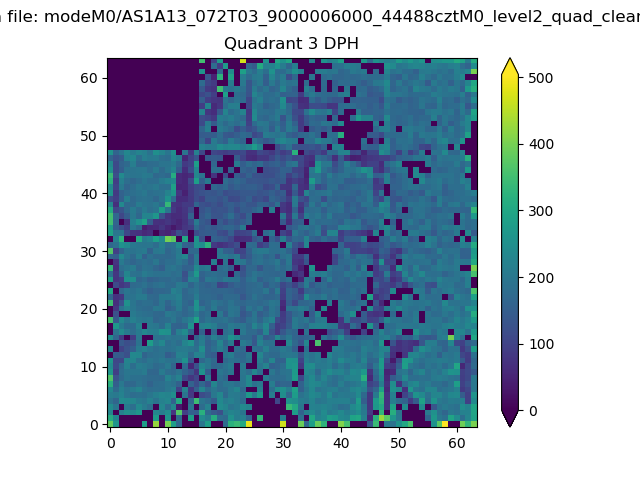 |
 |
Quadrant C |
| Plot type | Count rate plots | Images |
|---|---|---|
| Comparison with Poisson distribution Blue bars denote a histogram of data divided into 1 sec bins. Red curve is a Poisson curve with rate = median count rate of data. |
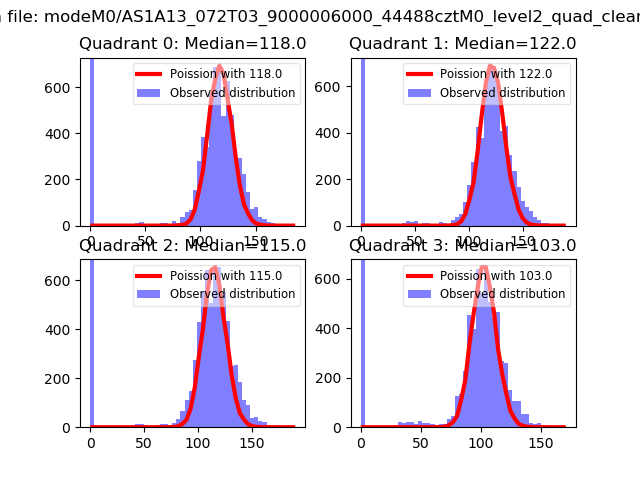 |
 |
| Quadrant-wise count rates Data is divided into 100 sec bins |
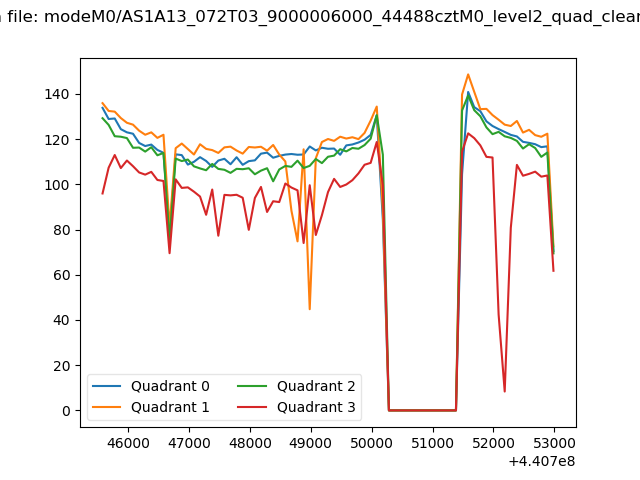 |
|
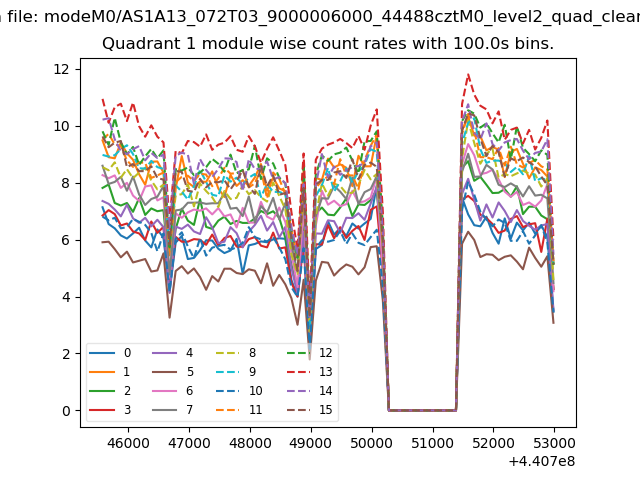
| Module-wise count rates for Quadrant A Data is divided into 100 sec bins |
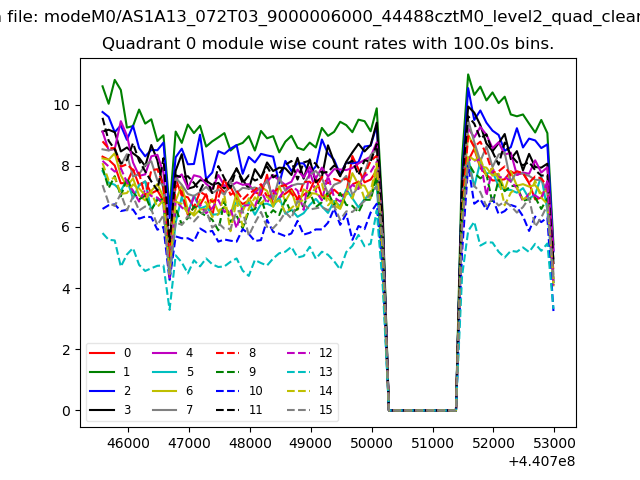 |
 |
| Module-wise count rates for Quadrant B Data is divided into 100 sec bins |
 |
 |
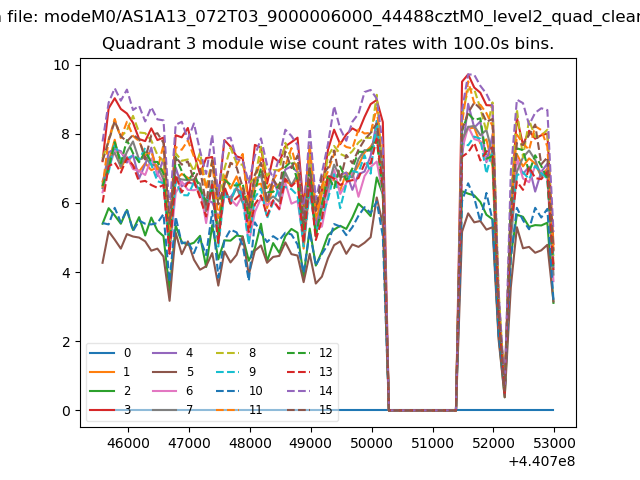
| Module-wise count rates for Quadrant C Data is divided into 100 sec bins |
 |
 |
| Module-wise count rates for Quadrant D Data is divided into 100 sec bins |
 |
 |
| Parameter | Plot |
|---|---|
| CZT HV Monitor | 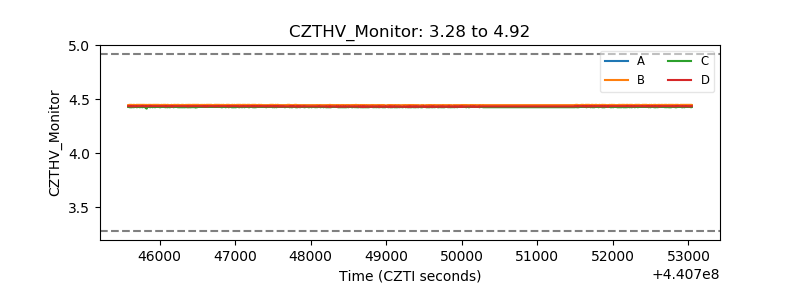 |
| D_VDD | 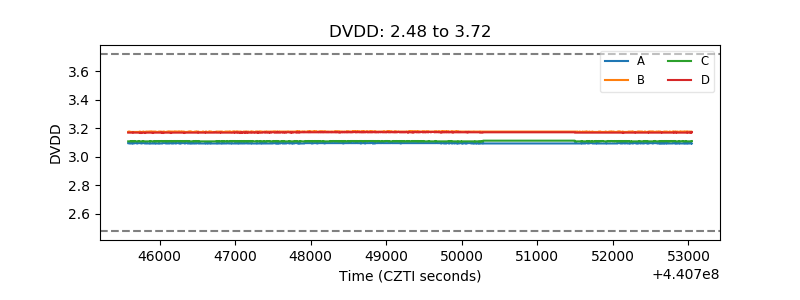 |
| Temperature 1 | 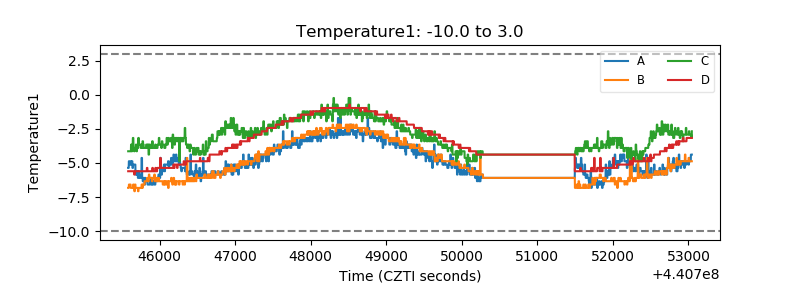 |
| Veto HV Monitor |  |
| Veto LLD | 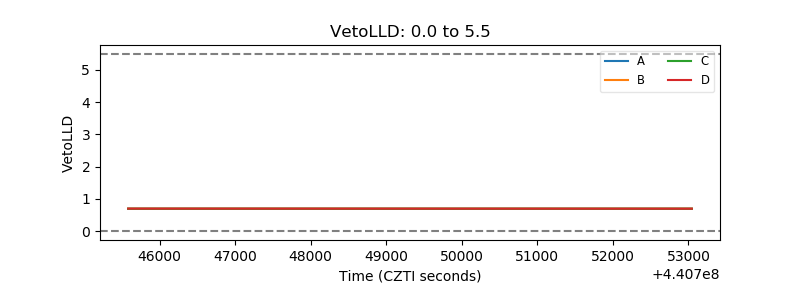 |
| Alpha Counter | 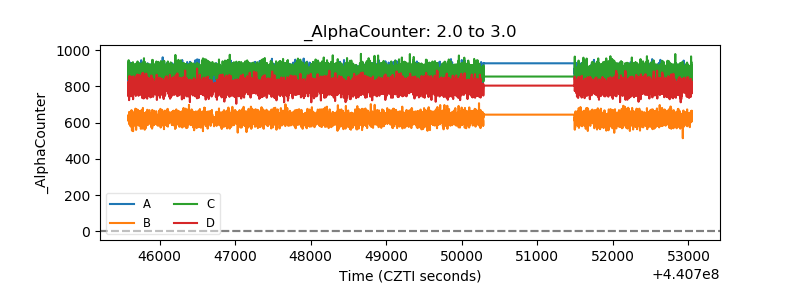 |
| _CPM_Rate | 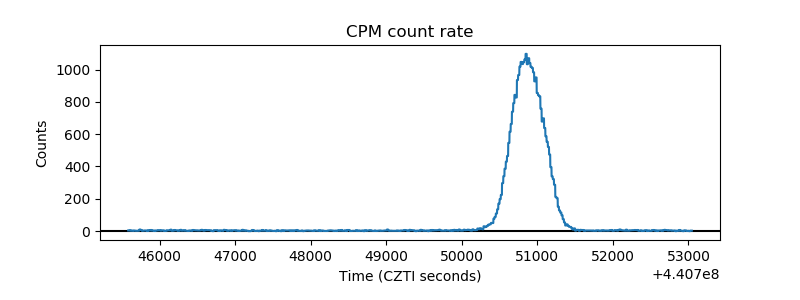 |
| CZT Counter | 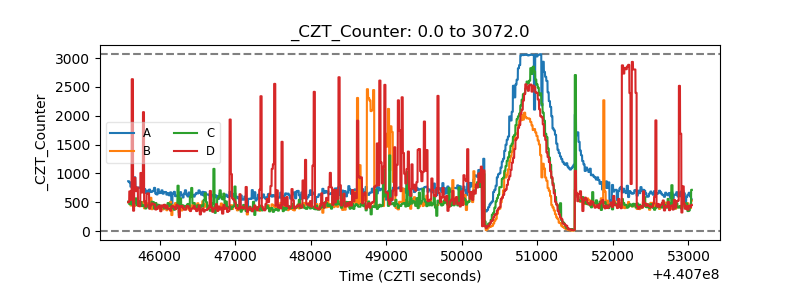 |
| +2.5 Volts monitor | 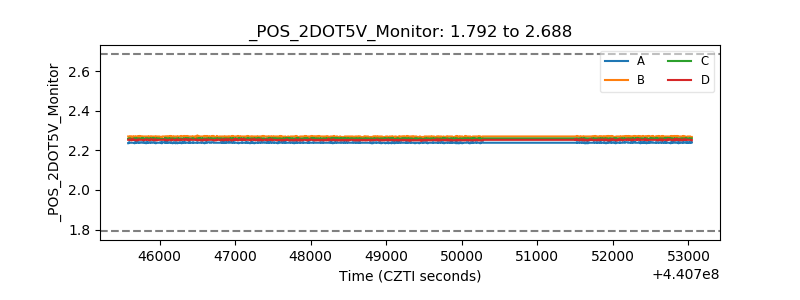 |
| +5 Volts monitor | 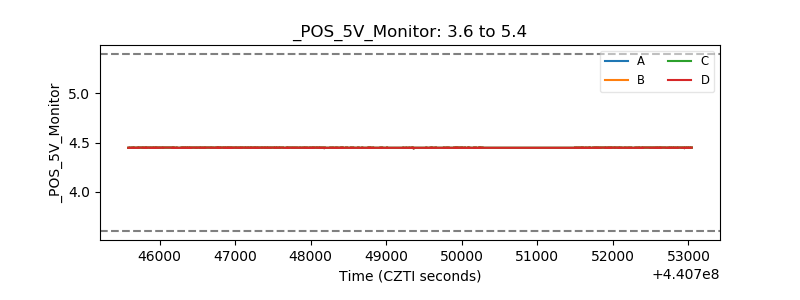 |
| _ROLL_ROT | 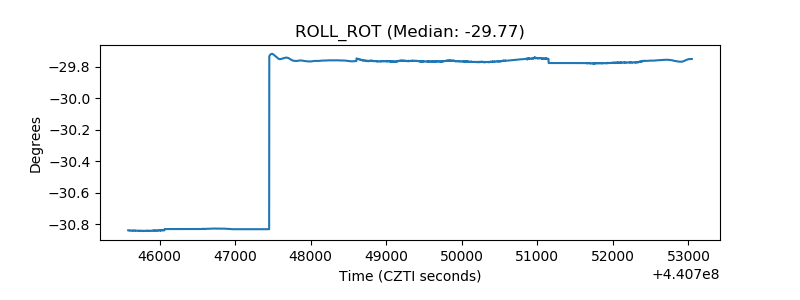 |
| _Roll_DEC | 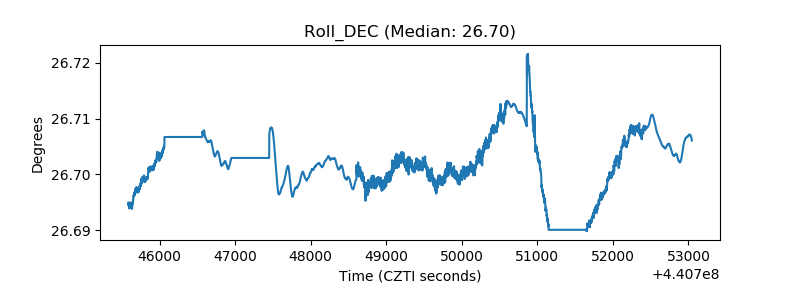 |
| _Roll_RA | 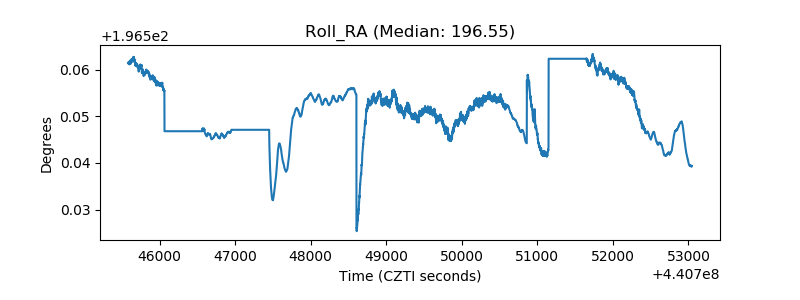 |
| Veto Counter | 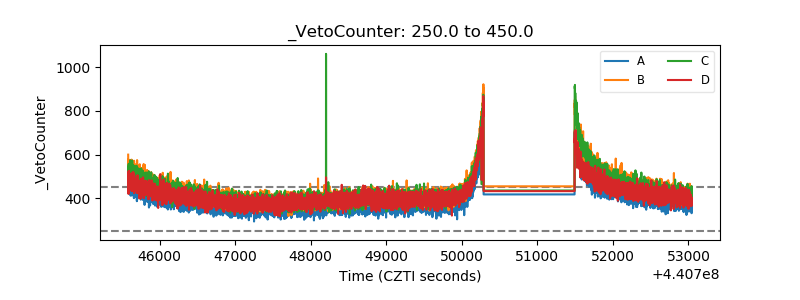 |