| Param | Original file | Final file |
|---|---|---|
| Filename | modeM0/AS1A13_072T03_9000006000_44491cztM0_level2.fits | modeM0/AS1A13_072T03_9000006000_44491cztM0_level2_quad_clean.evt |
| Size (bytes) | 1,553,610,240 | 389,571,840 |
| Size | 1.4 GB | 371.5 MB |
| Events in quadrant A | 16,714,031 | 2,620,682 |
| Events in quadrant B | 11,773,530 | 2,707,756 |
| Events in quadrant C | 11,716,182 | 2,588,930 |
| Events in quadrant D | 15,510,393 | 2,280,632 |
| Mode SS | |||
|---|---|---|---|
| Quadrant | BADHDUFLAG | Total packets | Discarded packets |
| A | 0 | 474 | 0 |
| B | 0 | 474 | 0 |
| C | 0 | 474 | 0 |
| D | 0 | 474 | 0 |
| Mode M9 | |||
|---|---|---|---|
| Quadrant | BADHDUFLAG | Total packets | Discarded packets |
| A | 0 | 53 | 0 |
| B | 0 | 53 | 0 |
| C | 0 | 53 | 0 |
| D | 0 | 53 | 0 |
| Mode M0 | |||
|---|---|---|---|
| Quadrant | BADHDUFLAG | Total packets | Discarded packets |
| A | 0 | 70229 | 5 |
| B | 0 | 50722 | 5 |
| C | 0 | 50453 | 5 |
| D | 0 | 62131 | 5 |
| Quadrant | Total seconds | Saturated seconds | Saturation percentage |
|---|---|---|---|
| A | 23220 | 555 | 2.390181% |
| B | 23221 | 647 | 2.786271% |
| C | 23221 | 271 | 1.167047% |
| D | 23221 | 1313 | 5.654365% |
Noise dominated data is calculated using 1-second bins in cleaned event files. If a bin has >2000 counts, and if more than 50% of those come from <1% of pixels, then it is considered to be noise-dominated and hence unusable.
| Quadrant | # 1 sec bins | Bins with >0 counts | Bins with >2000 counts | High rate bins dominated by noise | Noise dominated (total time) | Noise dominated (detector-on time) | Marked lightcurve |
|---|---|---|---|---|---|---|---|
| A | 28535 | 23226 | 11 | 11 | 0.04% | 0.05% | 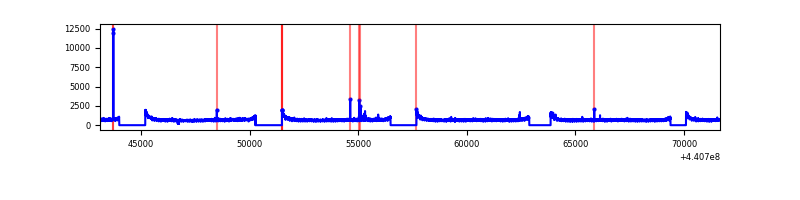 |
| B | 28536 | 23227 | 212 | 212 | 0.74% | 0.91% | 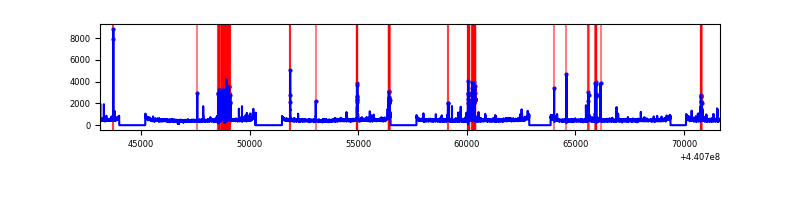 |
| C | 28536 | 23227 | 46 | 46 | 0.16% | 0.20% | 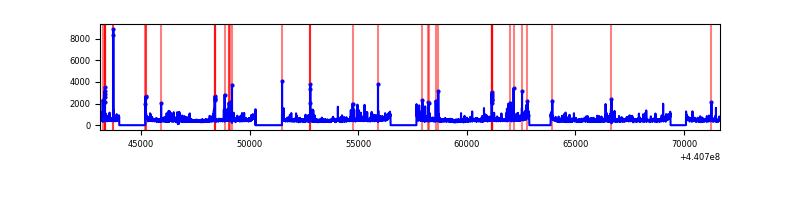 |
| D | 28536 | 23227 | 856 | 856 | 3.00% | 3.69% | 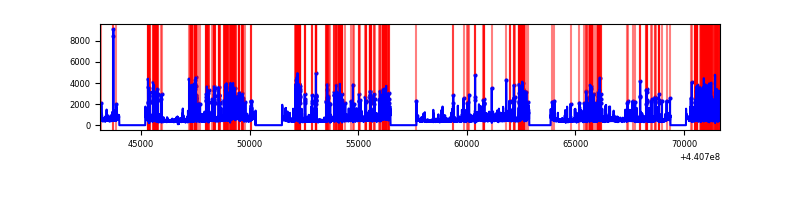 |
Top three noisy pixels from each quadrant. If the there are fewer than three noisy pixels in the level2.evt file, extra rows are filled as -1
| Pixel properties | Quadrant properties | ||||||
|---|---|---|---|---|---|---|---|
| Quadrant | DetID | PixID | Counts | Sigma | Mean | Median | Sigma |
| A | 10 | 83 | 6141697 | 10972.91 | 2718 | 2658 | 559.5 |
| A | 0 | 243 | 33100 | 54.41 | 2718 | 2658 | 559.5 |
| A | 3 | 137 | 30403 | 49.59 | 2718 | 2658 | 559.5 |
| B | 5 | 172 | 709481 | 1347.91 | 2692 | 2602 | 524.4 |
| B | 0 | 168 | 169745 | 318.72 | 2692 | 2602 | 524.4 |
| B | 5 | 255 | 146294 | 274.0 | 2692 | 2602 | 524.4 |
| C | 3 | 233 | 757523 | 1212.12 | 2667 | 2689 | 622.7 |
| C | 14 | 254 | 388028 | 618.78 | 2667 | 2689 | 622.7 |
| C | 15 | 208 | 47268 | 71.58 | 2667 | 2689 | 622.7 |
| D | 2 | 249 | 2714575 | 4126.87 | 2621 | 2544 | 657.2 |
| D | 13 | 249 | 773155 | 1172.63 | 2621 | 2544 | 657.2 |
| D | 1 | 52 | 585255 | 886.71 | 2621 | 2544 | 657.2 |
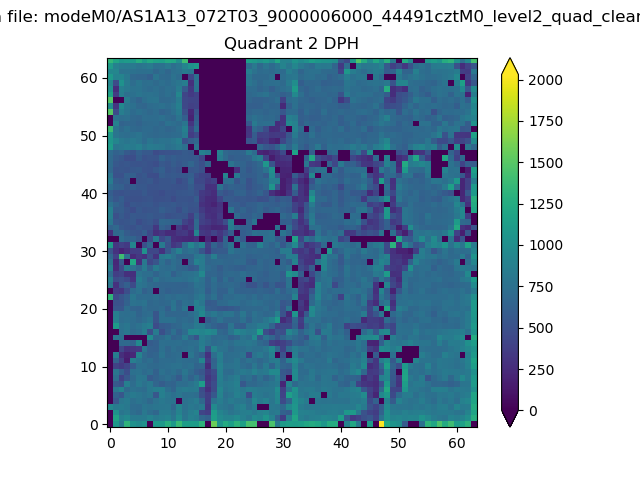
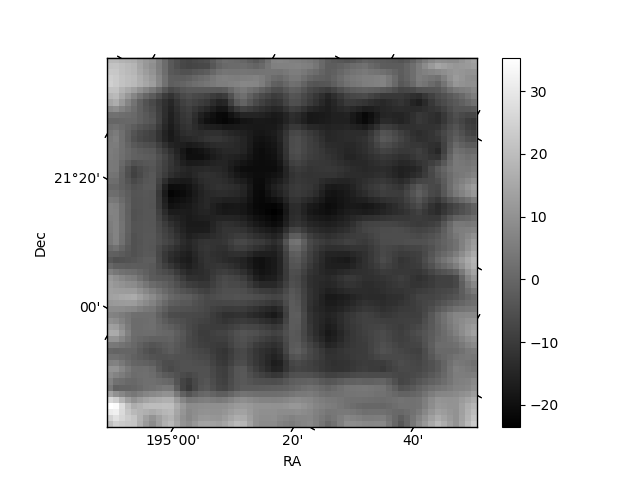
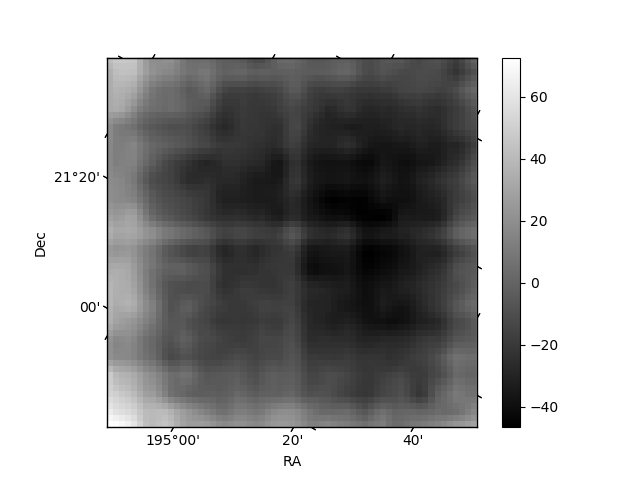
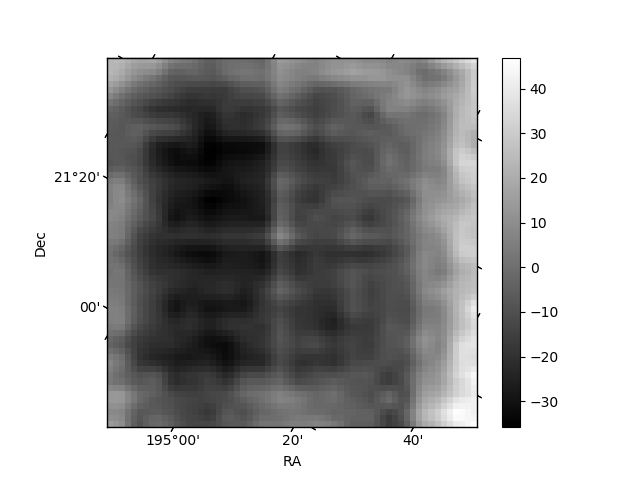
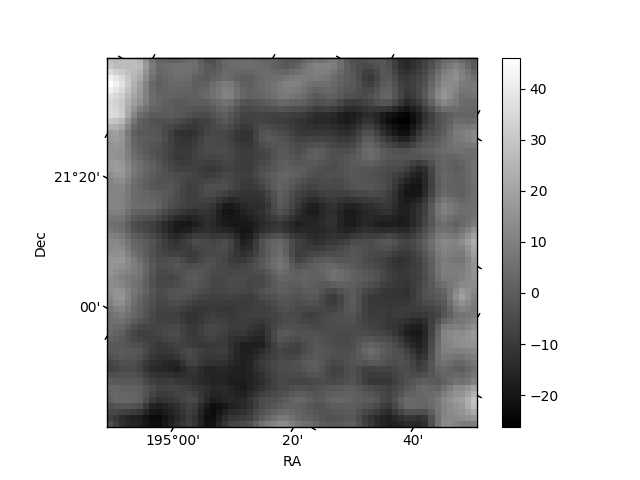
Histogram calculated using DETX and DETY for each event in the final _common_clean file
| Quadrant A | 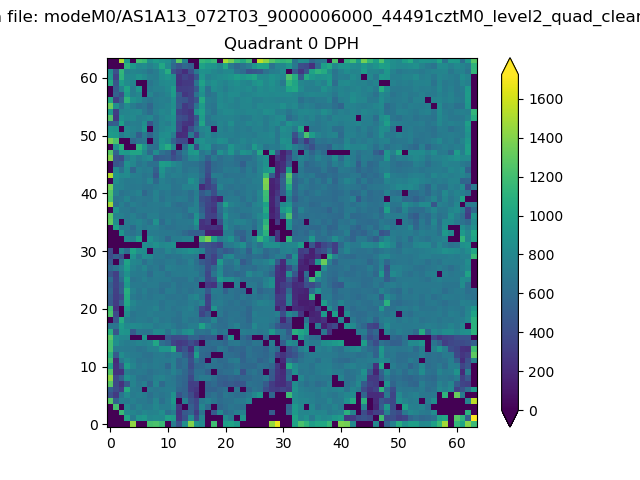 |
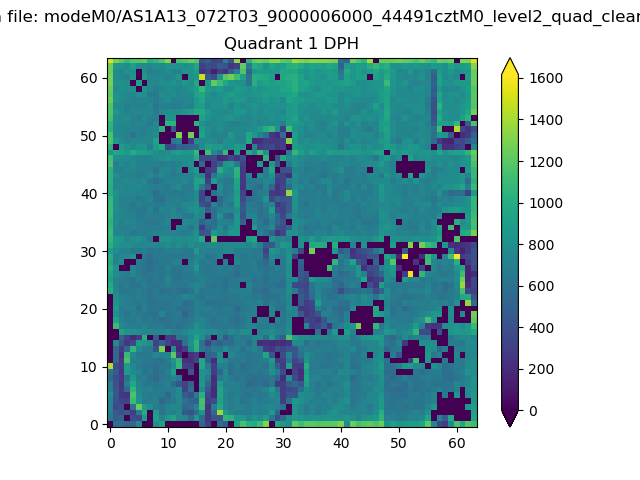 |
Quadrant B |
|---|---|---|---|
| Quadrant D | 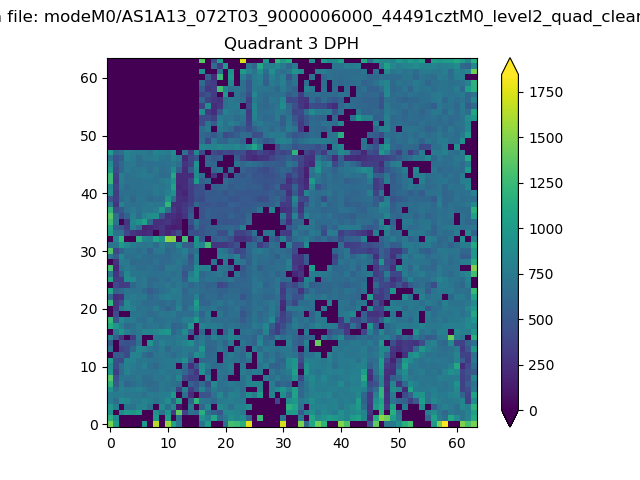 |
 |
Quadrant C |
| Plot type | Count rate plots | Images |
|---|---|---|
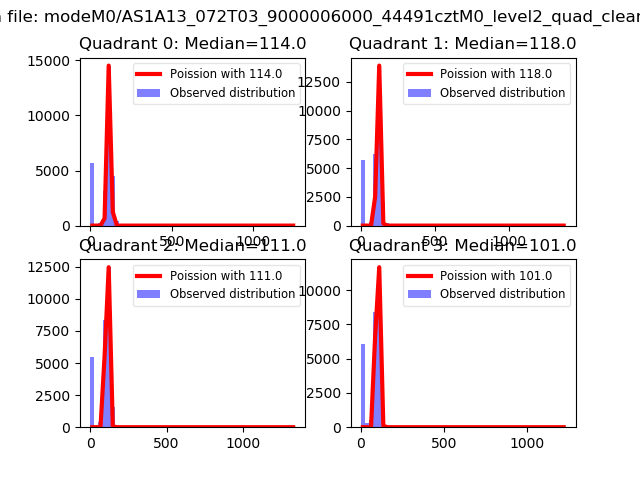
| Comparison with Poisson distribution Blue bars denote a histogram of data divided into 1 sec bins. Red curve is a Poisson curve with rate = median count rate of data. |
 |
 |
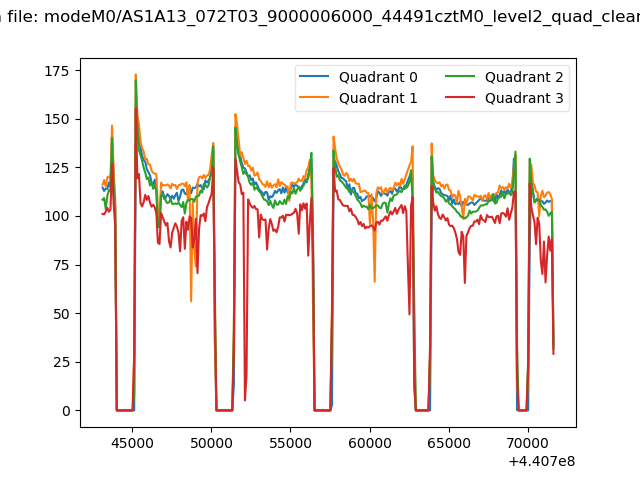
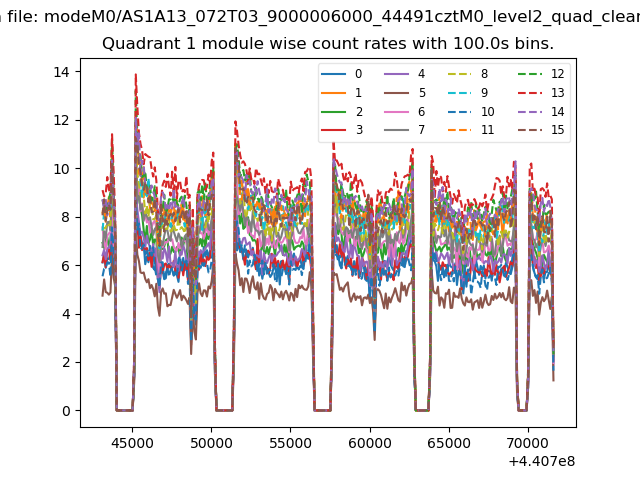
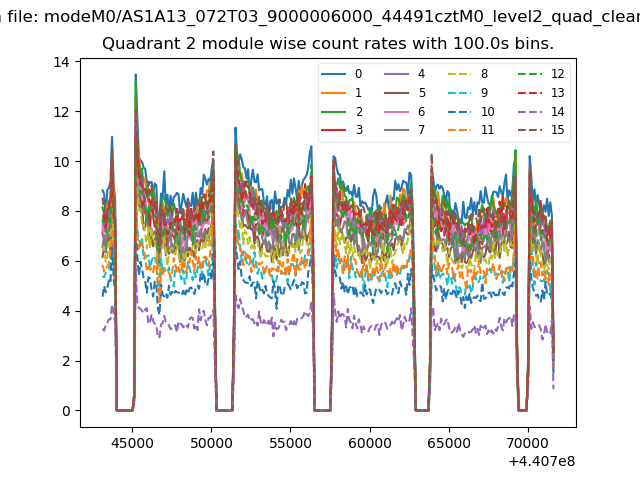
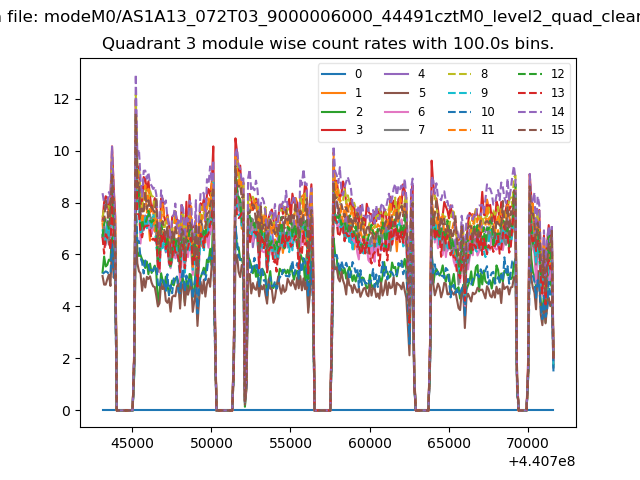
| Quadrant-wise count rates Data is divided into 100 sec bins |
 |
|
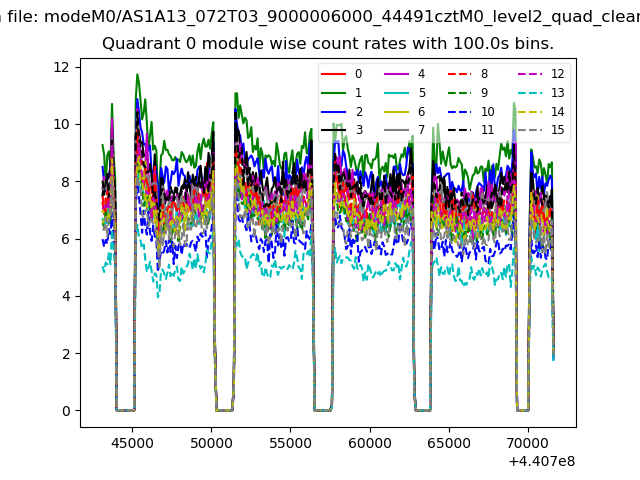
| Module-wise count rates for Quadrant A Data is divided into 100 sec bins |
 |
 |
| Module-wise count rates for Quadrant B Data is divided into 100 sec bins |
 |
 |
| Module-wise count rates for Quadrant C Data is divided into 100 sec bins |
 |
 |
| Module-wise count rates for Quadrant D Data is divided into 100 sec bins |
 |
 |
| Parameter | Plot |
|---|---|
| CZT HV Monitor | 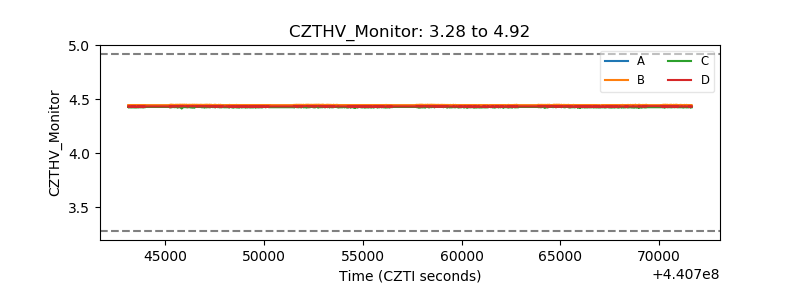 |
| D_VDD | 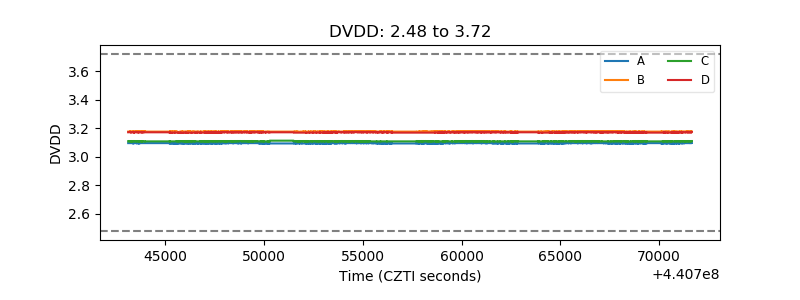 |
| Temperature 1 | 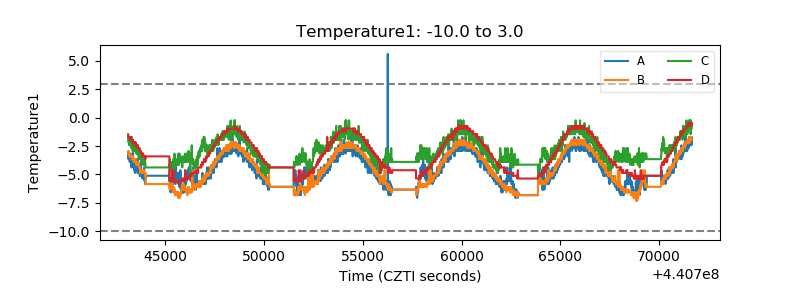 |
| Veto HV Monitor | 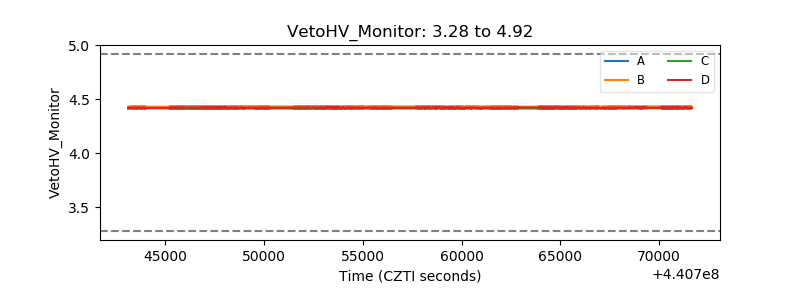 |
| Veto LLD | 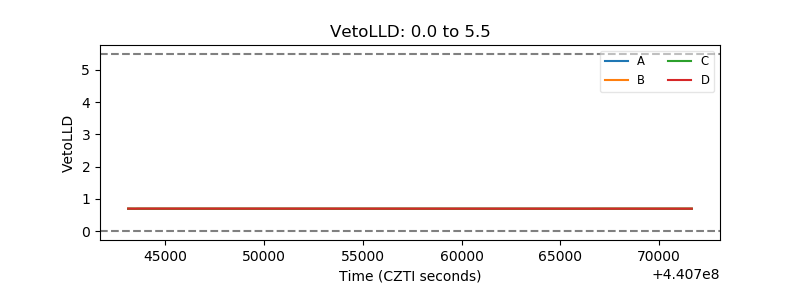 |
| Alpha Counter | 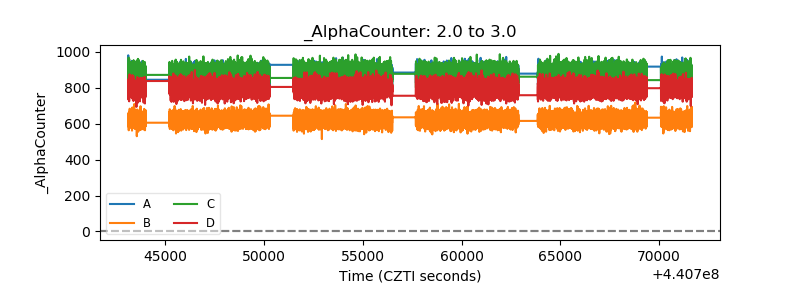 |
| _CPM_Rate | 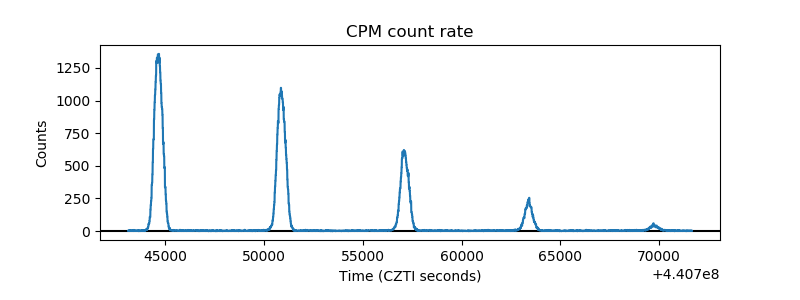 |
| CZT Counter | 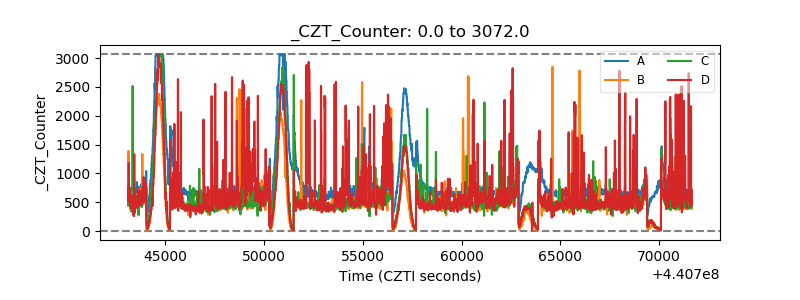 |
| +2.5 Volts monitor | 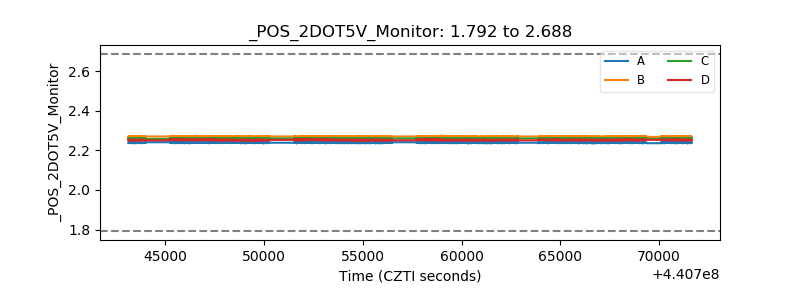 |
| +5 Volts monitor | 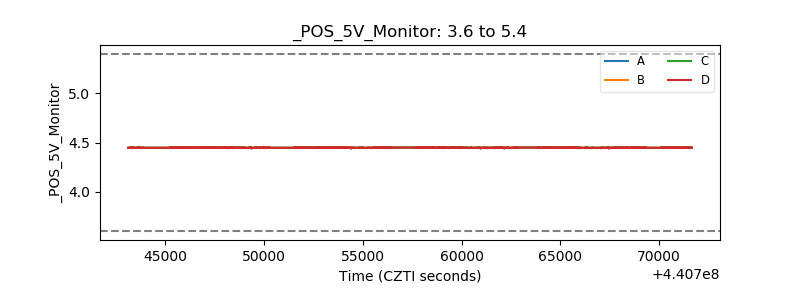 |
| _ROLL_ROT |  |
| _Roll_DEC | 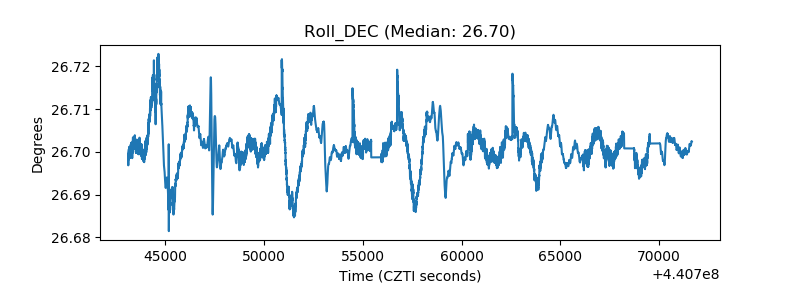 |
| _Roll_RA | 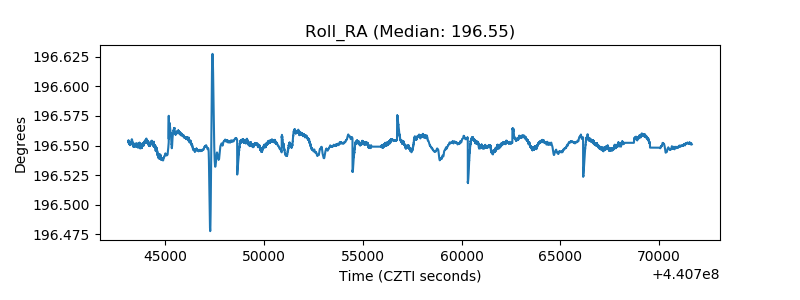 |
| Veto Counter | 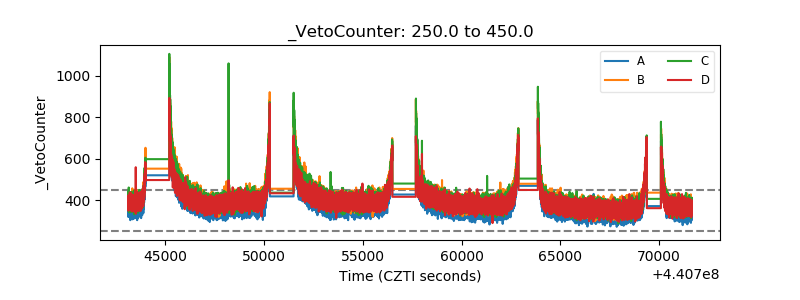 |