| Param | Original file | Final file |
|---|---|---|
| Filename | modeM0/AS1A13_072T03_9000006000_44500cztM0_level2.fits | modeM0/AS1A13_072T03_9000006000_44500cztM0_level2_quad_clean.evt |
| Size (bytes) | 766,866,240 | 172,149,120 |
| Size | 731.3 MB | 164.2 MB |
| Events in quadrant A | 7,482,702 | 1,177,251 |
| Events in quadrant B | 7,820,886 | 1,104,260 |
| Events in quadrant C | 5,528,435 | 1,152,894 |
| Events in quadrant D | 6,704,749 | 1,018,330 |
| Mode SS | |||
|---|---|---|---|
| Quadrant | BADHDUFLAG | Total packets | Discarded packets |
| A | 0 | 224 | 0 |
| B | 0 | 224 | 0 |
| C | 0 | 224 | 0 |
| D | 0 | 224 | 0 |
| Mode M9 | |||
|---|---|---|---|
| Quadrant | BADHDUFLAG | Total packets | Discarded packets |
| A | 0 | 21 | 0 |
| B | 0 | 21 | 0 |
| C | 0 | 21 | 0 |
| D | 0 | 21 | 0 |
| Mode M0 | |||
|---|---|---|---|
| Quadrant | BADHDUFLAG | Total packets | Discarded packets |
| A | 0 | 30588 | 2 |
| B | 0 | 31282 | 2 |
| C | 0 | 24248 | 2 |
| D | 0 | 28006 | 5 |
| Quadrant | Total seconds | Saturated seconds | Saturation percentage |
|---|---|---|---|
| A | 10968 | 108 | 0.984683% |
| B | 10969 | 1109 | 10.110311% |
| C | 10969 | 57 | 0.519646% |
| D | 10968 | 535 | 4.877826% |
Noise dominated data is calculated using 1-second bins in cleaned event files. If a bin has >2000 counts, and if more than 50% of those come from <1% of pixels, then it is considered to be noise-dominated and hence unusable.
| Quadrant | # 1 sec bins | Bins with >0 counts | Bins with >2000 counts | High rate bins dominated by noise | Noise dominated (total time) | Noise dominated (detector-on time) | Marked lightcurve |
|---|---|---|---|---|---|---|---|
| A | 13018 | 10970 | 13 | 13 | 0.10% | 0.12% | 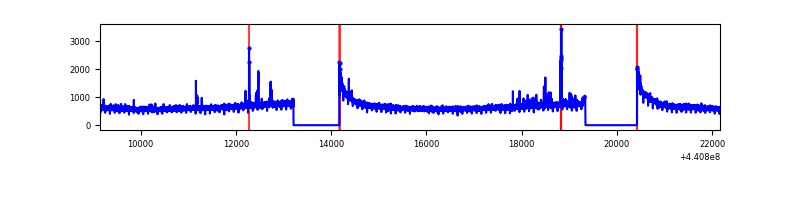 |
| B | 13019 | 10971 | 822 | 822 | 6.31% | 7.49% | 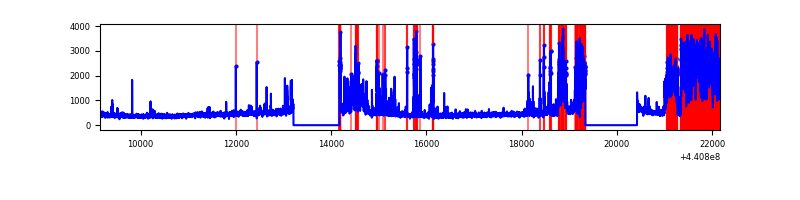 |
| C | 13019 | 10971 | 33 | 33 | 0.25% | 0.30% | 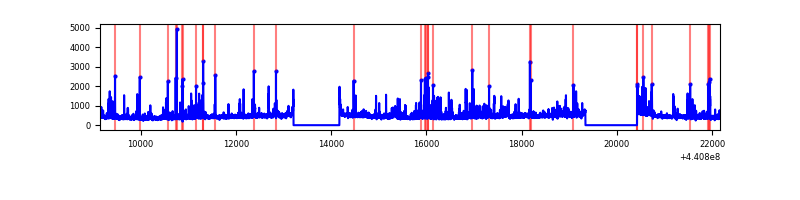 |
| D | 13018 | 10970 | 394 | 394 | 3.03% | 3.59% | 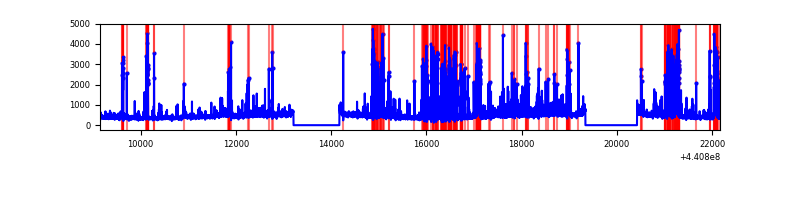 |
Top three noisy pixels from each quadrant. If the there are fewer than three noisy pixels in the level2.evt file, extra rows are filled as -1
| Pixel properties | Quadrant properties | ||||||
|---|---|---|---|---|---|---|---|
| Quadrant | DetID | PixID | Counts | Sigma | Mean | Median | Sigma |
| A | 10 | 83 | 2779268 | 11217.24 | 1194 | 1168 | 247.7 |
| A | 13 | 248 | 83498 | 332.43 | 1194 | 1168 | 247.7 |
| A | 0 | 243 | 21865 | 83.57 | 1194 | 1168 | 247.7 |
| B | 5 | 235 | 3022125 | 13457.76 | 1148 | 1114 | 224.5 |
| B | 5 | 172 | 89127 | 392.07 | 1148 | 1114 | 224.5 |
| B | 4 | 170 | 55485 | 242.21 | 1148 | 1114 | 224.5 |
| C | 3 | 233 | 625080 | 2271.5 | 1168 | 1177 | 274.7 |
| C | 14 | 254 | 268623 | 973.71 | 1168 | 1177 | 274.7 |
| C | 12 | 250 | 34140 | 120.01 | 1168 | 1177 | 274.7 |
| D | 1 | 52 | 1115021 | 3894.76 | 1136 | 1101 | 286.0 |
| D | 2 | 249 | 928949 | 3244.17 | 1136 | 1101 | 286.0 |
| D | 13 | 249 | 119185 | 412.87 | 1136 | 1101 | 286.0 |
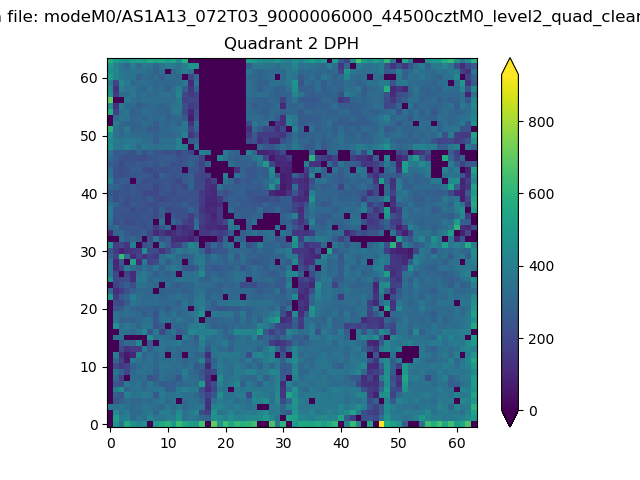
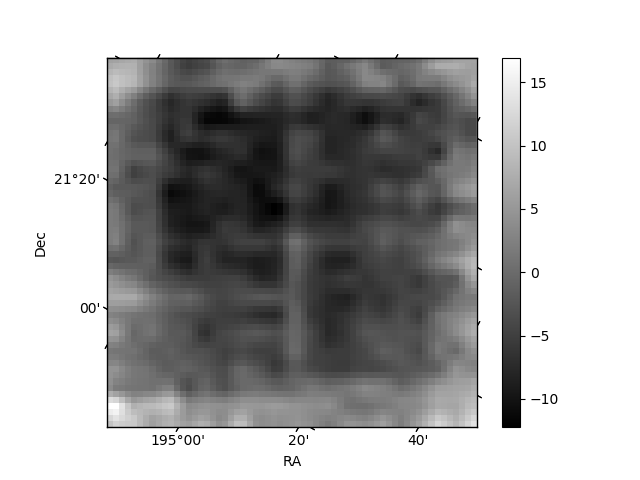
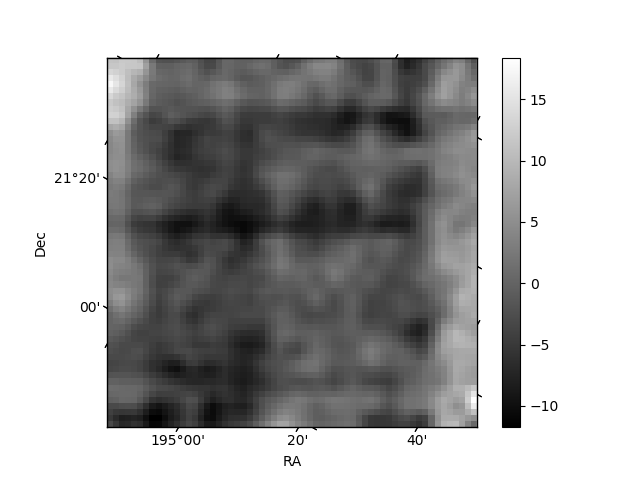
Histogram calculated using DETX and DETY for each event in the final _common_clean file
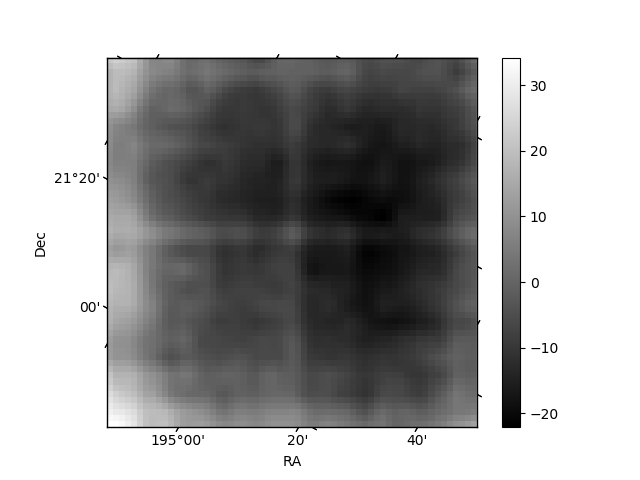
| Quadrant A | 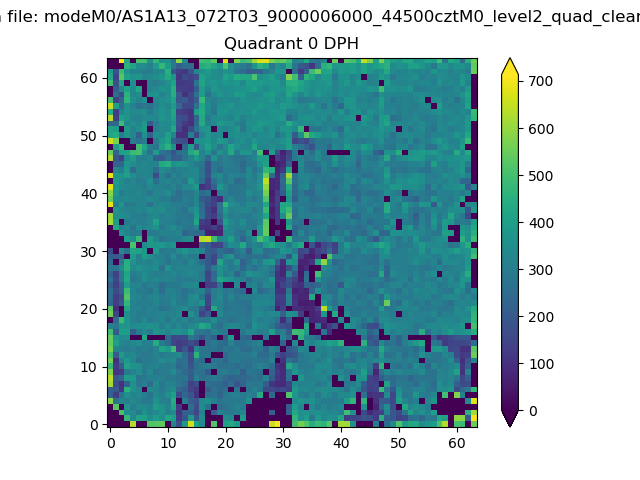 |
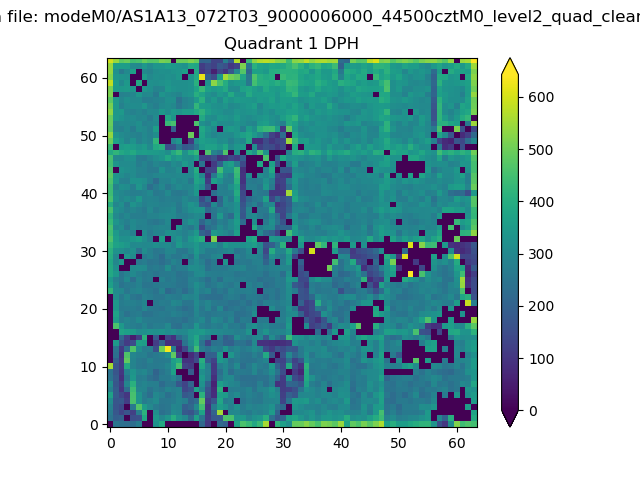 |
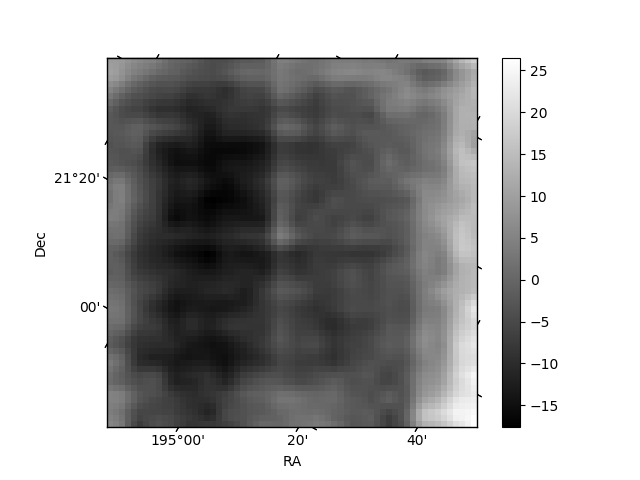
Quadrant B |
|---|---|---|---|
| Quadrant D | 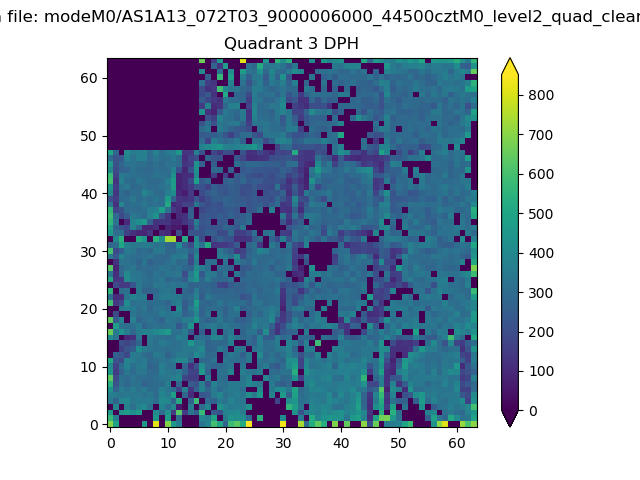 |
 |
Quadrant C |
| Plot type | Count rate plots | Images |
|---|---|---|
| Comparison with Poisson distribution Blue bars denote a histogram of data divided into 1 sec bins. Red curve is a Poisson curve with rate = median count rate of data. |
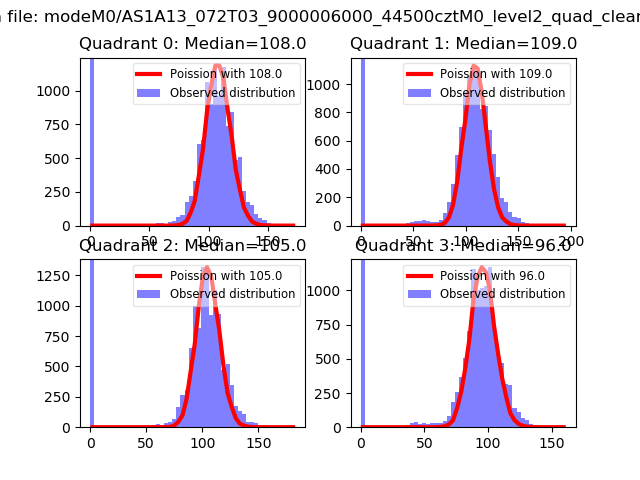 |
 |
| Quadrant-wise count rates Data is divided into 100 sec bins |
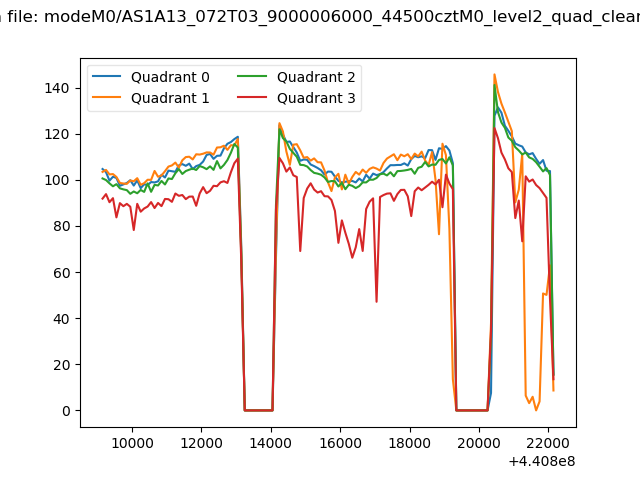 |
|
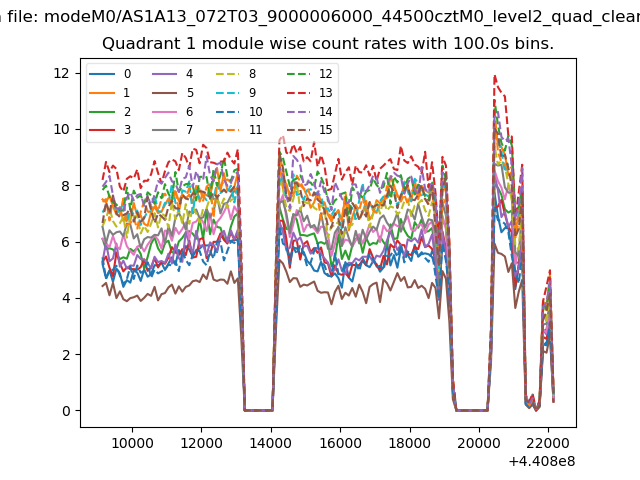
| Module-wise count rates for Quadrant A Data is divided into 100 sec bins |
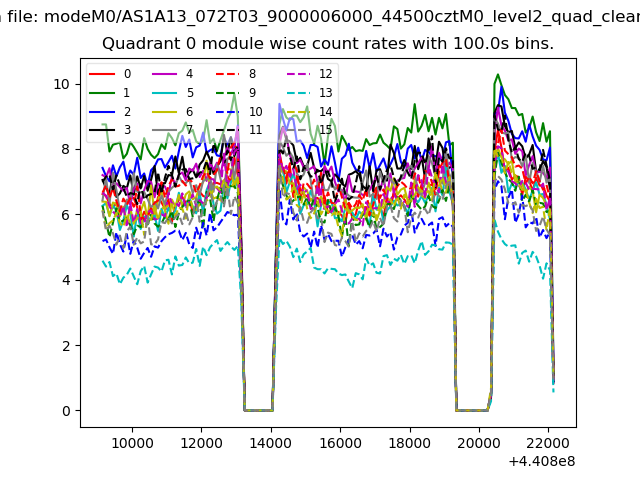 |
 |
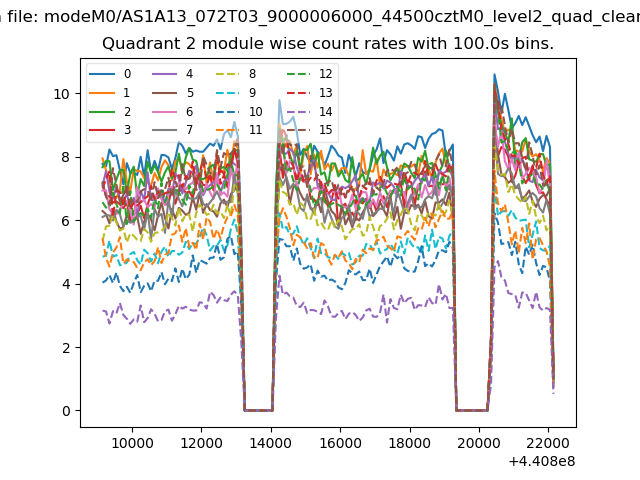
| Module-wise count rates for Quadrant B Data is divided into 100 sec bins |
 |
 |
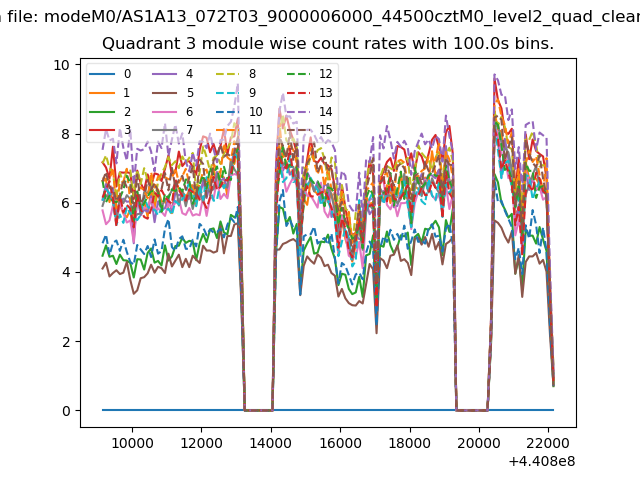
| Module-wise count rates for Quadrant C Data is divided into 100 sec bins |
 |
 |
| Module-wise count rates for Quadrant D Data is divided into 100 sec bins |
 |
 |
| Parameter | Plot |
|---|---|
| CZT HV Monitor | 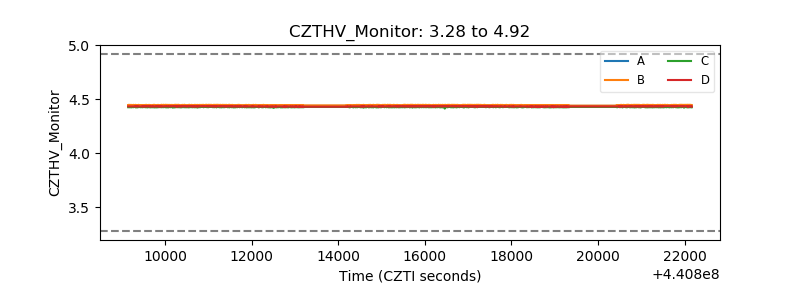 |
| D_VDD | 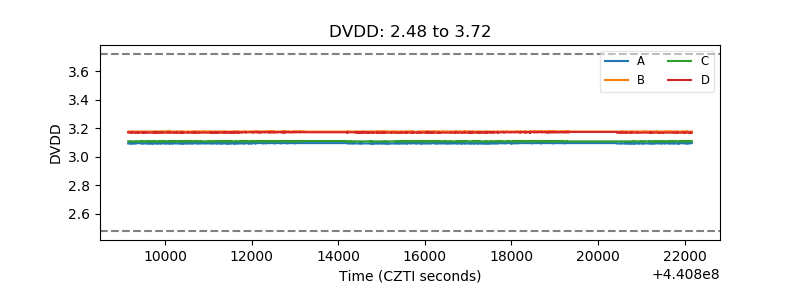 |
| Temperature 1 | 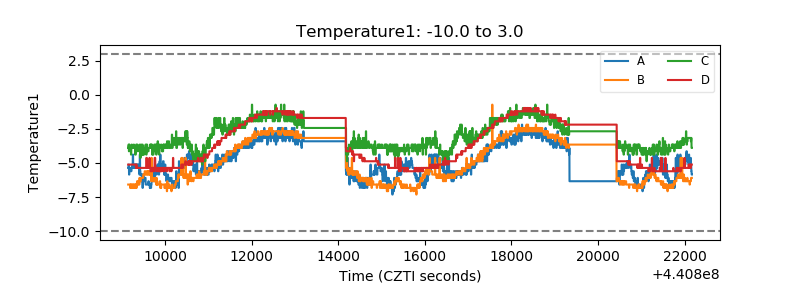 |
| Veto HV Monitor | 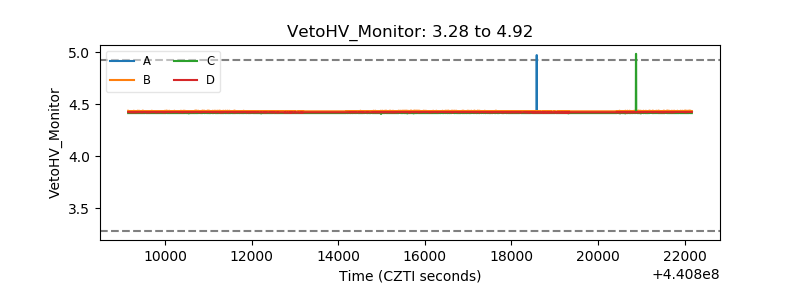 |
| Veto LLD | 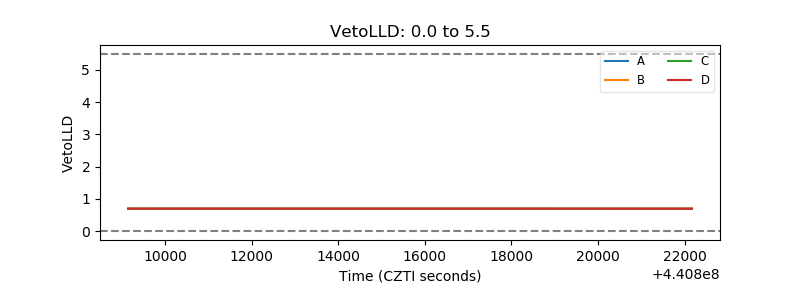 |
| Alpha Counter | 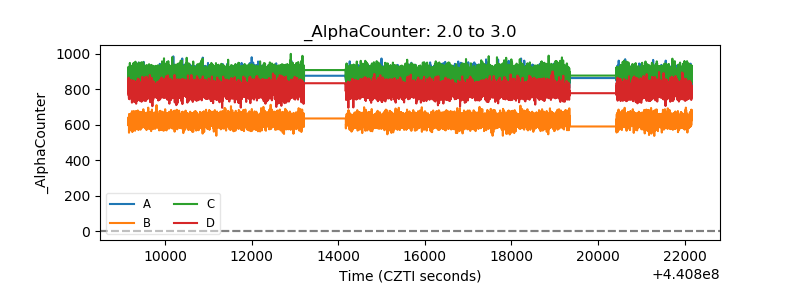 |
| _CPM_Rate | 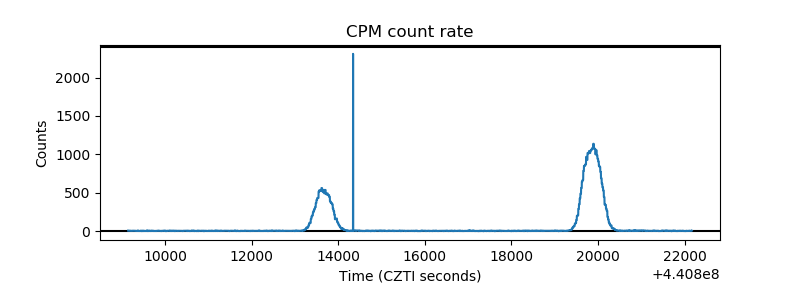 |
| CZT Counter | 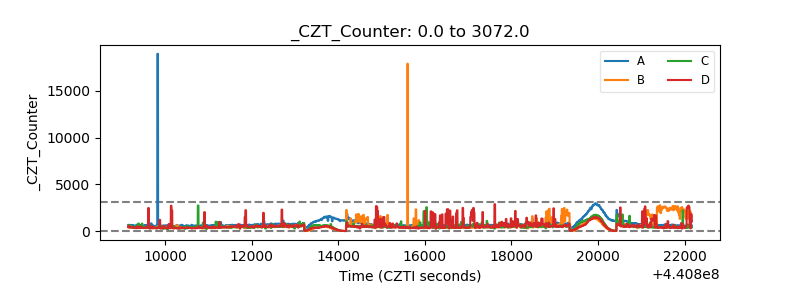 |
| +2.5 Volts monitor | 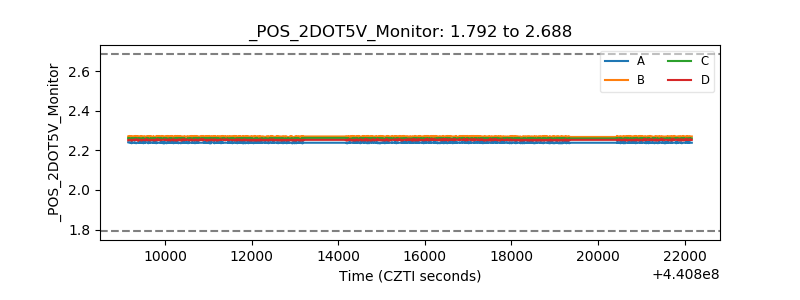 |
| +5 Volts monitor | 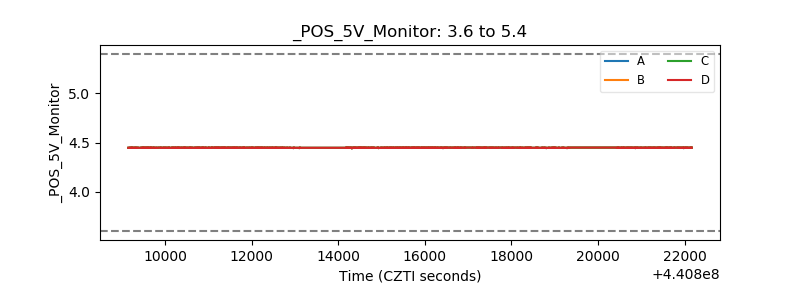 |
| _ROLL_ROT | 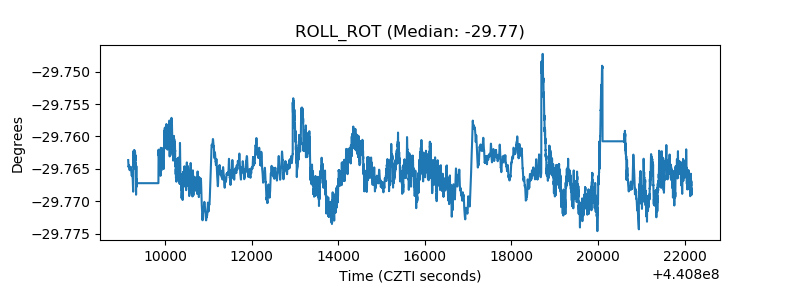 |
| _Roll_DEC | 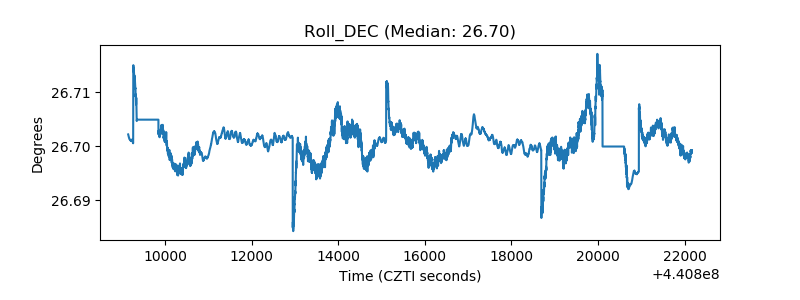 |
| _Roll_RA | 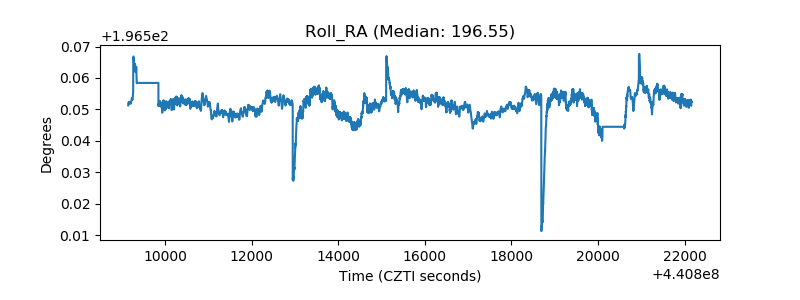 |
| Veto Counter | 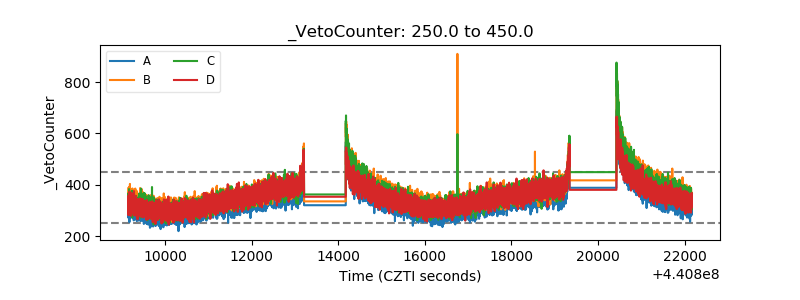 |