| Param | Original file | Final file |
|---|---|---|
| Filename | modeM0/AS1A13_072T03_9000006000_44501cztM0_level2.fits | modeM0/AS1A13_072T03_9000006000_44501cztM0_level2_quad_clean.evt |
| Size (bytes) | 669,490,560 | 97,228,800 |
| Size | 638.5 MB | 92.7 MB |
| Events in quadrant A | 4,588,481 | 742,668 |
| Events in quadrant B | 10,787,403 | 428,118 |
| Events in quadrant C | 3,309,976 | 729,799 |
| Events in quadrant D | 5,590,350 | 588,478 |
| Mode SS | |||
|---|---|---|---|
| Quadrant | BADHDUFLAG | Total packets | Discarded packets |
| A | 0 | 132 | 0 |
| B | 0 | 132 | 0 |
| C | 0 | 132 | 0 |
| D | 0 | 132 | 0 |
| Mode M9 | |||
|---|---|---|---|
| Quadrant | BADHDUFLAG | Total packets | Discarded packets |
| A | 0 | 12 | 0 |
| B | 0 | 12 | 0 |
| C | 0 | 12 | 0 |
| D | 0 | 12 | 0 |
| Mode M0 | |||
|---|---|---|---|
| Quadrant | BADHDUFLAG | Total packets | Discarded packets |
| A | 0 | 18894 | 1 |
| B | 0 | 36454 | 7 |
| C | 0 | 14354 | 1 |
| D | 0 | 21076 | 1 |
| Quadrant | Total seconds | Saturated seconds | Saturation percentage |
|---|---|---|---|
| A | 6524 | 66 | 1.011649% |
| B | 6524 | 3164 | 48.497854% |
| C | 6524 | 42 | 0.643777% |
| D | 6524 | 793 | 12.155120% |
Noise dominated data is calculated using 1-second bins in cleaned event files. If a bin has >2000 counts, and if more than 50% of those come from <1% of pixels, then it is considered to be noise-dominated and hence unusable.
| Quadrant | # 1 sec bins | Bins with >0 counts | Bins with >2000 counts | High rate bins dominated by noise | Noise dominated (total time) | Noise dominated (detector-on time) | Marked lightcurve |
|---|---|---|---|---|---|---|---|
| A | 7704 | 6525 | 7 | 7 | 0.09% | 0.11% | 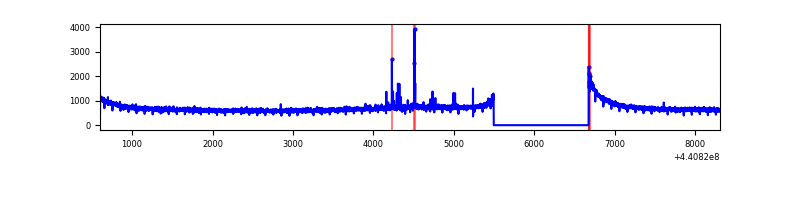 |
| B | 7704 | 6524 | 2646 | 2646 | 34.35% | 40.56% | 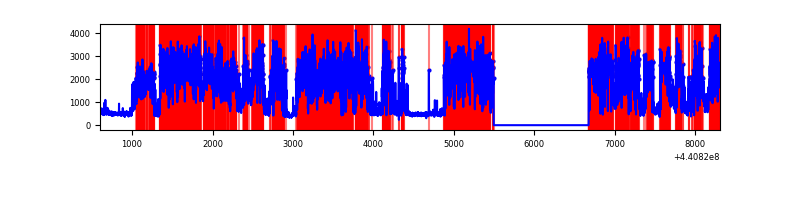 |
| C | 7704 | 6525 | 28 | 28 | 0.36% | 0.43% | 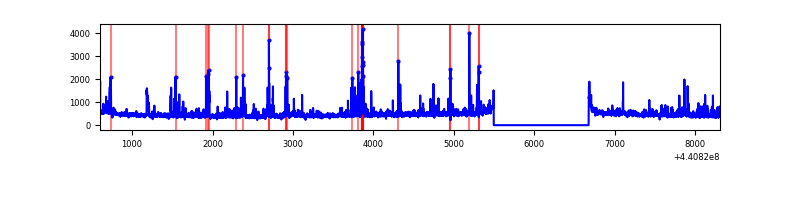 |
| D | 7704 | 6525 | 750 | 750 | 9.74% | 11.49% | 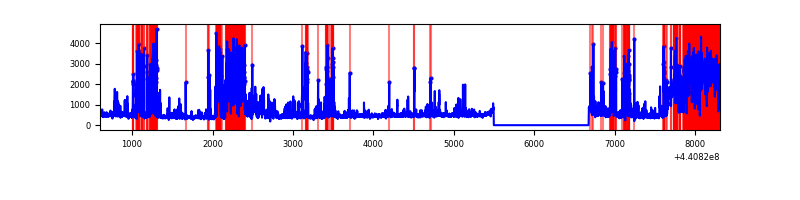 |
Top three noisy pixels from each quadrant. If the there are fewer than three noisy pixels in the level2.evt file, extra rows are filled as -1
| Pixel properties | Quadrant properties | ||||||
|---|---|---|---|---|---|---|---|
| Quadrant | DetID | PixID | Counts | Sigma | Mean | Median | Sigma |
| A | 10 | 83 | 1707398 | 11221.02 | 732 | 718 | 152.1 |
| A | 13 | 248 | 45786 | 296.31 | 732 | 718 | 152.1 |
| A | 7 | 191 | 12070 | 74.64 | 732 | 718 | 152.1 |
| B | 5 | 235 | 8286087 | 72820.82 | 584 | 567 | 113.8 |
| B | 5 | 172 | 83438 | 728.35 | 584 | 567 | 113.8 |
| B | 5 | 255 | 63164 | 550.16 | 584 | 567 | 113.8 |
| C | 14 | 254 | 245934 | 1466.23 | 714 | 717 | 167.2 |
| C | 3 | 233 | 211843 | 1262.39 | 714 | 717 | 167.2 |
| C | 15 | 1 | 34157 | 199.95 | 714 | 717 | 167.2 |
| D | 2 | 249 | 1961584 | 11671.9 | 675 | 656 | 168.0 |
| D | 13 | 187 | 733849 | 4364.14 | 675 | 656 | 168.0 |
| D | 1 | 52 | 166010 | 984.23 | 675 | 656 | 168.0 |
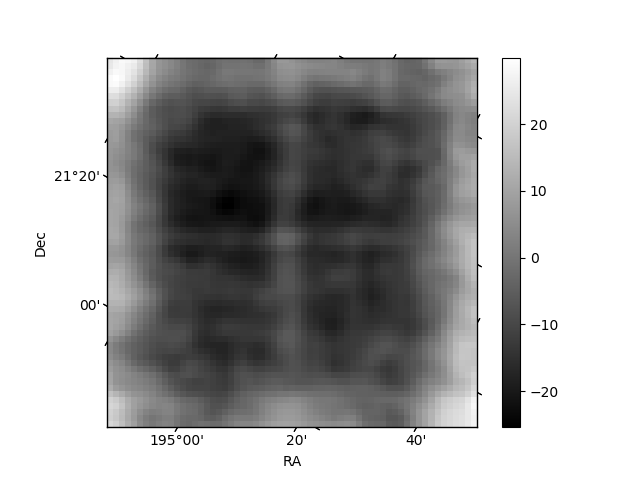
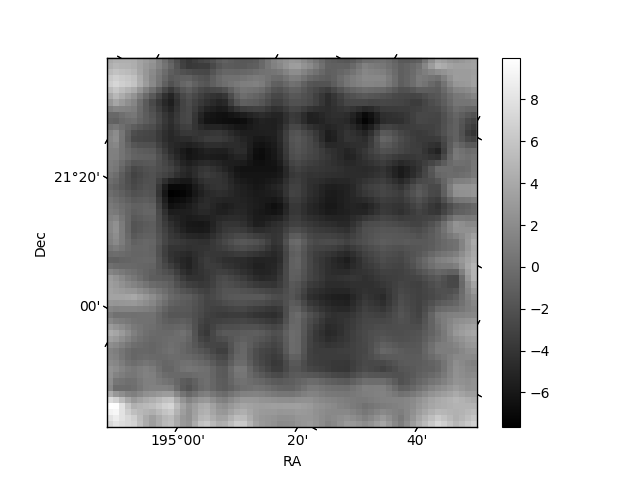
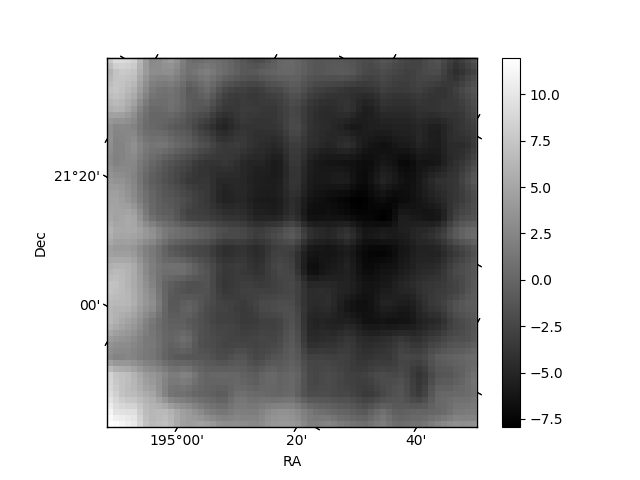
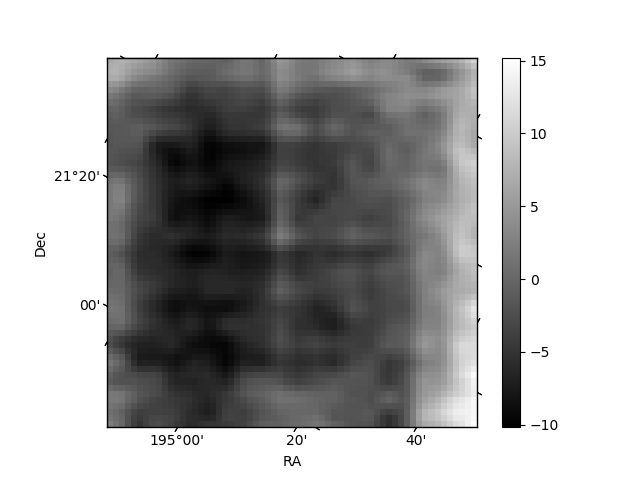
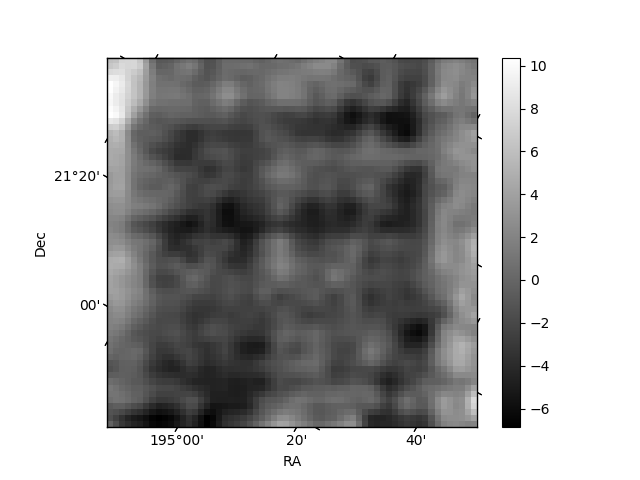
Histogram calculated using DETX and DETY for each event in the final _common_clean file
| Quadrant A | 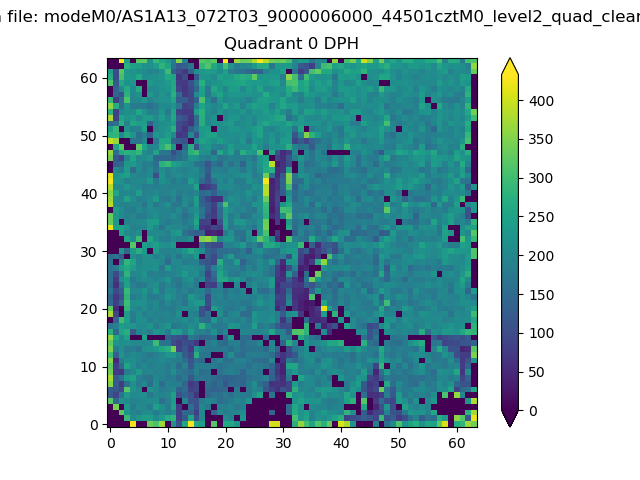 |
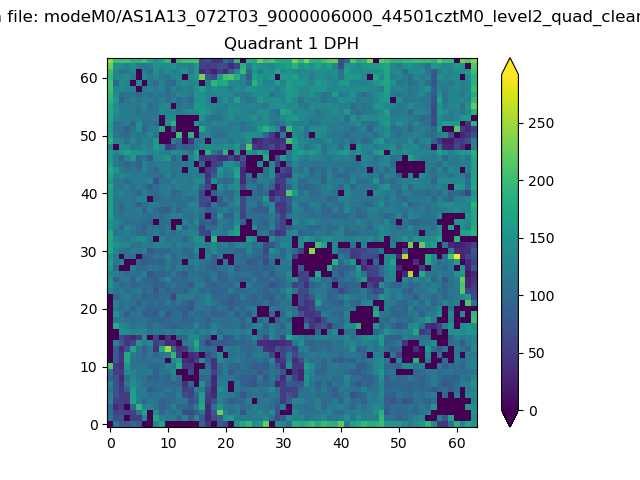 |
Quadrant B |
|---|---|---|---|
| Quadrant D | 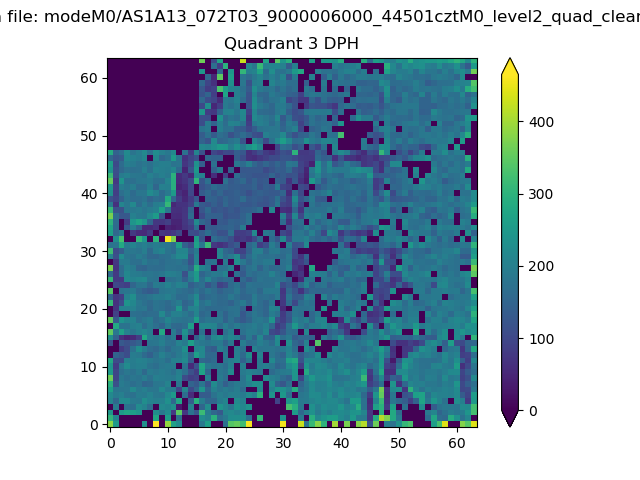 |
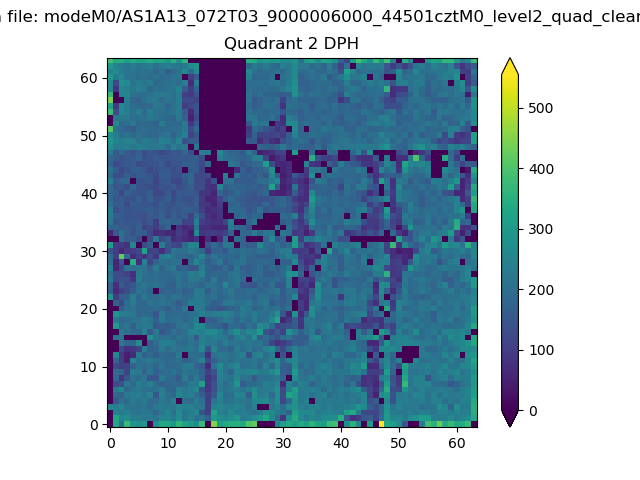 |
Quadrant C |
| Plot type | Count rate plots | Images |
|---|---|---|
| Comparison with Poisson distribution Blue bars denote a histogram of data divided into 1 sec bins. Red curve is a Poisson curve with rate = median count rate of data. |
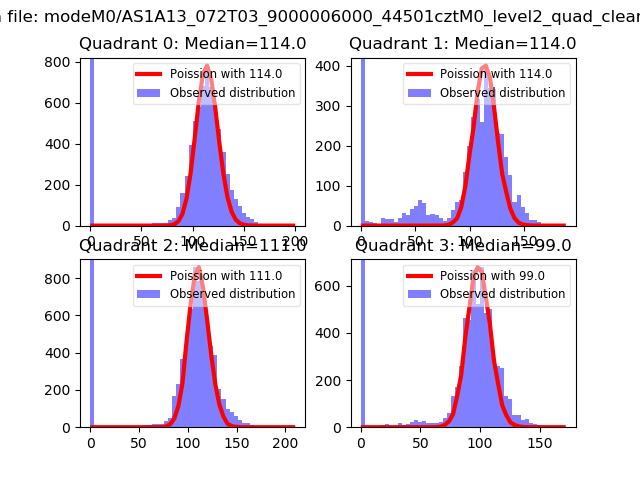 |
 |
| Quadrant-wise count rates Data is divided into 100 sec bins |
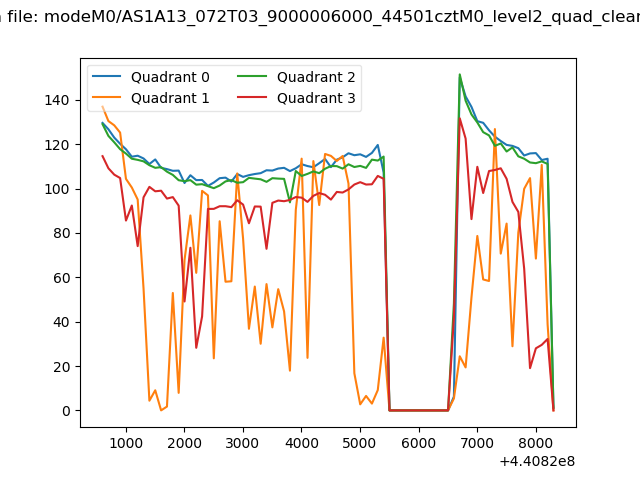 |
|
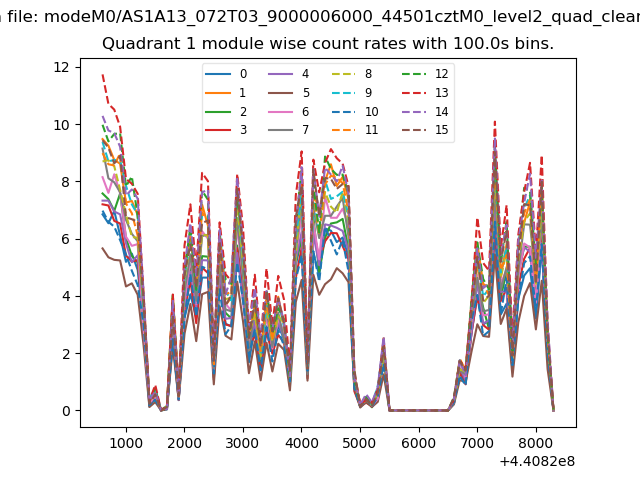
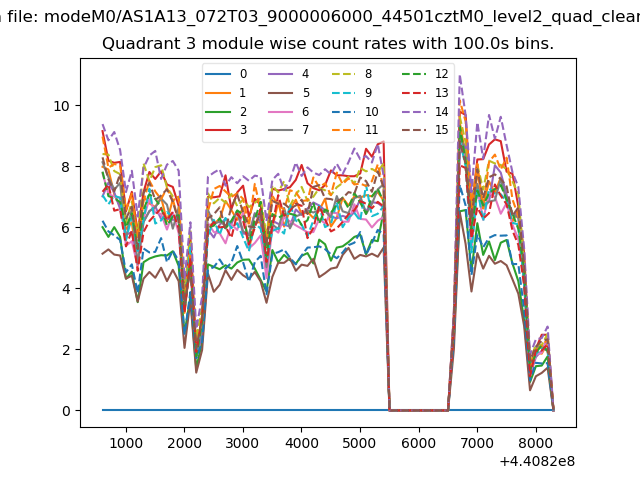
| Module-wise count rates for Quadrant A Data is divided into 100 sec bins |
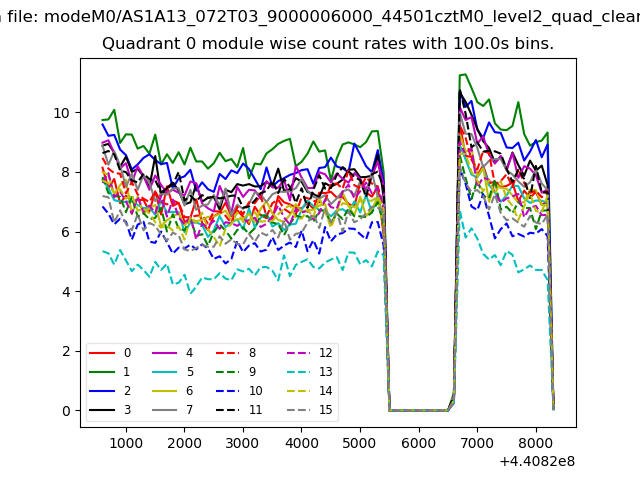 |
 |
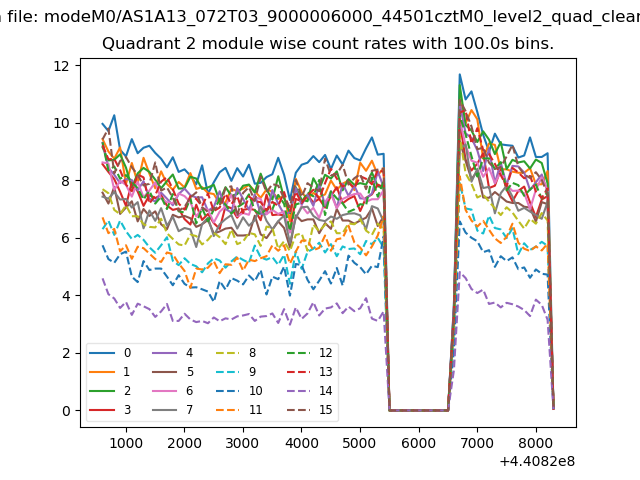
| Module-wise count rates for Quadrant B Data is divided into 100 sec bins |
 |
 |
| Module-wise count rates for Quadrant C Data is divided into 100 sec bins |
 |
 |
| Module-wise count rates for Quadrant D Data is divided into 100 sec bins |
 |
 |
| Parameter | Plot |
|---|---|
| CZT HV Monitor | 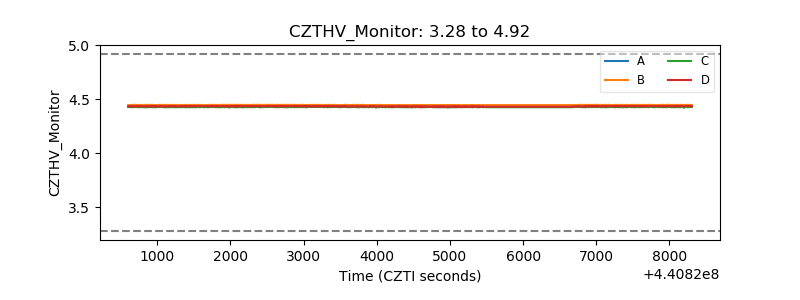 |
| D_VDD | 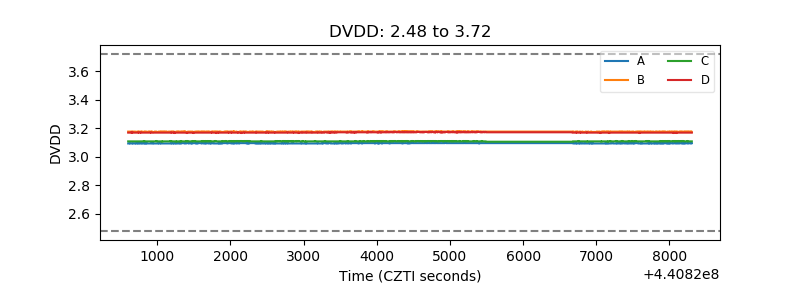 |
| Temperature 1 | 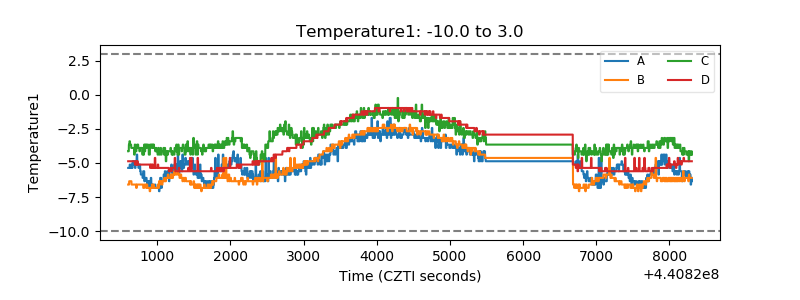 |
| Veto HV Monitor | 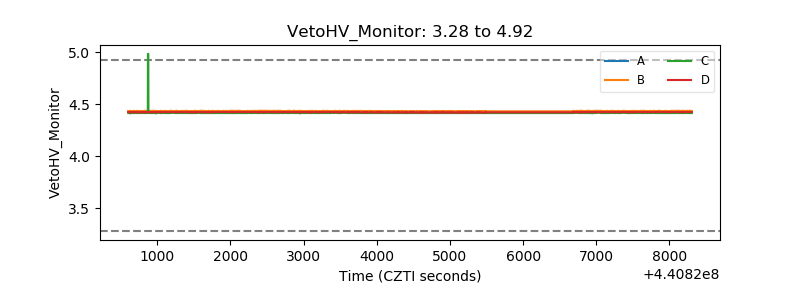 |
| Veto LLD | 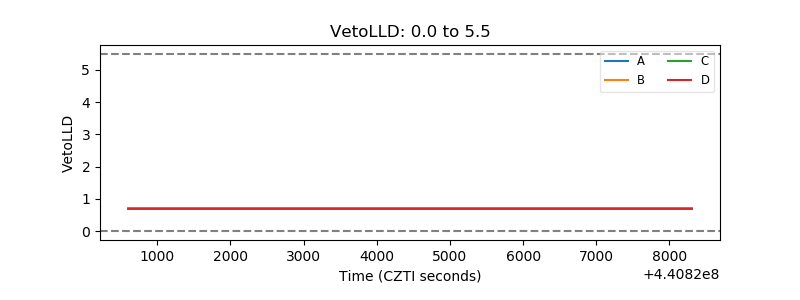 |
| Alpha Counter | 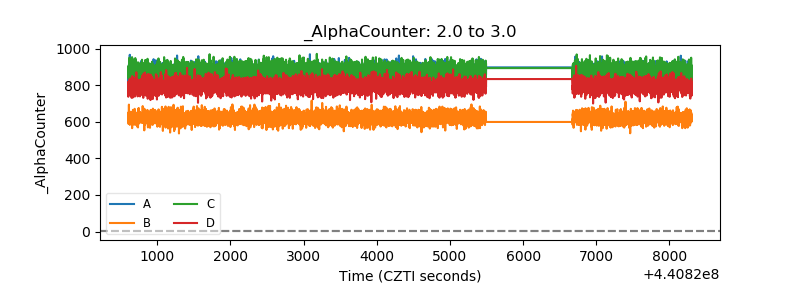 |
| _CPM_Rate | 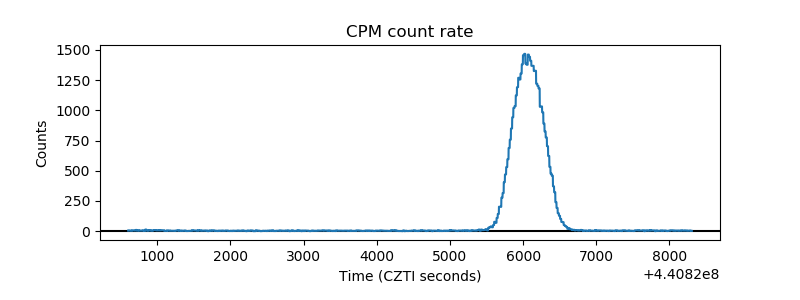 |
| CZT Counter |  |
| +2.5 Volts monitor | 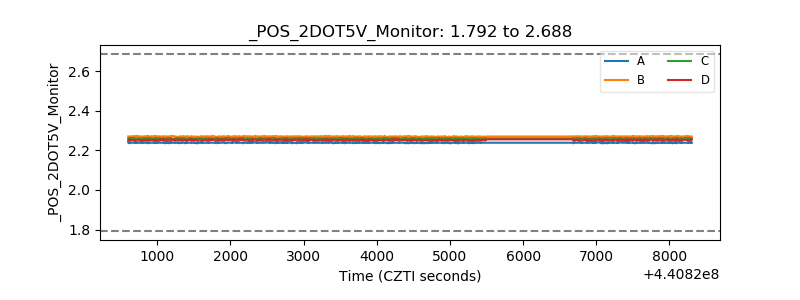 |
| +5 Volts monitor | 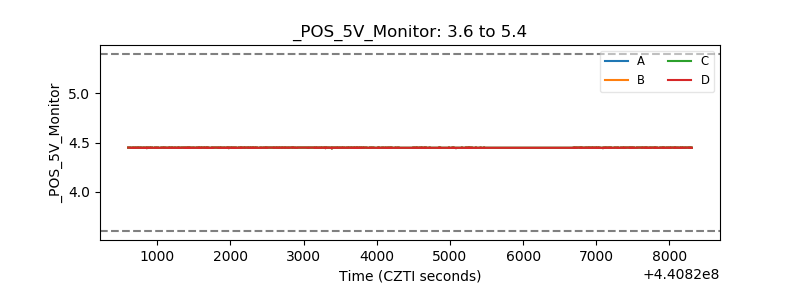 |
| _ROLL_ROT | 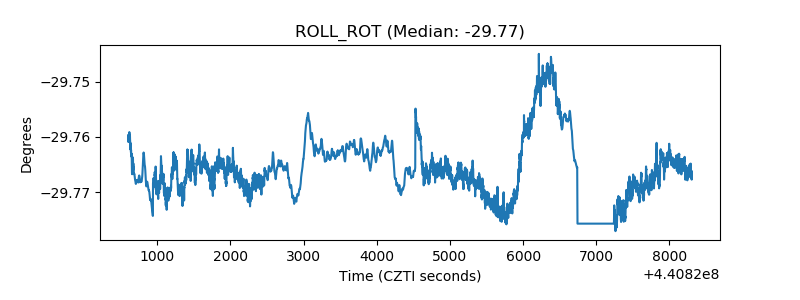 |
| _Roll_DEC | 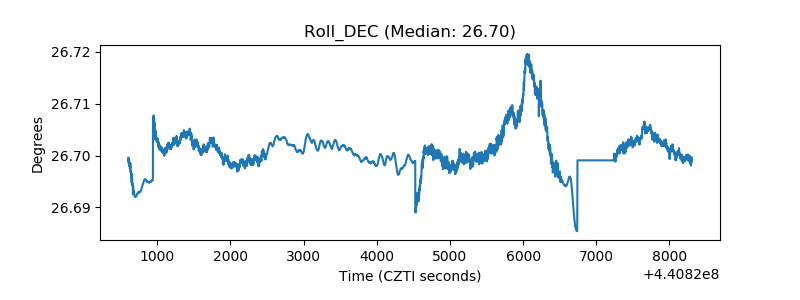 |
| _Roll_RA | 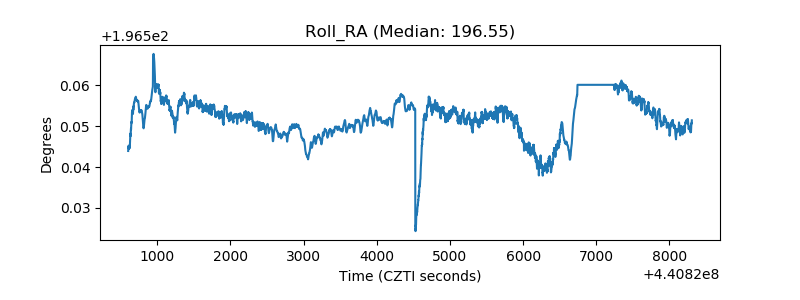 |
| Veto Counter | 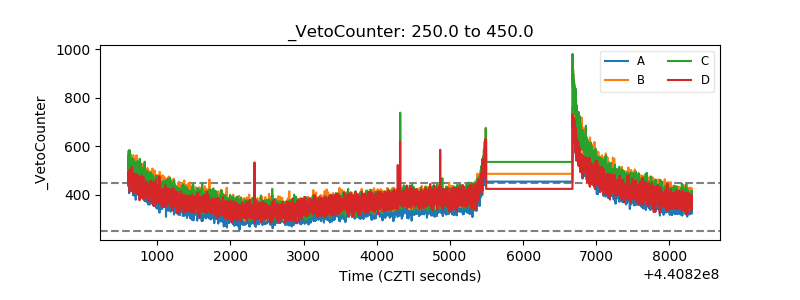 |