| Param | Original file | Final file |
|---|---|---|
| Filename | modeM0/AS1A13_003T01_9000006002_44536cztM0_level2.fits | modeM0/AS1A13_003T01_9000006002_44536cztM0_level2_quad_clean.evt |
| Size (bytes) | 483,480,000 | 116,383,680 |
| Size | 461.1 MB | 111.0 MB |
| Events in quadrant A | 5,428,330 | 776,420 |
| Events in quadrant B | 3,648,463 | 796,386 |
| Events in quadrant C | 3,830,675 | 758,490 |
| Events in quadrant D | 4,434,402 | 694,892 |
| Mode SS | |||
|---|---|---|---|
| Quadrant | BADHDUFLAG | Total packets | Discarded packets |
| A | 0 | 142 | 0 |
| B | 0 | 142 | 0 |
| C | 0 | 142 | 0 |
| D | 0 | 142 | 0 |
| Mode M0 | |||
|---|---|---|---|
| Quadrant | BADHDUFLAG | Total packets | Discarded packets |
| A | 0 | 22424 | 0 |
| B | 0 | 15807 | 0 |
| C | 0 | 16171 | 0 |
| D | 0 | 18160 | 1 |
| Quadrant | Total seconds | Saturated seconds | Saturation percentage |
|---|---|---|---|
| A | 7150 | 147 | 2.055944% |
| B | 7151 | 79 | 1.104741% |
| C | 7151 | 72 | 1.006852% |
| D | 7150 | 162 | 2.265734% |
Noise dominated data is calculated using 1-second bins in cleaned event files. If a bin has >2000 counts, and if more than 50% of those come from <1% of pixels, then it is considered to be noise-dominated and hence unusable.
| Quadrant | # 1 sec bins | Bins with >0 counts | Bins with >2000 counts | High rate bins dominated by noise | Noise dominated (total time) | Noise dominated (detector-on time) | Marked lightcurve |
|---|---|---|---|---|---|---|---|
| A | 7150 | 7150 | 68 | 68 | 0.95% | 0.95% | 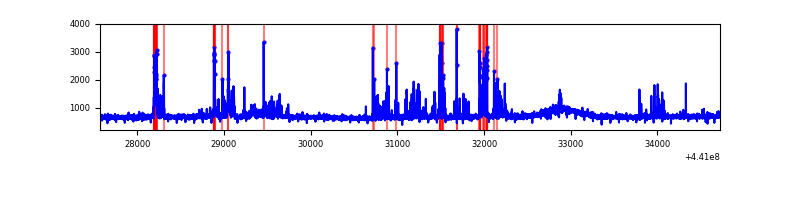 |
| B | 7151 | 7151 | 26 | 26 | 0.36% | 0.36% | 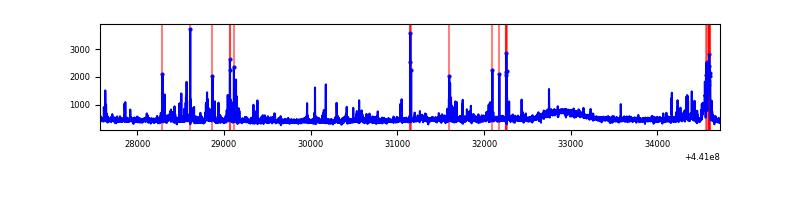 |
| C | 7151 | 7151 | 56 | 56 | 0.78% | 0.78% | 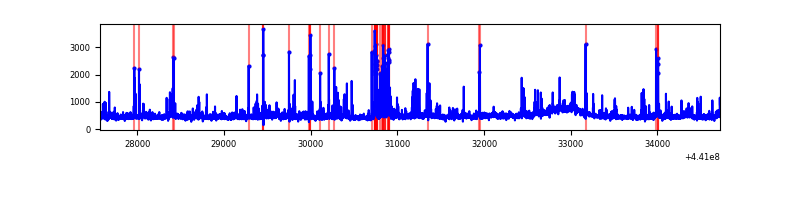 |
| D | 7150 | 7150 | 147 | 147 | 2.06% | 2.06% | 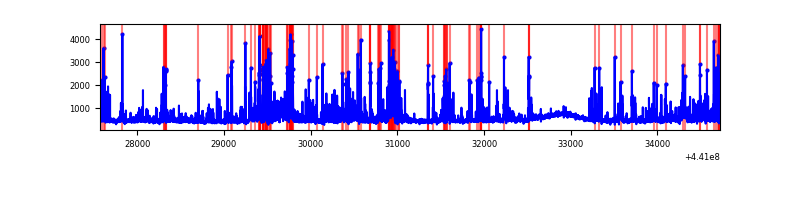 |
Top three noisy pixels from each quadrant. If the there are fewer than three noisy pixels in the level2.evt file, extra rows are filled as -1
| Pixel properties | Quadrant properties | ||||||
|---|---|---|---|---|---|---|---|
| Quadrant | DetID | PixID | Counts | Sigma | Mean | Median | Sigma |
| A | 10 | 83 | 1726726 | 10119.09 | 814 | 795 | 170.6 |
| A | 13 | 248 | 358174 | 2095.3 | 814 | 795 | 170.6 |
| A | 10 | 248 | 171347 | 999.94 | 814 | 795 | 170.6 |
| B | 5 | 235 | 237215 | 1465.87 | 808 | 782 | 161.3 |
| B | 0 | 155 | 44989 | 274.08 | 808 | 782 | 161.3 |
| B | 0 | 168 | 32859 | 198.88 | 808 | 782 | 161.3 |
| C | 14 | 254 | 441183 | 2342.1 | 792 | 796 | 188.0 |
| C | 3 | 233 | 216056 | 1144.81 | 792 | 796 | 188.0 |
| C | 2 | 14 | 38011 | 197.92 | 792 | 796 | 188.0 |
| D | 2 | 249 | 718051 | 3558.31 | 796 | 770 | 201.6 |
| D | 1 | 52 | 320678 | 1587.01 | 796 | 770 | 201.6 |
| D | 13 | 249 | 94900 | 466.96 | 796 | 770 | 201.6 |
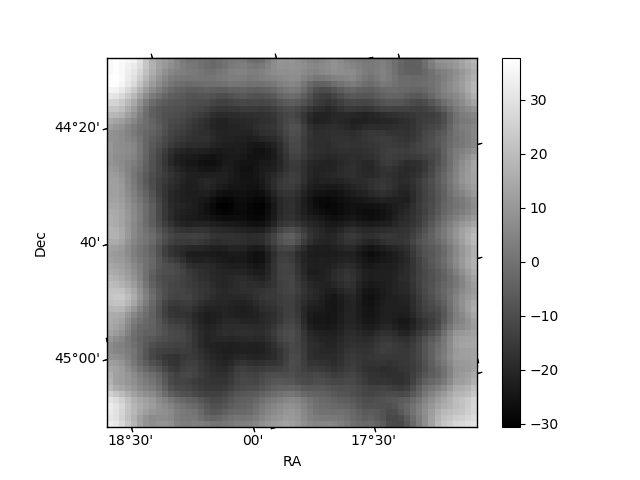
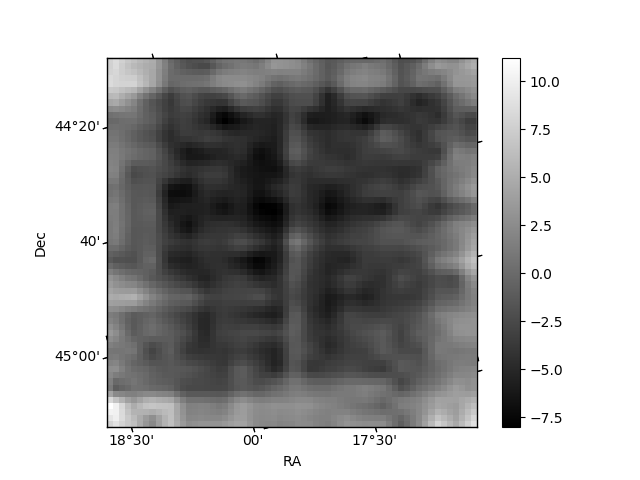
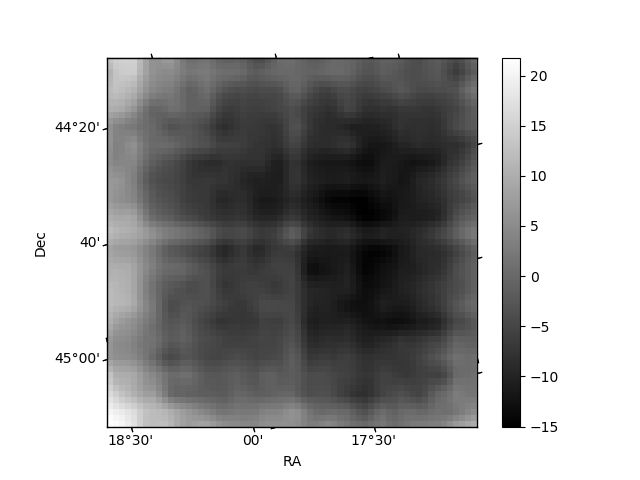
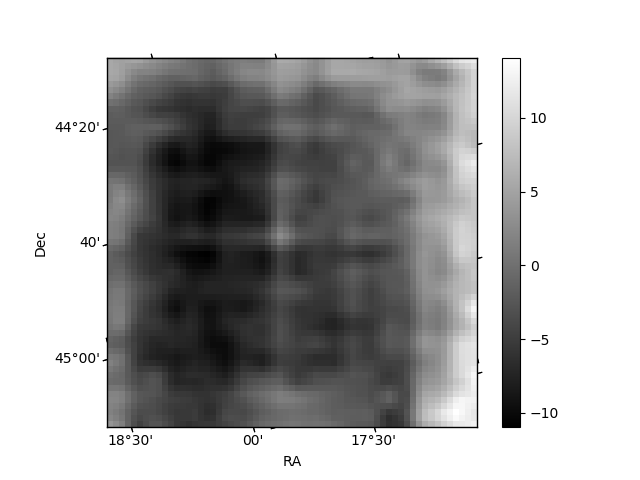
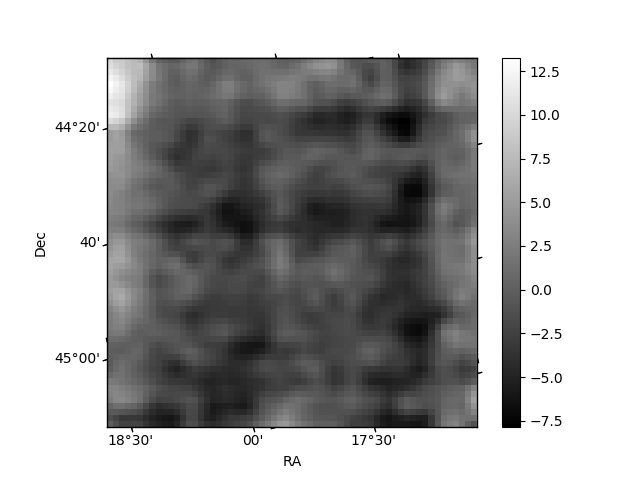
Histogram calculated using DETX and DETY for each event in the final _common_clean file
| Quadrant A | 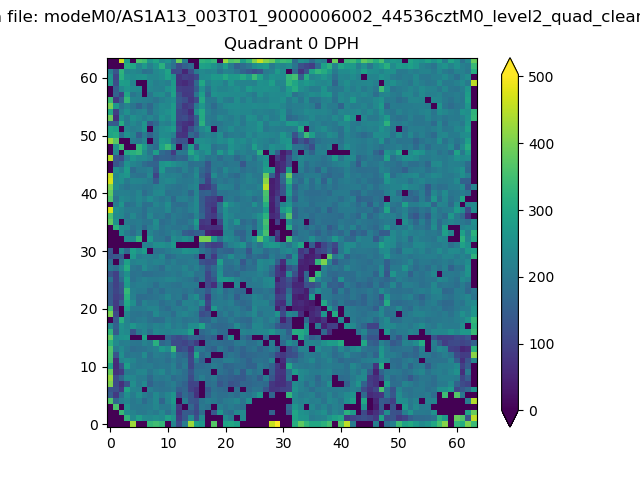 |
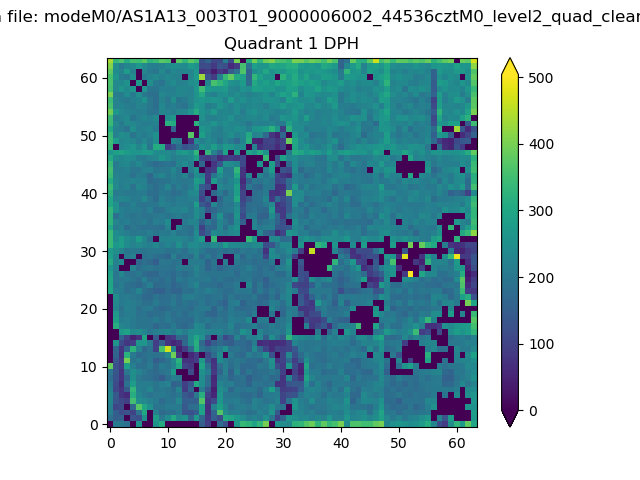 |
Quadrant B |
|---|---|---|---|
| Quadrant D | 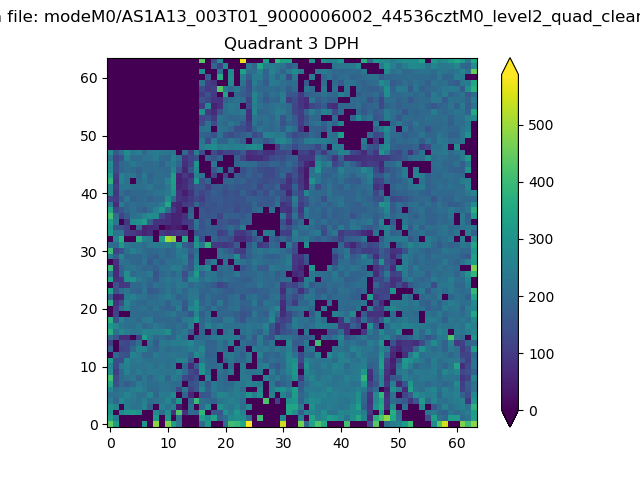 |
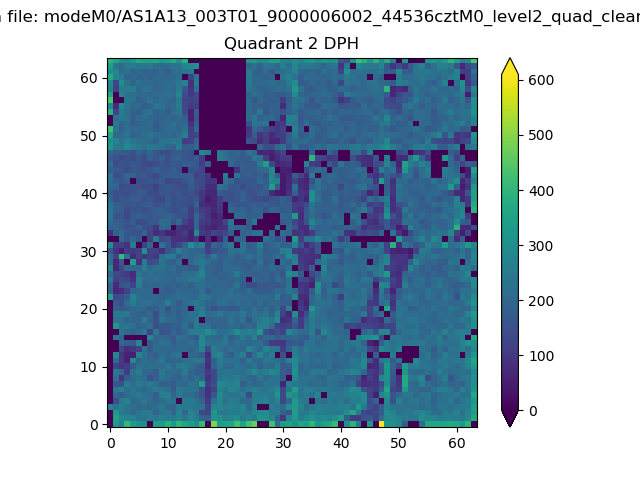 |
Quadrant C |
| Plot type | Count rate plots | Images |
|---|---|---|
| Comparison with Poisson distribution Blue bars denote a histogram of data divided into 1 sec bins. Red curve is a Poisson curve with rate = median count rate of data. |
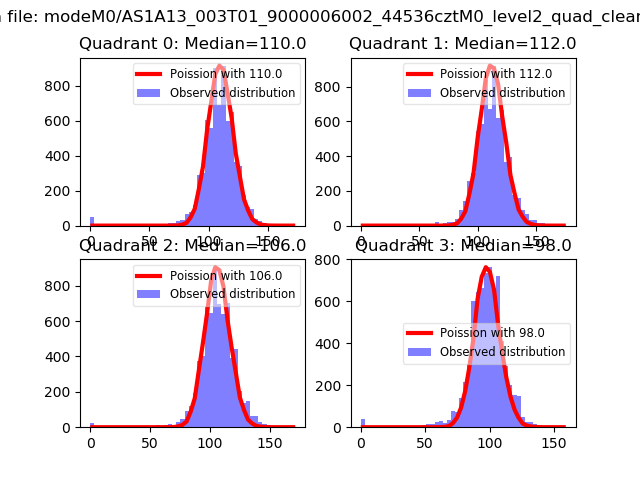 |
 |
| Quadrant-wise count rates Data is divided into 100 sec bins |
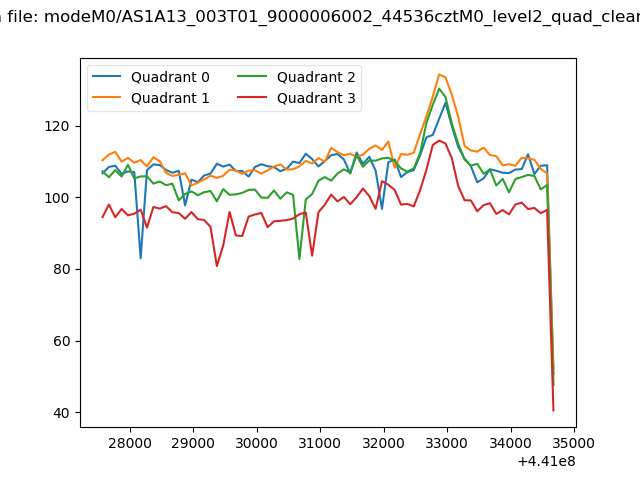 |
|
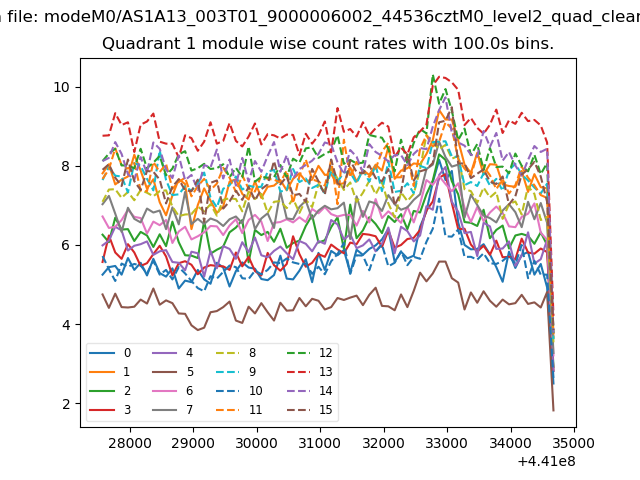
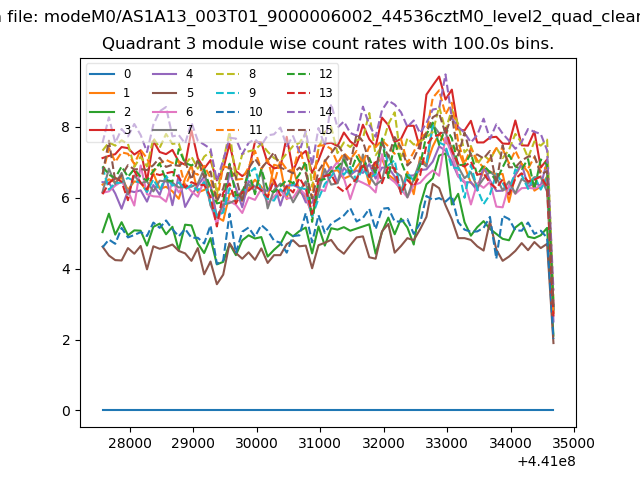
| Module-wise count rates for Quadrant A Data is divided into 100 sec bins |
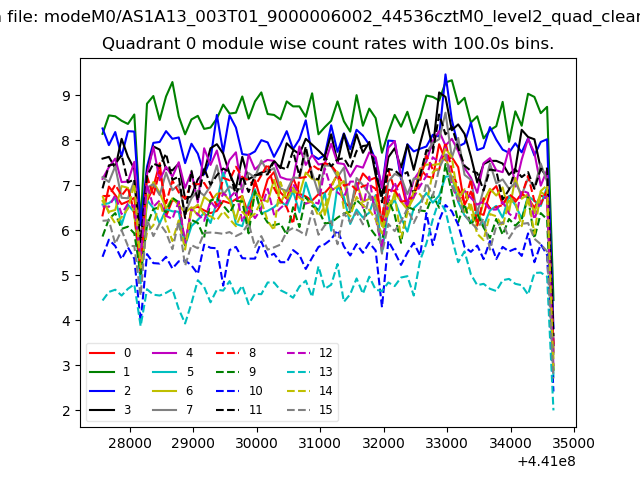 |
 |
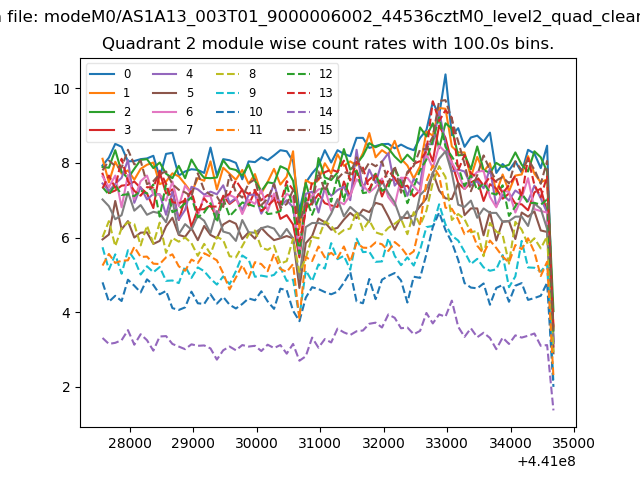
| Module-wise count rates for Quadrant B Data is divided into 100 sec bins |
 |
 |
| Module-wise count rates for Quadrant C Data is divided into 100 sec bins |
 |
 |
| Module-wise count rates for Quadrant D Data is divided into 100 sec bins |
 |
 |
| Parameter | Plot |
|---|---|
| CZT HV Monitor | 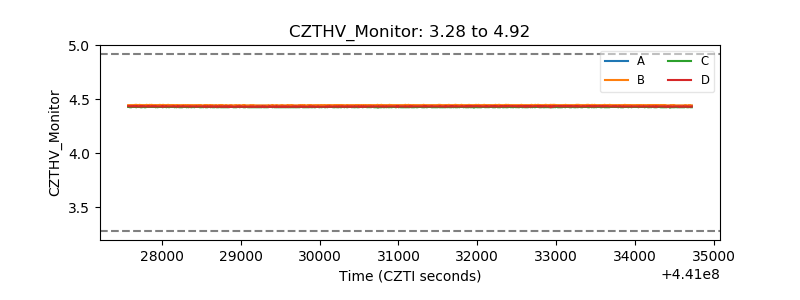 |
| D_VDD | 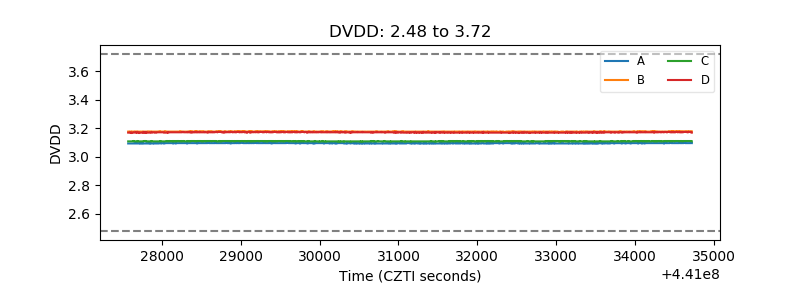 |
| Temperature 1 | 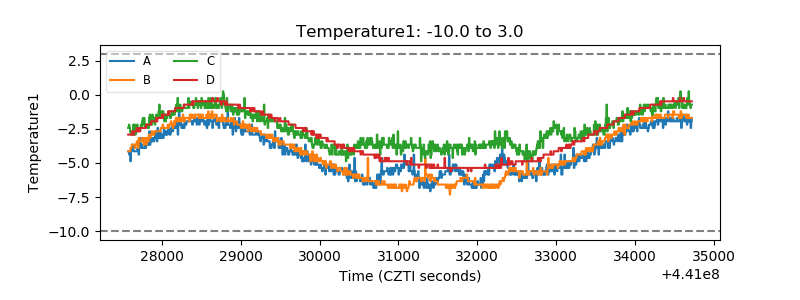 |
| Veto HV Monitor | 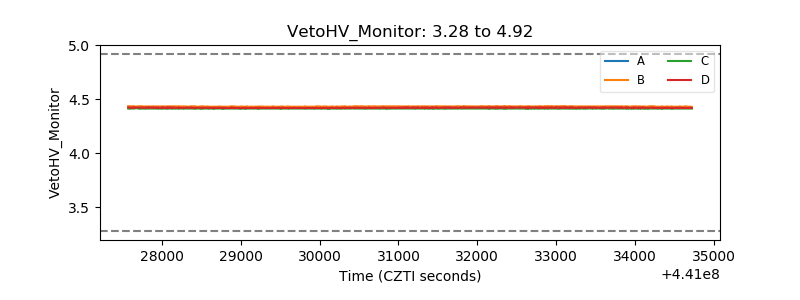 |
| Veto LLD | 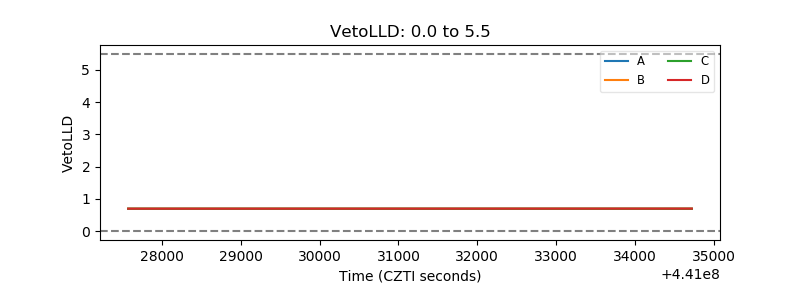 |
| Alpha Counter | 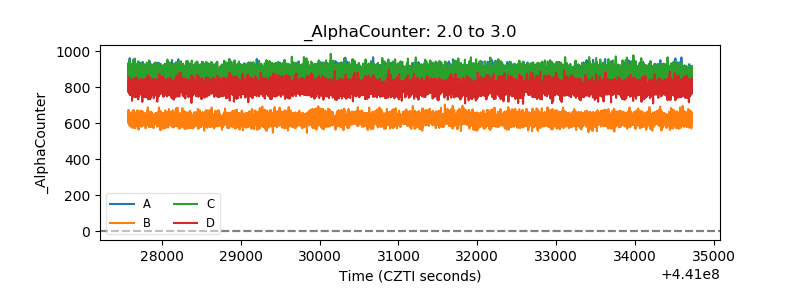 |
| _CPM_Rate | 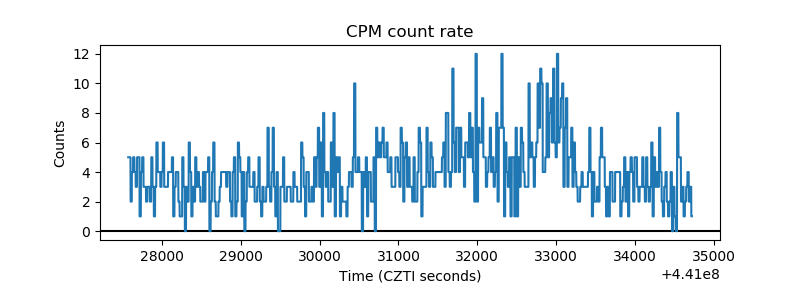 |
| CZT Counter | 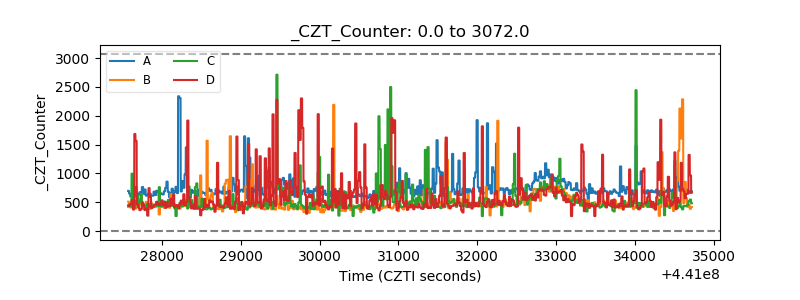 |
| +2.5 Volts monitor | 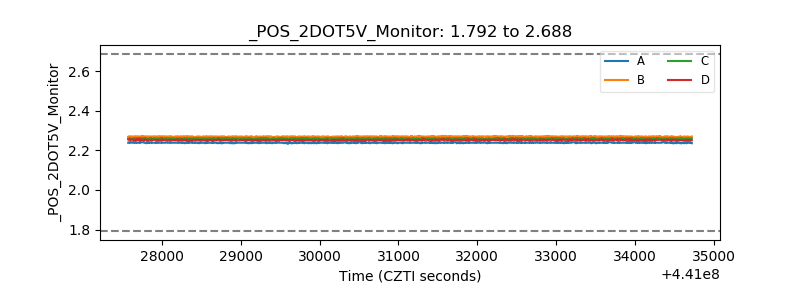 |
| +5 Volts monitor | 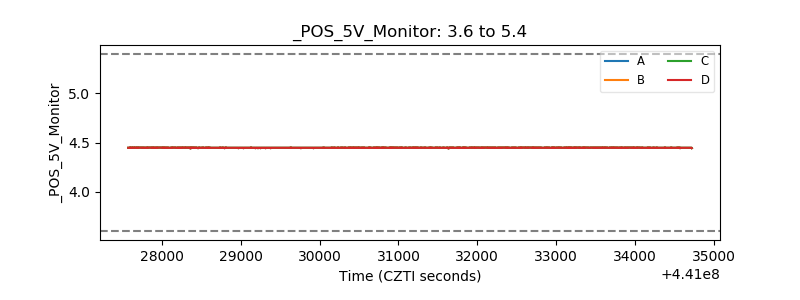 |
| _ROLL_ROT | 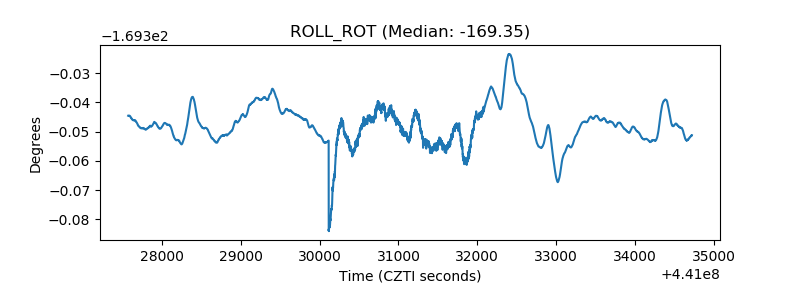 |
| _Roll_DEC | 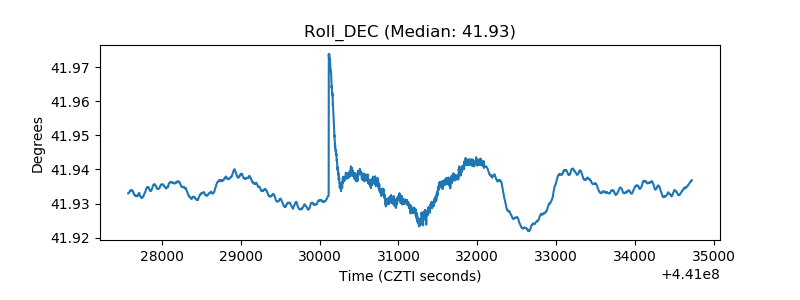 |
| _Roll_RA | 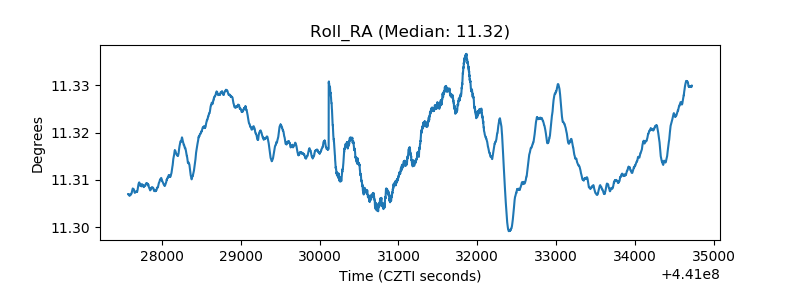 |
| Veto Counter | 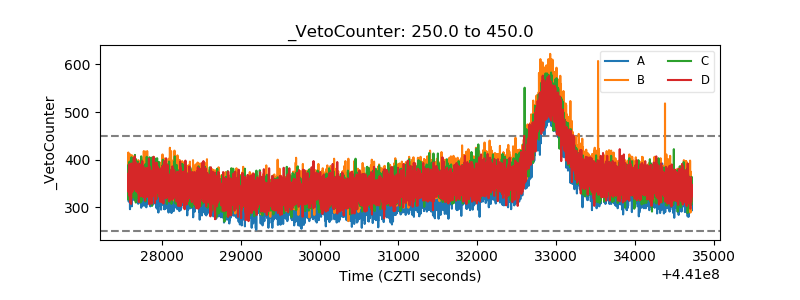 |