| Param | Original file | Final file |
|---|---|---|
| Filename | modeM0/AS1A13_003T01_9000006002_44537cztM0_level2.fits | modeM0/AS1A13_003T01_9000006002_44537cztM0_level2_quad_clean.evt |
| Size (bytes) | 503,665,920 | 111,997,440 |
| Size | 480.3 MB | 106.8 MB |
| Events in quadrant A | 5,028,299 | 760,262 |
| Events in quadrant B | 3,882,132 | 768,480 |
| Events in quadrant C | 3,840,941 | 737,141 |
| Events in quadrant D | 5,349,673 | 637,457 |
| Mode SS | |||
|---|---|---|---|
| Quadrant | BADHDUFLAG | Total packets | Discarded packets |
| A | 0 | 140 | 0 |
| B | 0 | 140 | 0 |
| C | 0 | 140 | 0 |
| D | 0 | 140 | 0 |
| Mode M0 | |||
|---|---|---|---|
| Quadrant | BADHDUFLAG | Total packets | Discarded packets |
| A | 0 | 21142 | 0 |
| B | 0 | 16309 | 0 |
| C | 0 | 16198 | 0 |
| D | 0 | 20790 | 2 |
| Quadrant | Total seconds | Saturated seconds | Saturation percentage |
|---|---|---|---|
| A | 6999 | 51 | 0.728676% |
| B | 6999 | 103 | 1.471639% |
| C | 6999 | 79 | 1.128733% |
| D | 6999 | 555 | 7.929704% |
Noise dominated data is calculated using 1-second bins in cleaned event files. If a bin has >2000 counts, and if more than 50% of those come from <1% of pixels, then it is considered to be noise-dominated and hence unusable.
| Quadrant | # 1 sec bins | Bins with >0 counts | Bins with >2000 counts | High rate bins dominated by noise | Noise dominated (total time) | Noise dominated (detector-on time) | Marked lightcurve |
|---|---|---|---|---|---|---|---|
| A | 6999 | 6999 | 12 | 12 | 0.17% | 0.17% | 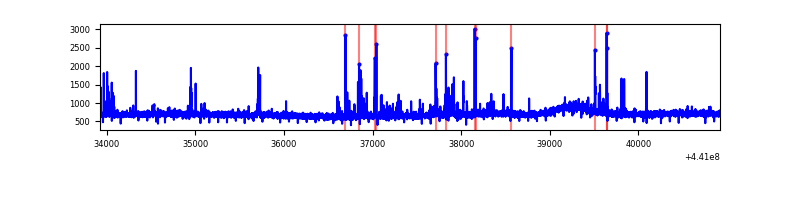 |
| B | 6999 | 6999 | 60 | 60 | 0.86% | 0.86% | 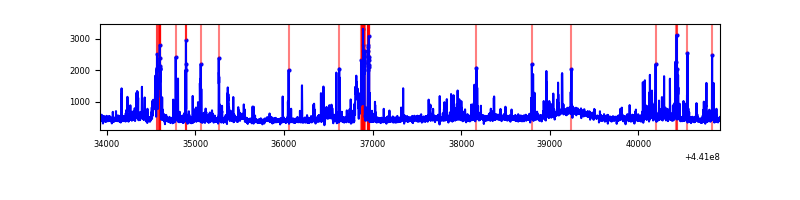 |
| C | 6999 | 6999 | 71 | 71 | 1.01% | 1.01% | 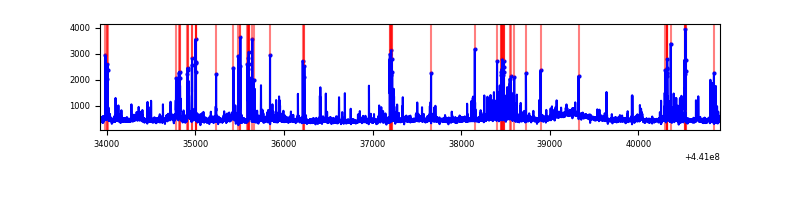 |
| D | 6998 | 6998 | 523 | 523 | 7.47% | 7.47% |  |
Top three noisy pixels from each quadrant. If the there are fewer than three noisy pixels in the level2.evt file, extra rows are filled as -1
| Pixel properties | Quadrant properties | ||||||
|---|---|---|---|---|---|---|---|
| Quadrant | DetID | PixID | Counts | Sigma | Mean | Median | Sigma |
| A | 10 | 83 | 1750938 | 10474.72 | 792 | 773 | 167.1 |
| A | 13 | 248 | 191704 | 1142.72 | 792 | 773 | 167.1 |
| A | 10 | 248 | 32888 | 192.2 | 792 | 773 | 167.1 |
| B | 5 | 235 | 484279 | 3088.34 | 781 | 756 | 156.6 |
| B | 5 | 255 | 70218 | 443.66 | 781 | 756 | 156.6 |
| B | 5 | 172 | 56686 | 357.23 | 781 | 756 | 156.6 |
| C | 14 | 254 | 367926 | 2033.6 | 767 | 772 | 180.5 |
| C | 2 | 14 | 187005 | 1031.51 | 767 | 772 | 180.5 |
| C | 3 | 233 | 153015 | 843.25 | 767 | 772 | 180.5 |
| D | 2 | 249 | 689302 | 3616.73 | 751 | 727 | 190.4 |
| D | 4 | 232 | 619919 | 3252.3 | 751 | 727 | 190.4 |
| D | 5 | 171 | 487226 | 2555.33 | 751 | 727 | 190.4 |
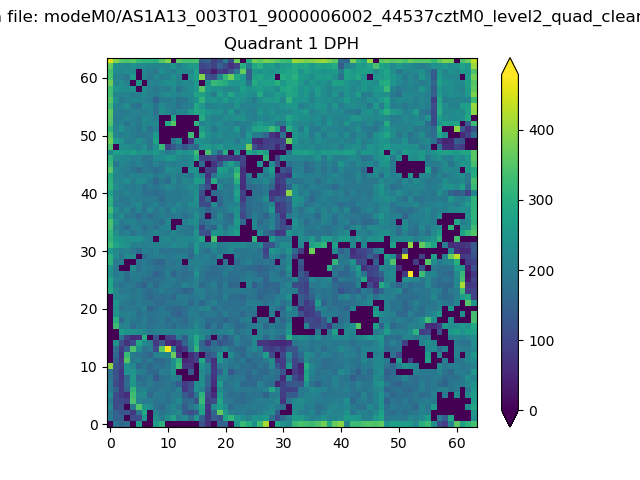
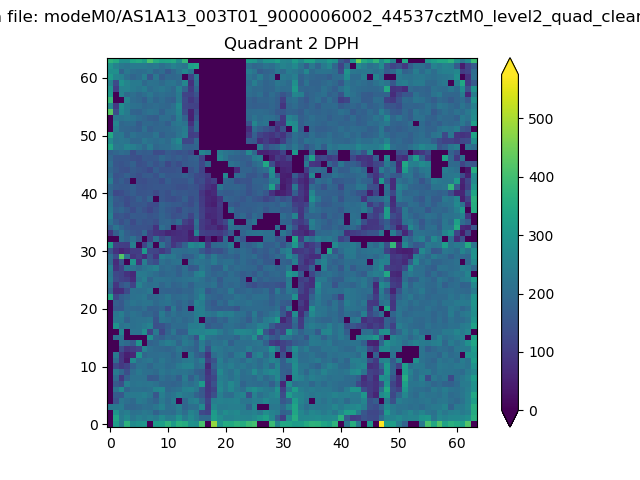
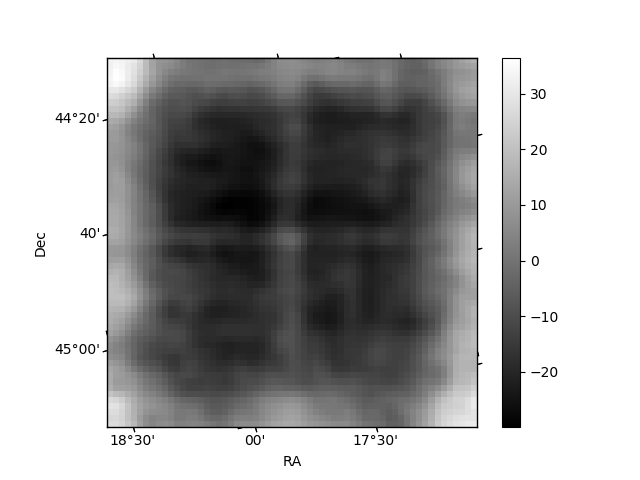
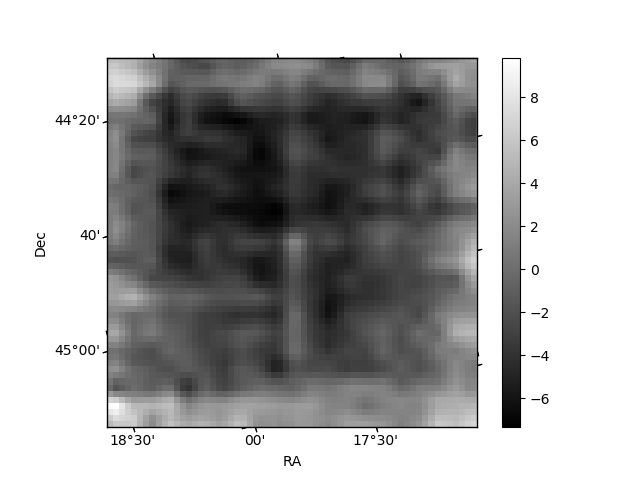
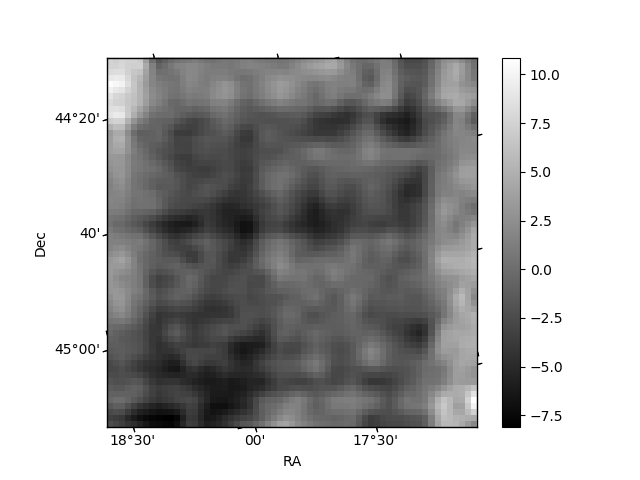
Histogram calculated using DETX and DETY for each event in the final _common_clean file
| Quadrant A | 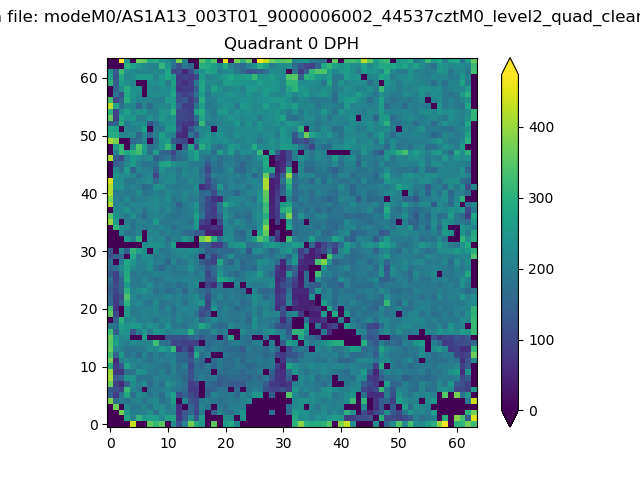 |
 |
Quadrant B |
|---|---|---|---|
| Quadrant D | 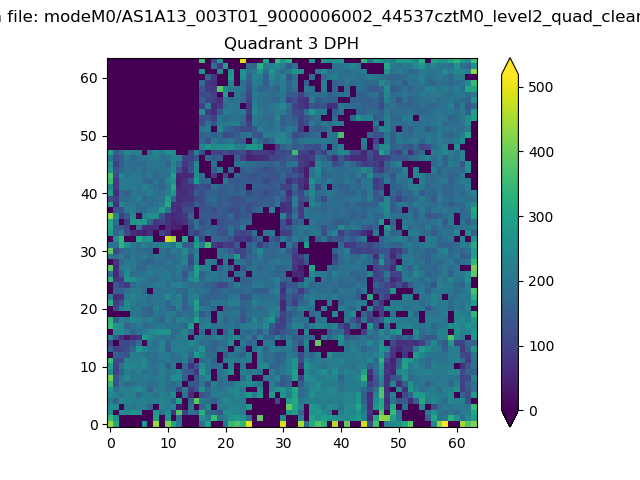 |
 |
Quadrant C |
| Plot type | Count rate plots | Images |
|---|---|---|
| Comparison with Poisson distribution Blue bars denote a histogram of data divided into 1 sec bins. Red curve is a Poisson curve with rate = median count rate of data. |
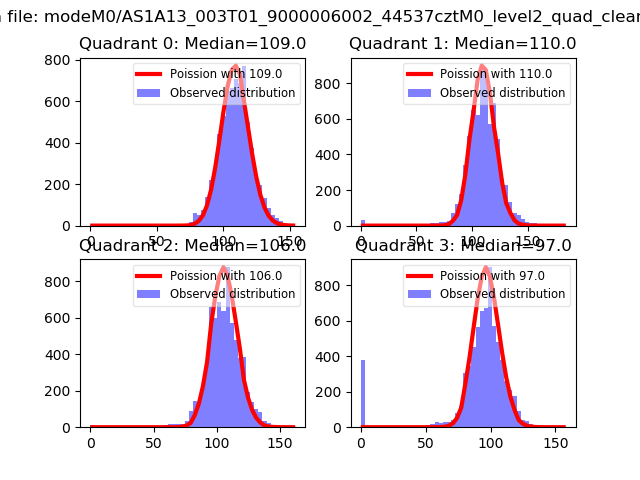 |
 |
| Quadrant-wise count rates Data is divided into 100 sec bins |
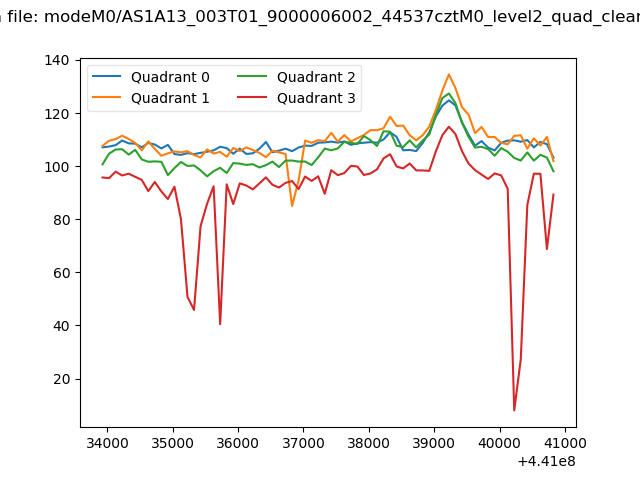 |
|
| Module-wise count rates for Quadrant A Data is divided into 100 sec bins |
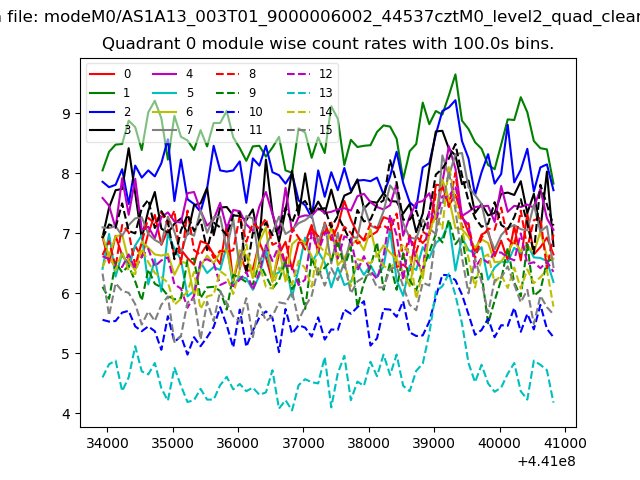 |
 |
| Module-wise count rates for Quadrant B Data is divided into 100 sec bins |
 |
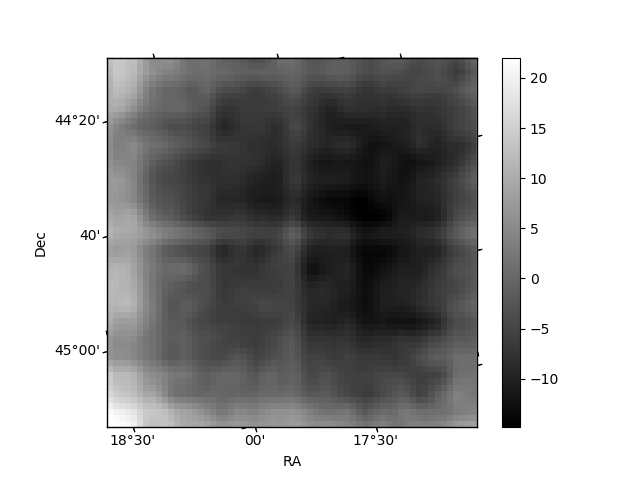 |
| Module-wise count rates for Quadrant C Data is divided into 100 sec bins |
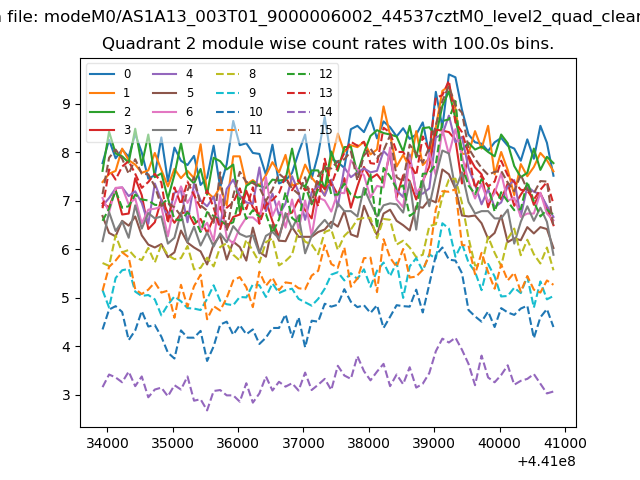 |
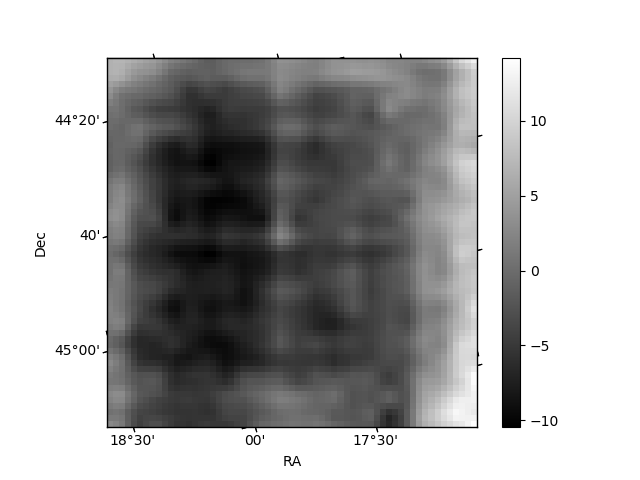 |
| Module-wise count rates for Quadrant D Data is divided into 100 sec bins |
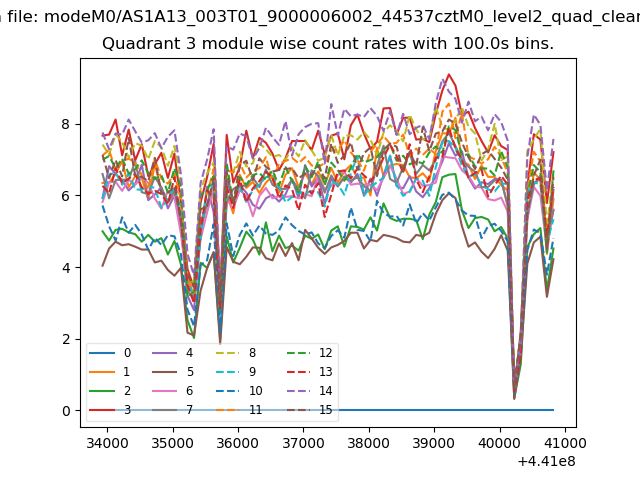 |
 |
| Parameter | Plot |
|---|---|
| CZT HV Monitor | 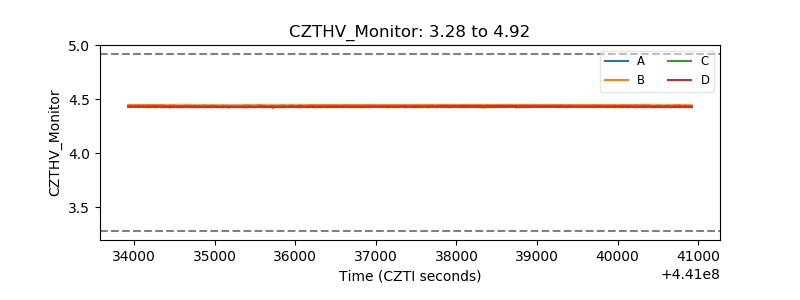 |
| D_VDD | 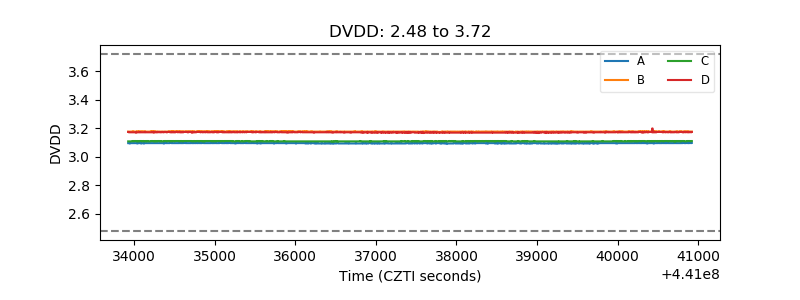 |
| Temperature 1 | 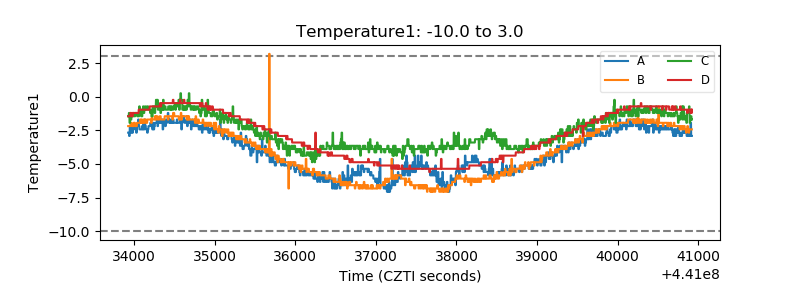 |
| Veto HV Monitor | 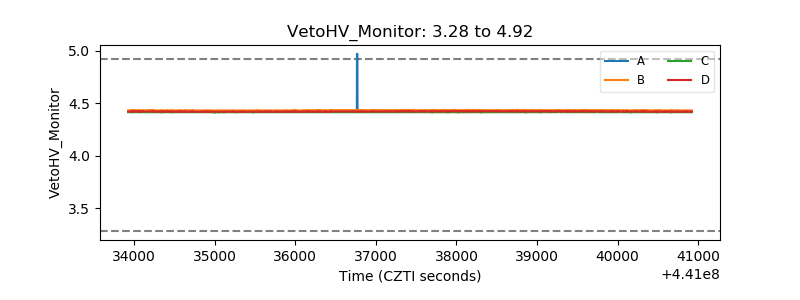 |
| Veto LLD | 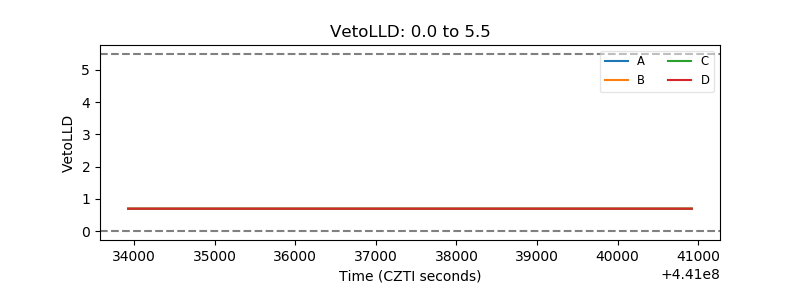 |
| Alpha Counter | 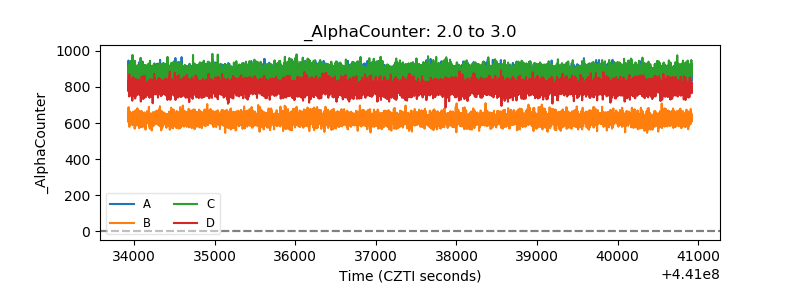 |
| _CPM_Rate | 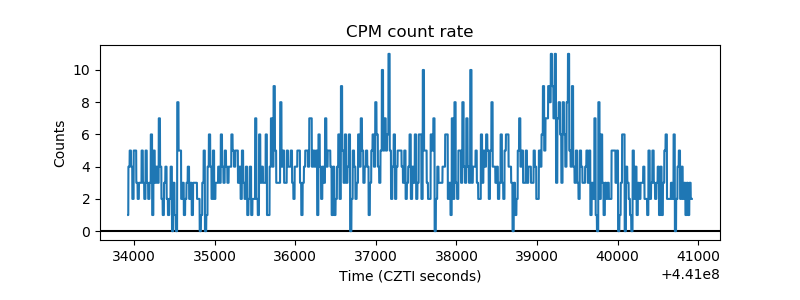 |
| CZT Counter | 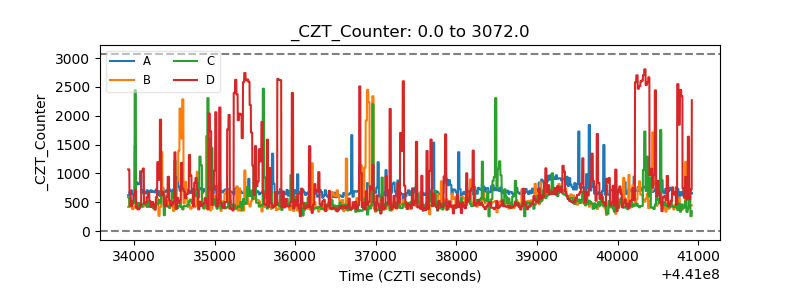 |
| +2.5 Volts monitor | 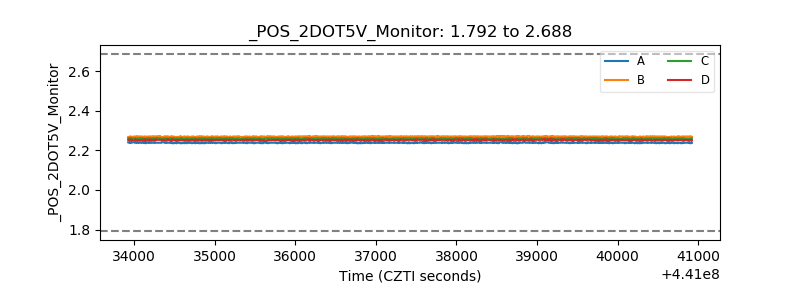 |
| +5 Volts monitor | 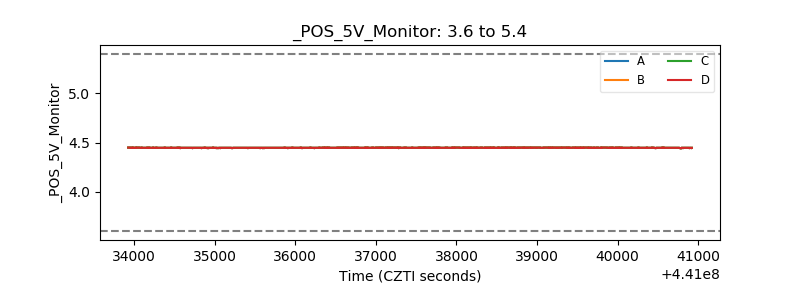 |
| _ROLL_ROT | 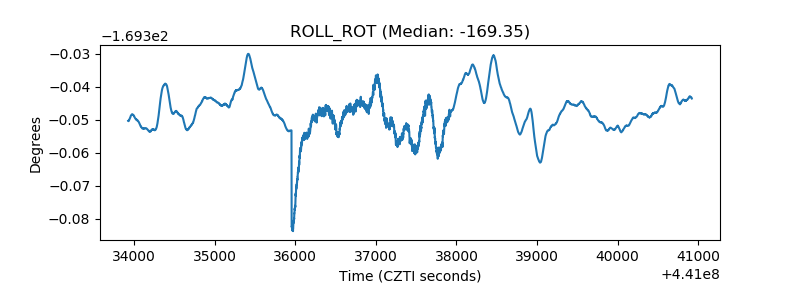 |
| _Roll_DEC | 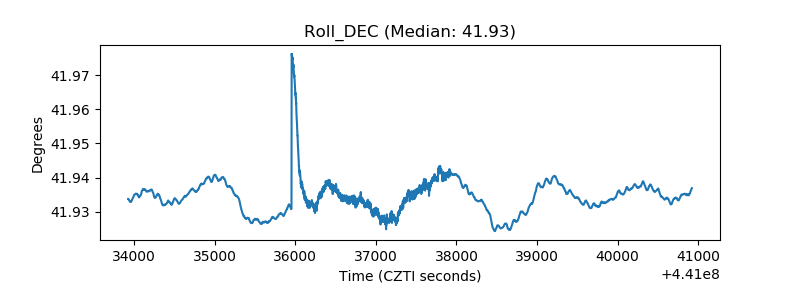 |
| _Roll_RA | 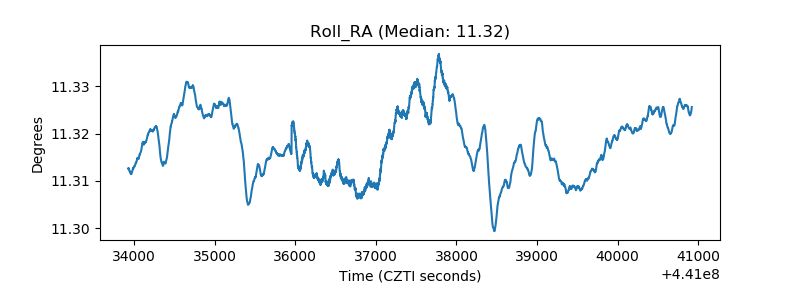 |
| Veto Counter | 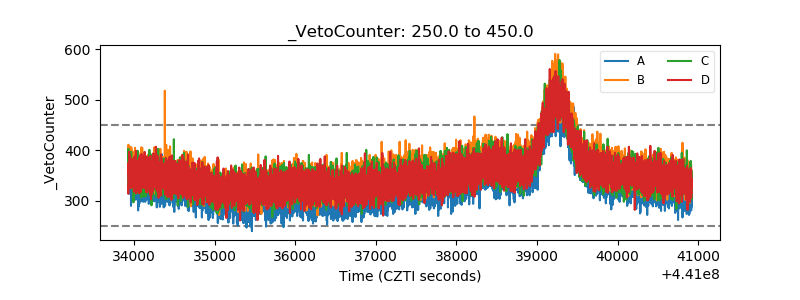 |