| Param | Original file | Final file |
|---|---|---|
| Filename | modeM0/AS1A13_003T01_9000006002_44540cztM0_level2.fits | modeM0/AS1A13_003T01_9000006002_44540cztM0_level2_quad_clean.evt |
| Size (bytes) | 926,331,840 | 204,229,440 |
| Size | 883.4 MB | 194.8 MB |
| Events in quadrant A | 9,645,961 | 1,367,550 |
| Events in quadrant B | 8,062,326 | 1,343,487 |
| Events in quadrant C | 6,747,139 | 1,355,062 |
| Events in quadrant D | 8,823,773 | 1,215,184 |
| Mode M9 | |||
|---|---|---|---|
| Quadrant | BADHDUFLAG | Total packets | Discarded packets |
| A | 0 | 11 | 0 |
| B | 0 | 11 | 0 |
| C | 0 | 11 | 0 |
| D | 0 | 11 | 0 |
| Mode SS | |||
|---|---|---|---|
| Quadrant | BADHDUFLAG | Total packets | Discarded packets |
| A | 0 | 264 | 0 |
| B | 0 | 264 | 0 |
| C | 0 | 264 | 0 |
| D | 0 | 264 | 0 |
| Mode M0 | |||
|---|---|---|---|
| Quadrant | BADHDUFLAG | Total packets | Discarded packets |
| A | 0 | 39821 | 4 |
| B | 0 | 33134 | 4 |
| C | 0 | 29080 | 2 |
| D | 0 | 35352 | 2 |
| Quadrant | Total seconds | Saturated seconds | Saturation percentage |
|---|---|---|---|
| A | 13056 | 329 | 2.519914% |
| B | 13057 | 769 | 5.889561% |
| C | 13058 | 183 | 1.401440% |
| D | 13058 | 673 | 5.153929% |
Noise dominated data is calculated using 1-second bins in cleaned event files. If a bin has >2000 counts, and if more than 50% of those come from <1% of pixels, then it is considered to be noise-dominated and hence unusable.
| Quadrant | # 1 sec bins | Bins with >0 counts | Bins with >2000 counts | High rate bins dominated by noise | Noise dominated (total time) | Noise dominated (detector-on time) | Marked lightcurve |
|---|---|---|---|---|---|---|---|
| A | 14062 | 13058 | 114 | 114 | 0.81% | 0.87% | 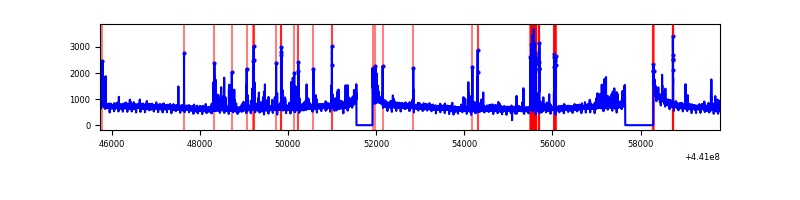 |
| B | 14063 | 13059 | 491 | 491 | 3.49% | 3.76% | 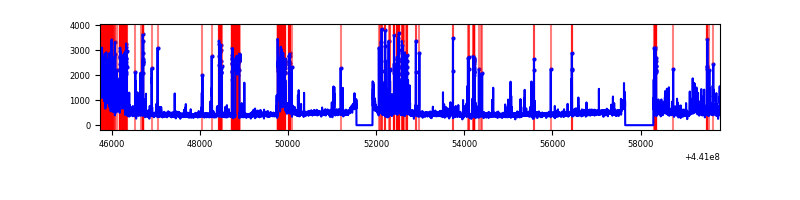 |
| C | 14063 | 13060 | 86 | 86 | 0.61% | 0.66% | 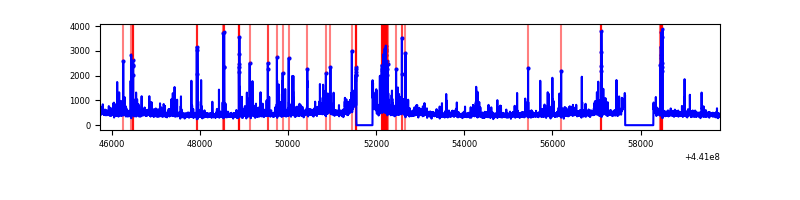 |
| D | 14063 | 13060 | 515 | 515 | 3.66% | 3.94% | 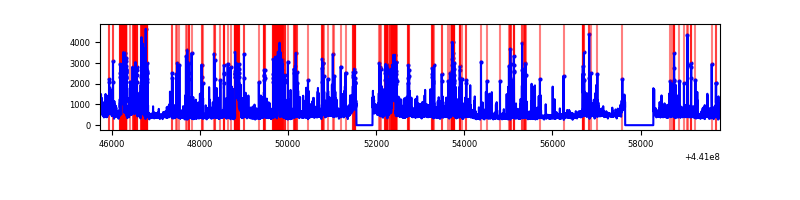 |
Top three noisy pixels from each quadrant. If the there are fewer than three noisy pixels in the level2.evt file, extra rows are filled as -1
| Pixel properties | Quadrant properties | ||||||
|---|---|---|---|---|---|---|---|
| Quadrant | DetID | PixID | Counts | Sigma | Mean | Median | Sigma |
| A | 10 | 83 | 3406878 | 11399.87 | 1451 | 1419 | 298.7 |
| A | 13 | 248 | 547484 | 1827.97 | 1451 | 1419 | 298.7 |
| A | 9 | 191 | 45813 | 148.61 | 1451 | 1419 | 298.7 |
| B | 5 | 235 | 1892371 | 6756.88 | 1415 | 1371 | 279.9 |
| B | 0 | 168 | 160166 | 567.4 | 1415 | 1371 | 279.9 |
| B | 5 | 255 | 113410 | 400.34 | 1415 | 1371 | 279.9 |
| C | 14 | 254 | 523161 | 1555.38 | 1425 | 1433 | 335.4 |
| C | 3 | 233 | 397876 | 1181.88 | 1425 | 1433 | 335.4 |
| C | 2 | 14 | 215168 | 637.19 | 1425 | 1433 | 335.4 |
| D | 2 | 249 | 1205652 | 3390.62 | 1411 | 1365 | 355.2 |
| D | 1 | 52 | 1005699 | 2827.66 | 1411 | 1365 | 355.2 |
| D | 4 | 232 | 292628 | 820.04 | 1411 | 1365 | 355.2 |
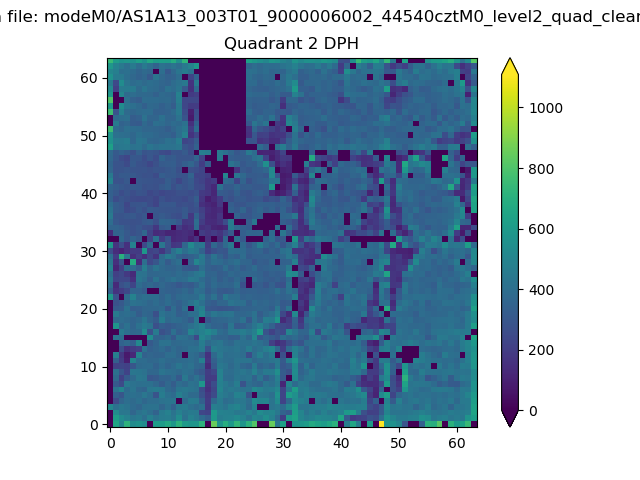
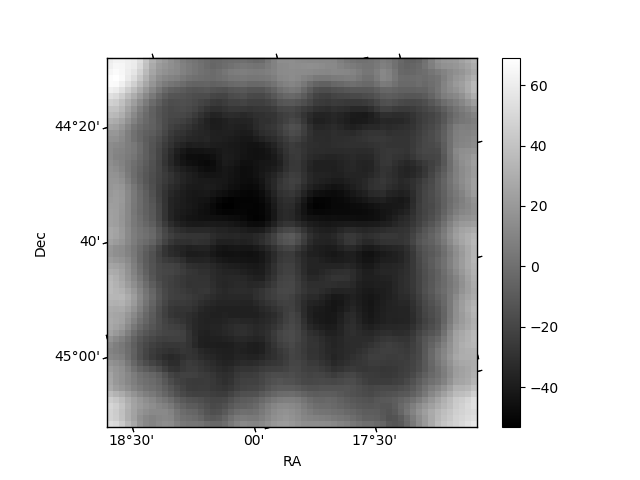
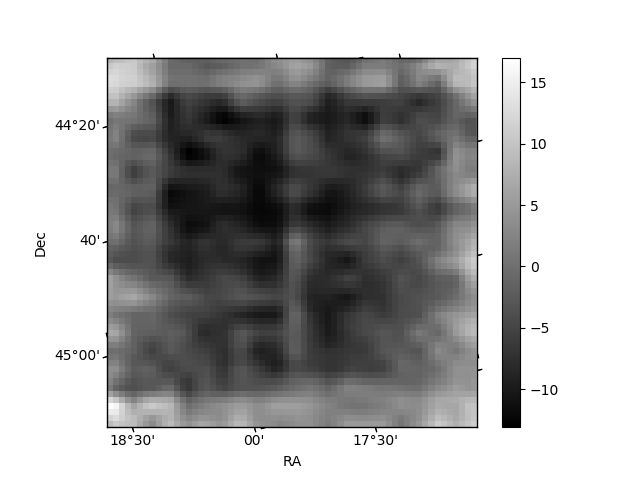
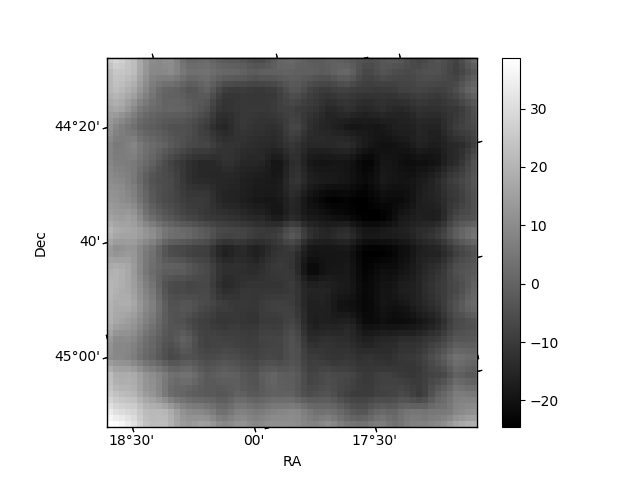
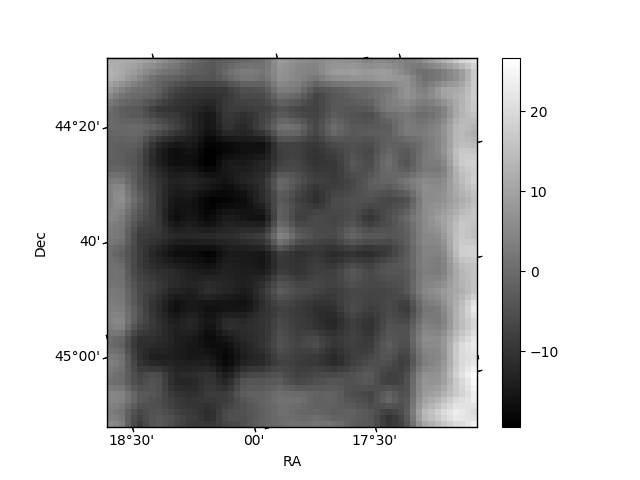
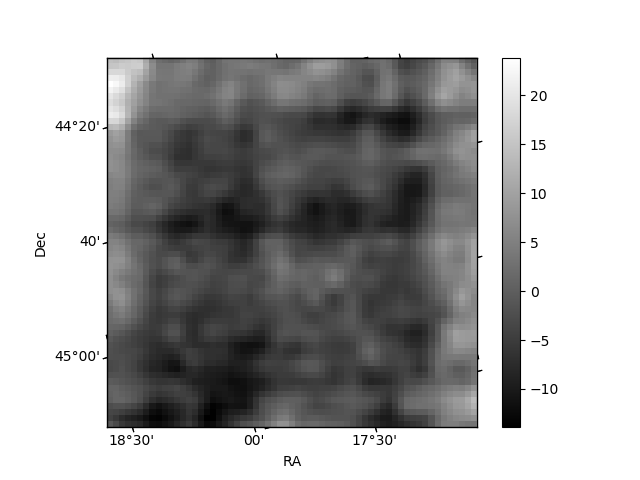
Histogram calculated using DETX and DETY for each event in the final _common_clean file
| Quadrant A | 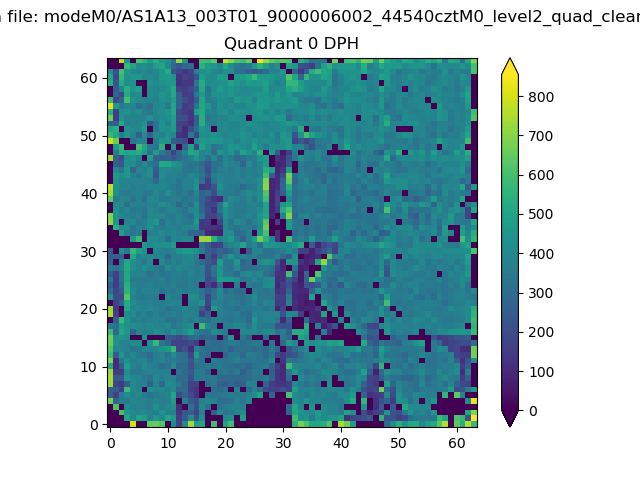 |
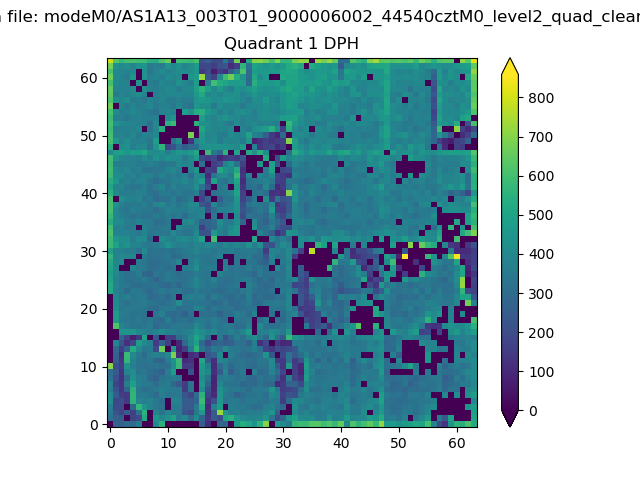 |
Quadrant B |
|---|---|---|---|
| Quadrant D | 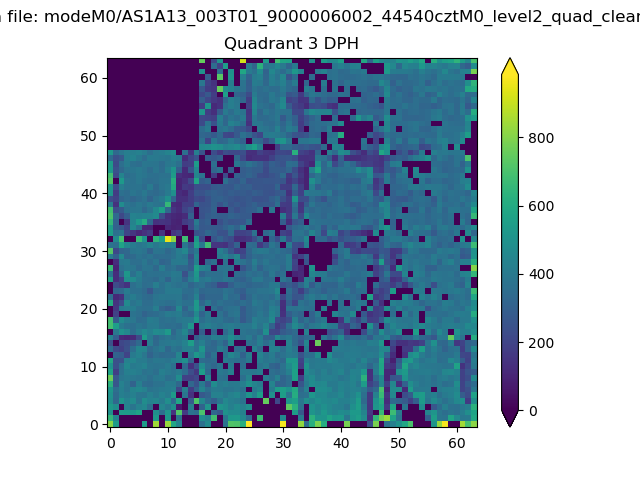 |
 |
Quadrant C |
| Plot type | Count rate plots | Images |
|---|---|---|
| Comparison with Poisson distribution Blue bars denote a histogram of data divided into 1 sec bins. Red curve is a Poisson curve with rate = median count rate of data. |
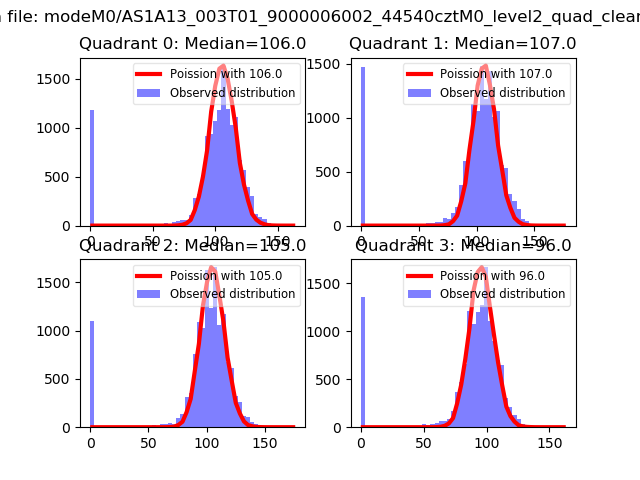 |
 |
| Quadrant-wise count rates Data is divided into 100 sec bins |
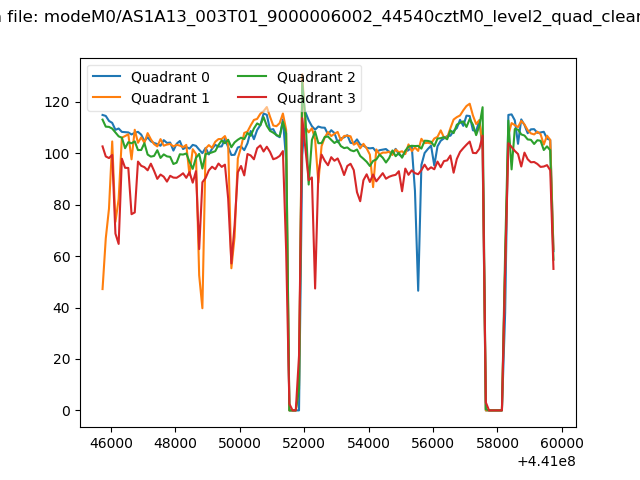 |
|
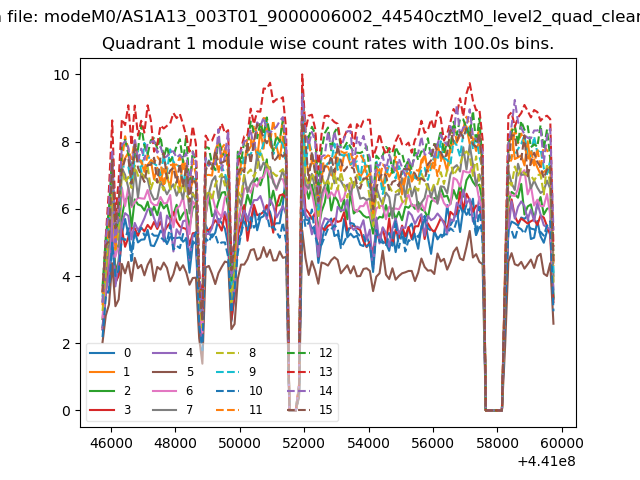
| Module-wise count rates for Quadrant A Data is divided into 100 sec bins |
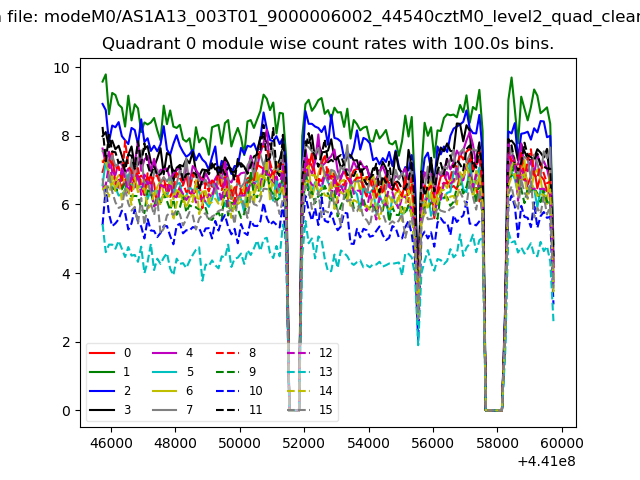 |
 |
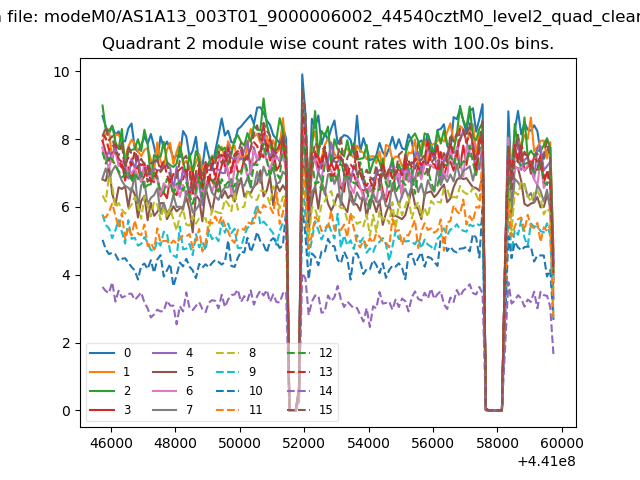
| Module-wise count rates for Quadrant B Data is divided into 100 sec bins |
 |
 |
| Module-wise count rates for Quadrant C Data is divided into 100 sec bins |
 |
 |
| Module-wise count rates for Quadrant D Data is divided into 100 sec bins |
 |
 |
| Parameter | Plot |
|---|---|
| CZT HV Monitor | 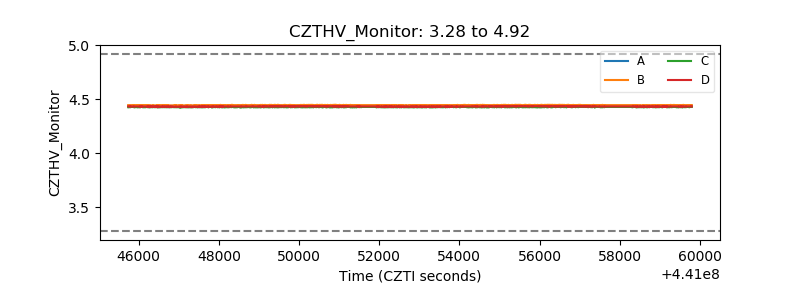 |
| D_VDD | 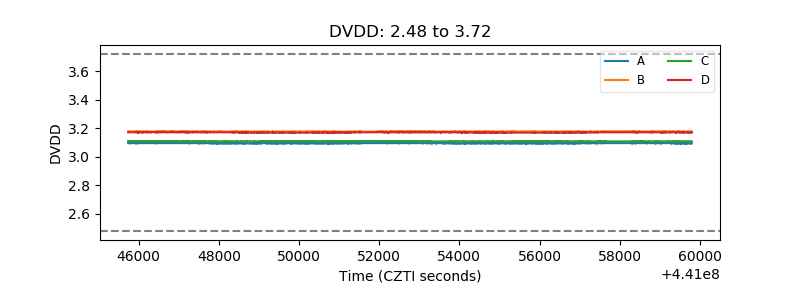 |
| Temperature 1 | 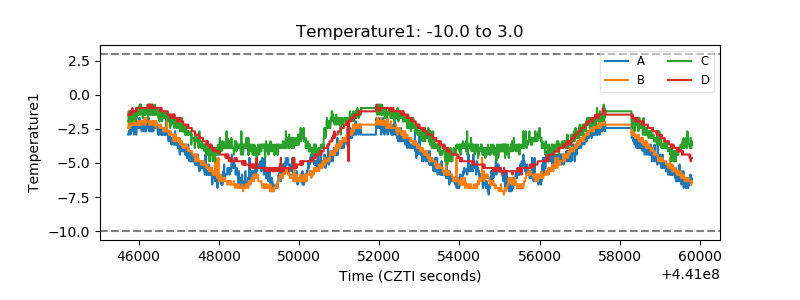 |
| Veto HV Monitor | 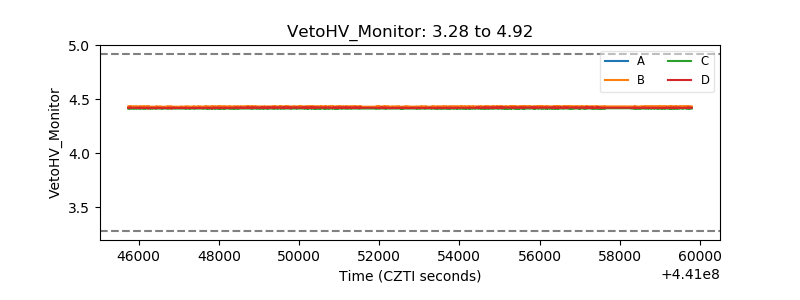 |
| Veto LLD | 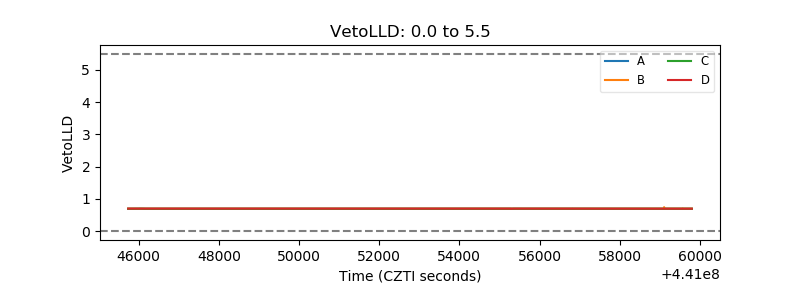 |
| Alpha Counter | 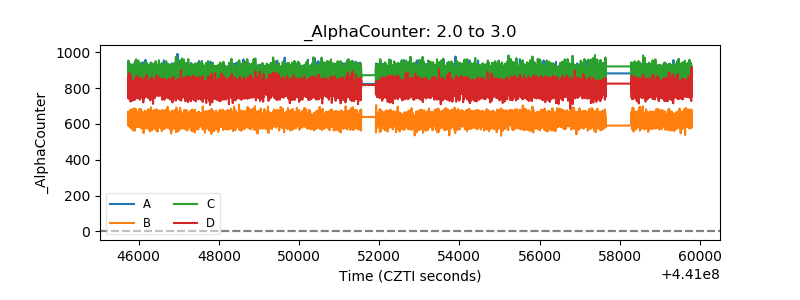 |
| _CPM_Rate | 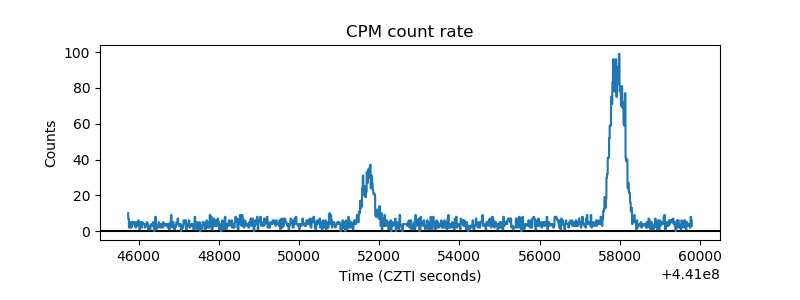 |
| CZT Counter | 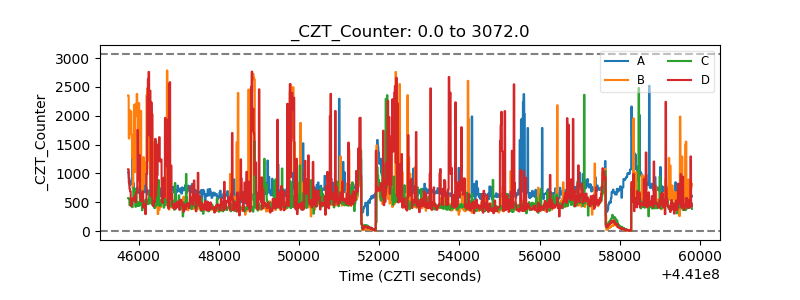 |
| +2.5 Volts monitor | 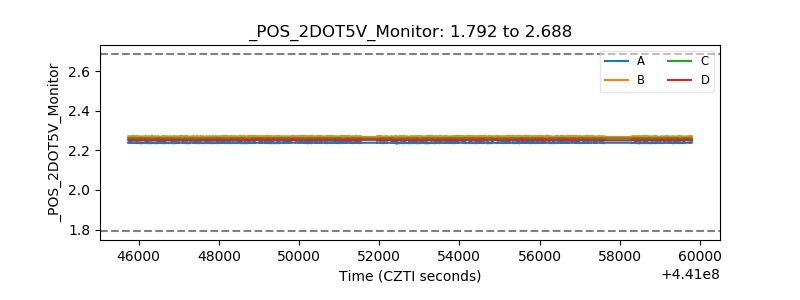 |
| +5 Volts monitor | 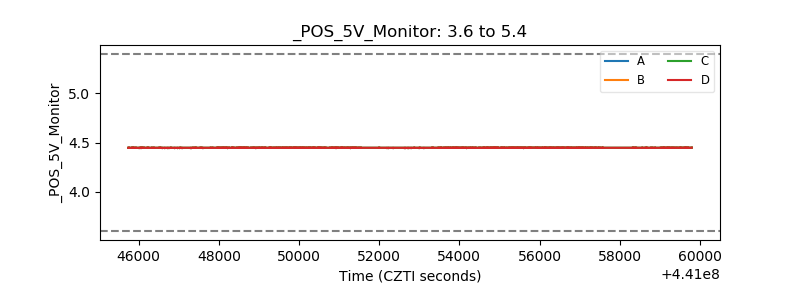 |
| _ROLL_ROT |  |
| _Roll_DEC | 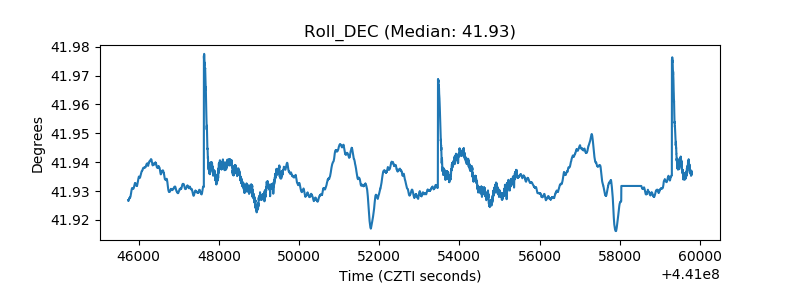 |
| _Roll_RA | 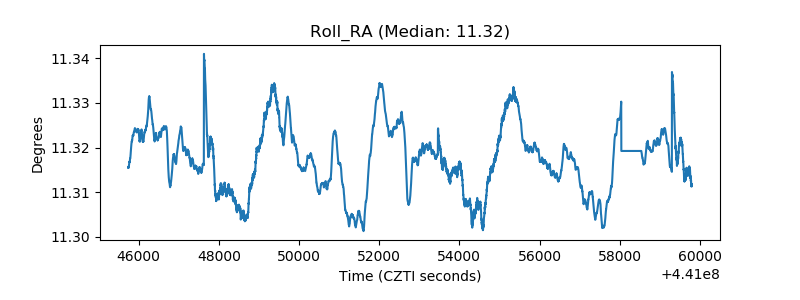 |
| Veto Counter | 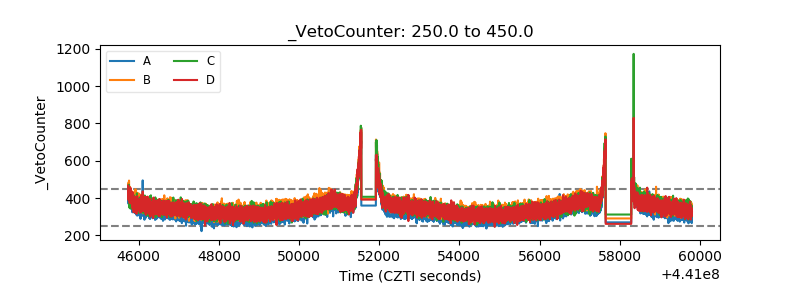 |