| Param | Original file | Final file |
|---|---|---|
| Filename | modeM0/AS1A13_003T01_9000006002_44542cztM0_level2.fits | modeM0/AS1A13_003T01_9000006002_44542cztM0_level2_quad_clean.evt |
| Size (bytes) | 504,760,320 | 114,848,640 |
| Size | 481.4 MB | 109.5 MB |
| Events in quadrant A | 5,211,712 | 773,365 |
| Events in quadrant B | 4,085,101 | 786,305 |
| Events in quadrant C | 3,955,651 | 746,219 |
| Events in quadrant D | 4,876,418 | 673,244 |
| Mode M9 | |||
|---|---|---|---|
| Quadrant | BADHDUFLAG | Total packets | Discarded packets |
| A | 0 | 19 | 0 |
| B | 0 | 19 | 0 |
| C | 0 | 19 | 0 |
| D | 0 | 19 | 0 |
| Mode SS | |||
|---|---|---|---|
| Quadrant | BADHDUFLAG | Total packets | Discarded packets |
| A | 0 | 146 | 0 |
| B | 0 | 146 | 0 |
| C | 0 | 146 | 0 |
| D | 0 | 146 | 0 |
| Mode M0 | |||
|---|---|---|---|
| Quadrant | BADHDUFLAG | Total packets | Discarded packets |
| A | 0 | 21462 | 2 |
| B | 0 | 17237 | 2 |
| C | 0 | 16754 | 2 |
| D | 0 | 19619 | 2 |
| Quadrant | Total seconds | Saturated seconds | Saturation percentage |
|---|---|---|---|
| A | 7159 | 121 | 1.690180% |
| B | 7159 | 172 | 2.402570% |
| C | 7159 | 221 | 3.087023% |
| D | 7159 | 421 | 5.880710% |
Noise dominated data is calculated using 1-second bins in cleaned event files. If a bin has >2000 counts, and if more than 50% of those come from <1% of pixels, then it is considered to be noise-dominated and hence unusable.
| Quadrant | # 1 sec bins | Bins with >0 counts | Bins with >2000 counts | High rate bins dominated by noise | Noise dominated (total time) | Noise dominated (detector-on time) | Marked lightcurve |
|---|---|---|---|---|---|---|---|
| A | 9034 | 7161 | 10 | 10 | 0.11% | 0.14% | 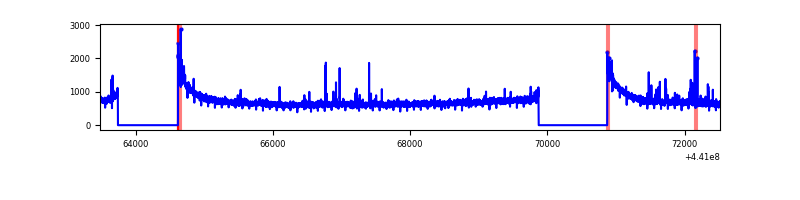 |
| B | 9034 | 7161 | 87 | 87 | 0.96% | 1.21% | 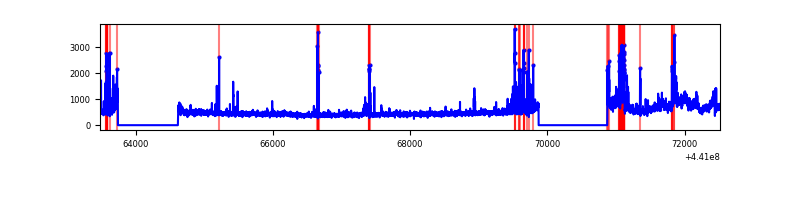 |
| C | 9034 | 7161 | 190 | 190 | 2.10% | 2.65% | 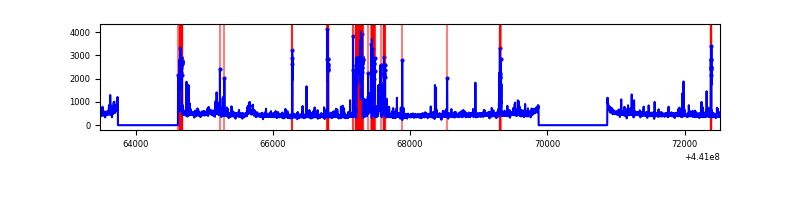 |
| D | 9034 | 7161 | 342 | 342 | 3.79% | 4.78% |  |
Top three noisy pixels from each quadrant. If the there are fewer than three noisy pixels in the level2.evt file, extra rows are filled as -1
| Pixel properties | Quadrant properties | ||||||
|---|---|---|---|---|---|---|---|
| Quadrant | DetID | PixID | Counts | Sigma | Mean | Median | Sigma |
| A | 10 | 83 | 2022014 | 12211.6 | 801 | 786 | 165.5 |
| A | 13 | 248 | 59680 | 355.82 | 801 | 786 | 165.5 |
| A | 10 | 248 | 20304 | 117.92 | 801 | 786 | 165.5 |
| B | 5 | 235 | 712746 | 4479.93 | 796 | 771 | 158.9 |
| B | 15 | 36 | 60728 | 377.27 | 796 | 771 | 158.9 |
| B | 5 | 172 | 47929 | 296.73 | 796 | 771 | 158.9 |
| C | 15 | 208 | 621174 | 3386.34 | 783 | 786 | 183.2 |
| C | 14 | 254 | 155813 | 846.2 | 783 | 786 | 183.2 |
| C | 3 | 233 | 111420 | 603.89 | 783 | 786 | 183.2 |
| D | 2 | 249 | 646990 | 3327.24 | 770 | 746 | 194.2 |
| D | 1 | 52 | 616312 | 3169.29 | 770 | 746 | 194.2 |
| D | 8 | 240 | 276809 | 1421.33 | 770 | 746 | 194.2 |
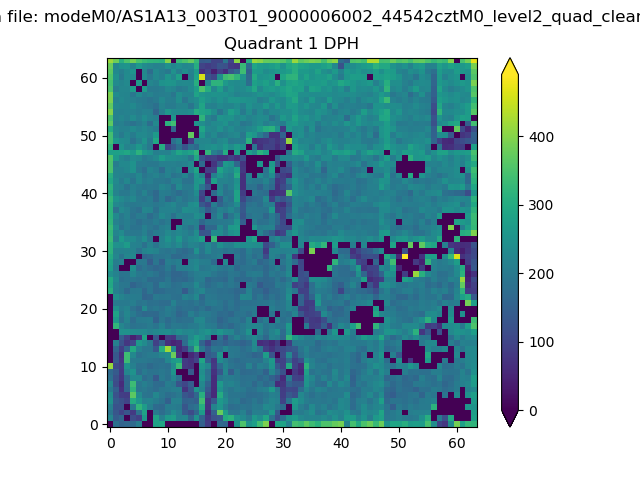
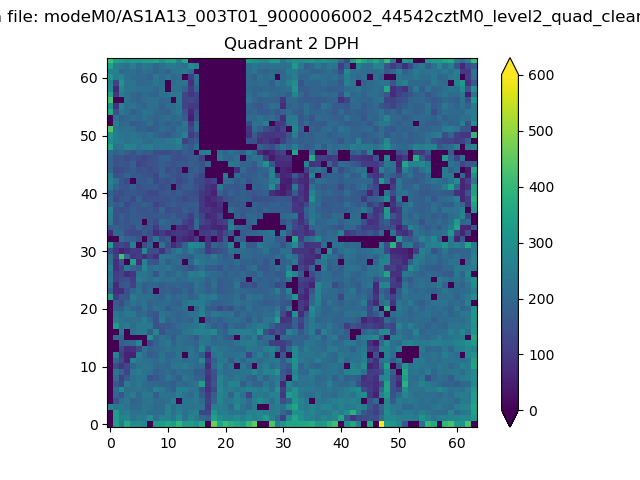
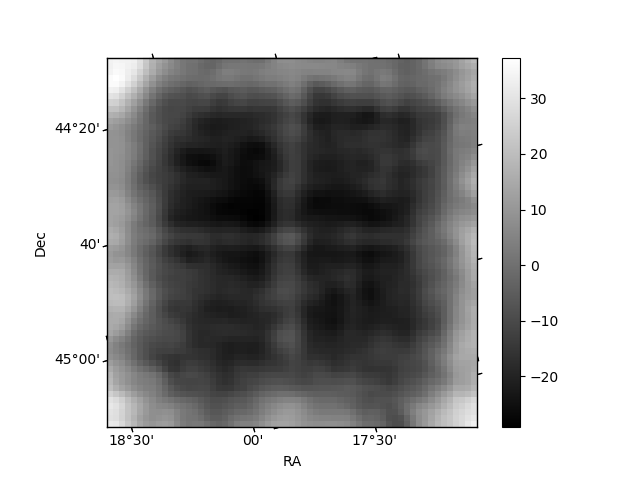
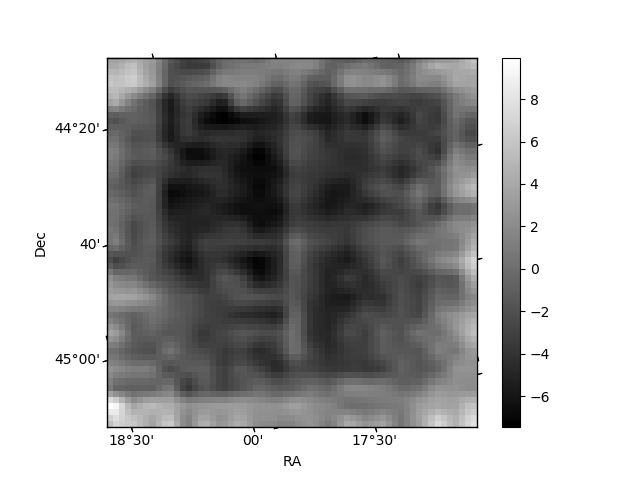
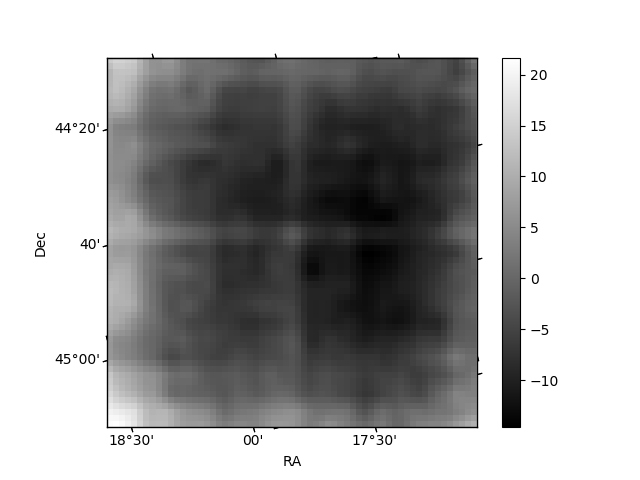
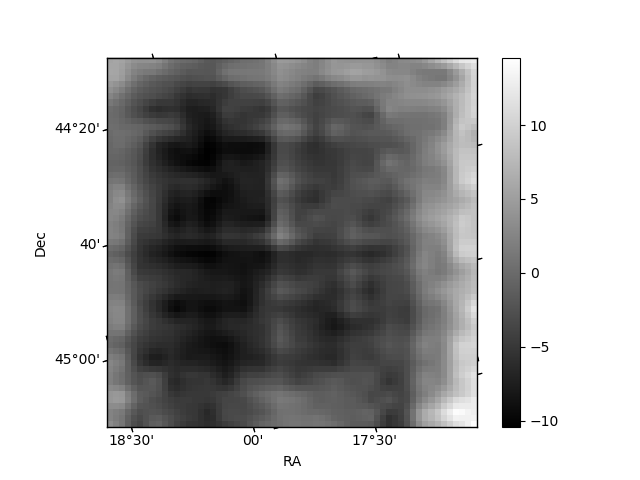
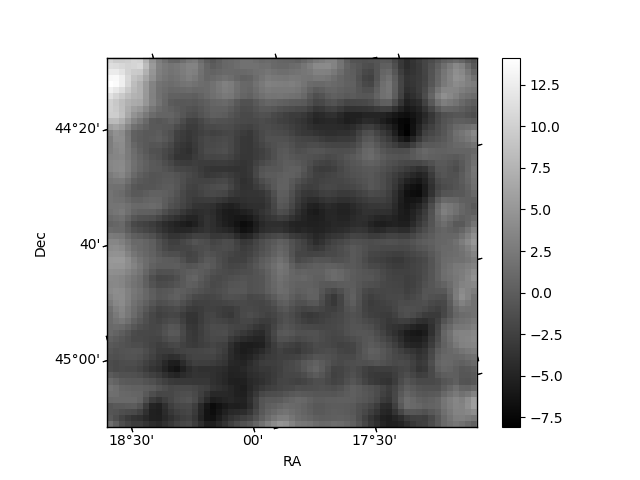
Histogram calculated using DETX and DETY for each event in the final _common_clean file
| Quadrant A | 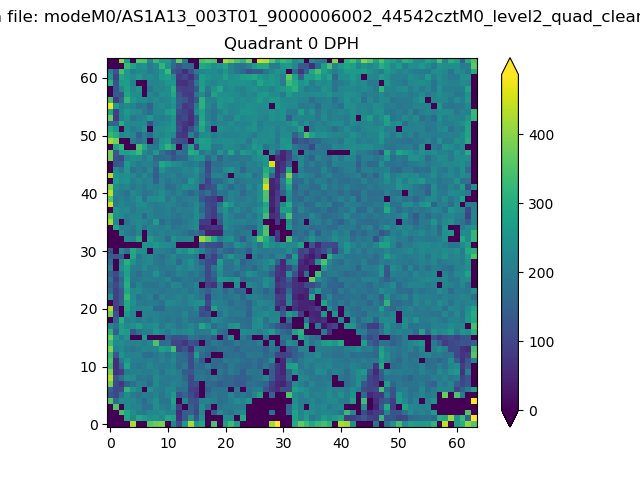 |
 |
Quadrant B |
|---|---|---|---|
| Quadrant D | 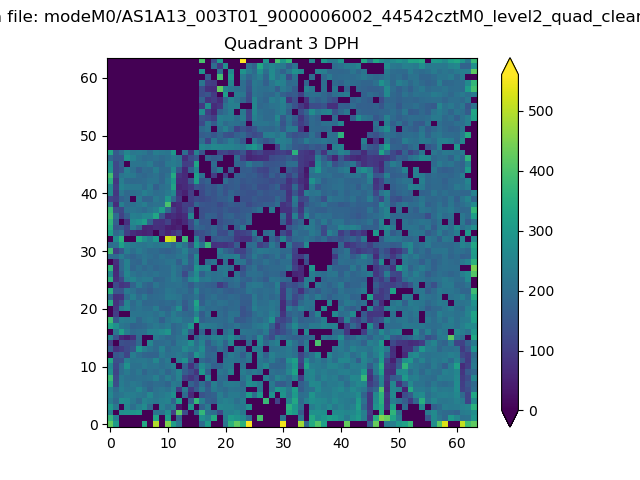 |
 |
Quadrant C |
| Plot type | Count rate plots | Images |
|---|---|---|
| Comparison with Poisson distribution Blue bars denote a histogram of data divided into 1 sec bins. Red curve is a Poisson curve with rate = median count rate of data. |
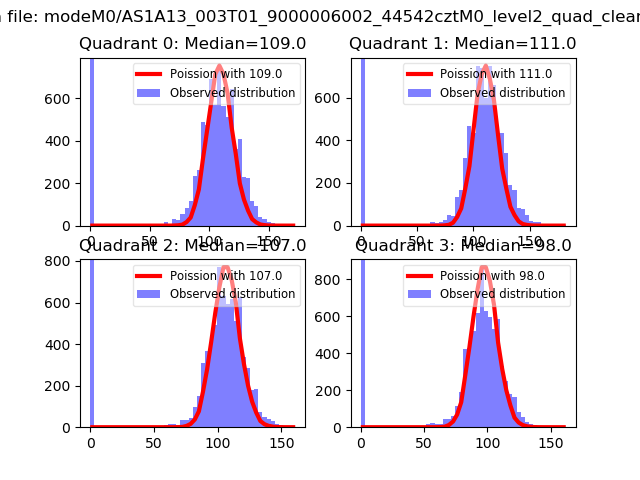 |
 |
| Quadrant-wise count rates Data is divided into 100 sec bins |
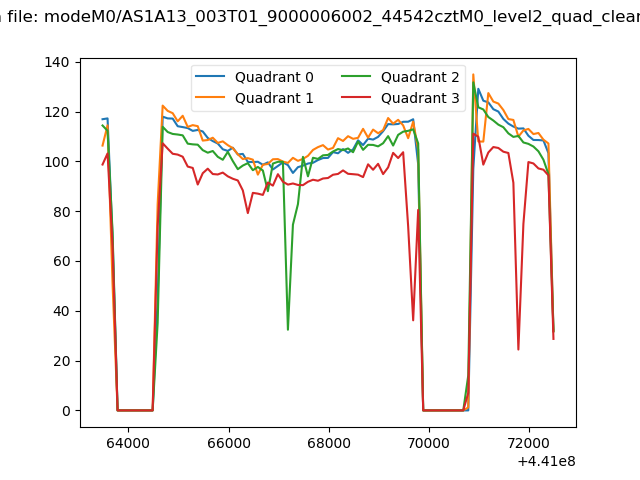 |
|
| Module-wise count rates for Quadrant A Data is divided into 100 sec bins |
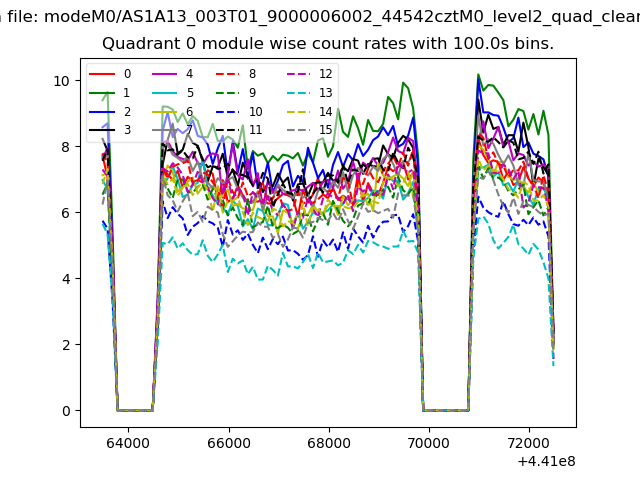 |
 |
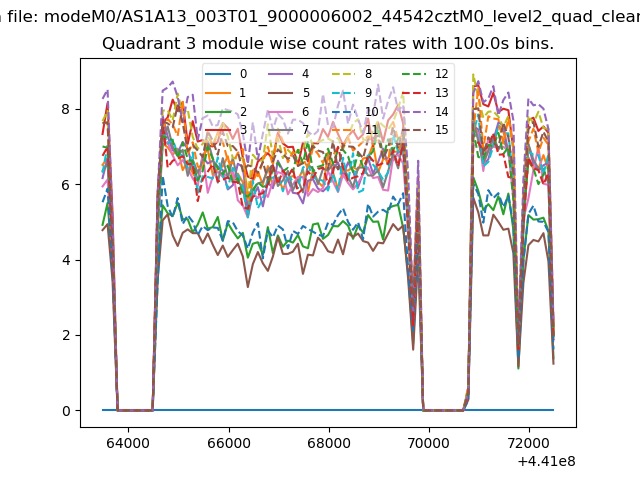
| Module-wise count rates for Quadrant B Data is divided into 100 sec bins |
 |
 |
| Module-wise count rates for Quadrant C Data is divided into 100 sec bins |
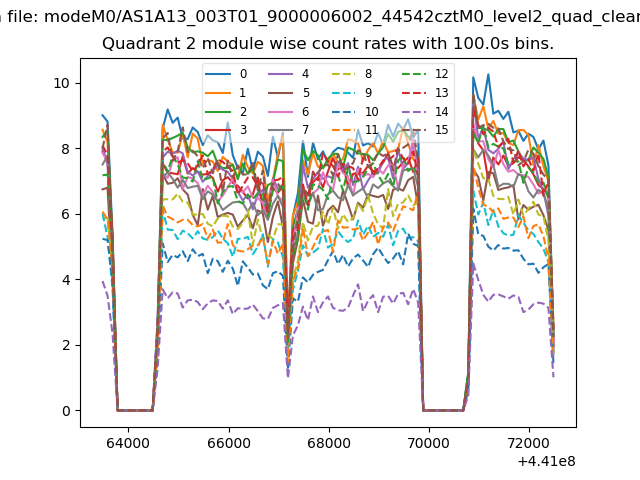 |
 |
| Module-wise count rates for Quadrant D Data is divided into 100 sec bins |
 |
 |
| Parameter | Plot |
|---|---|
| CZT HV Monitor |  |
| D_VDD | 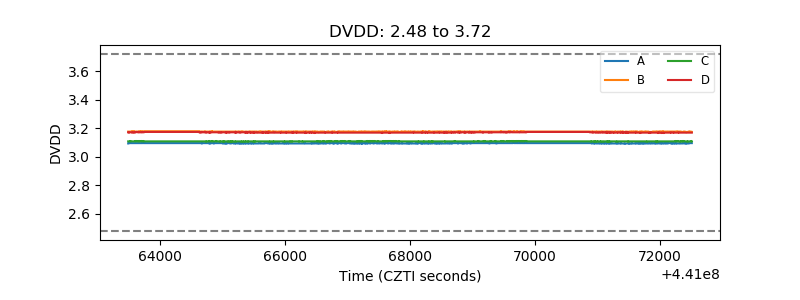 |
| Temperature 1 | 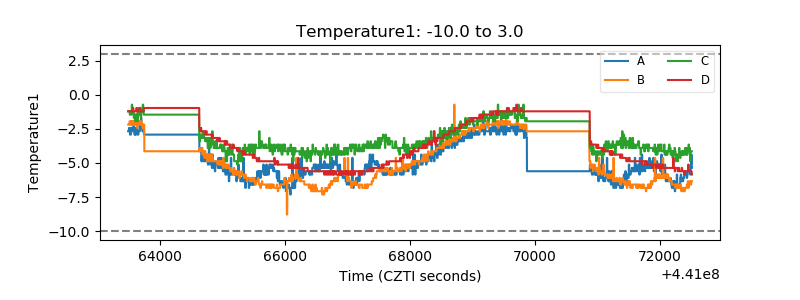 |
| Veto HV Monitor | 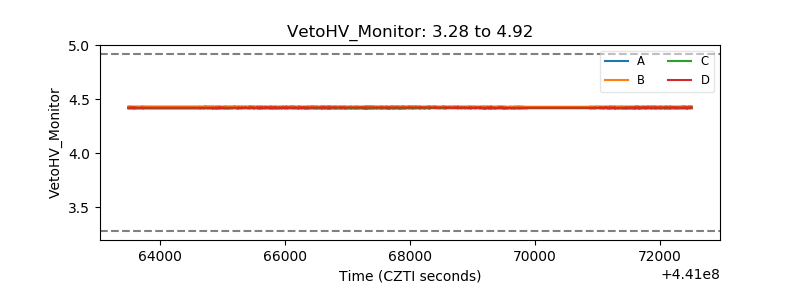 |
| Veto LLD | 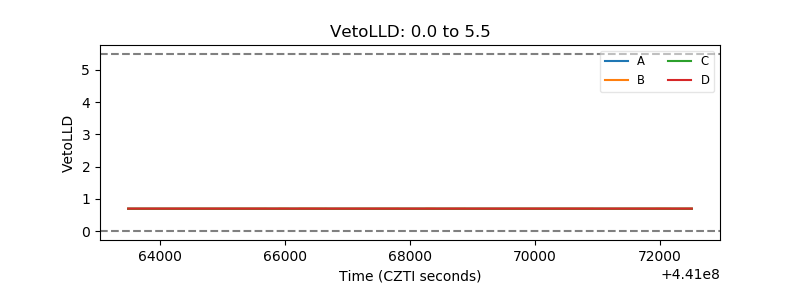 |
| Alpha Counter | 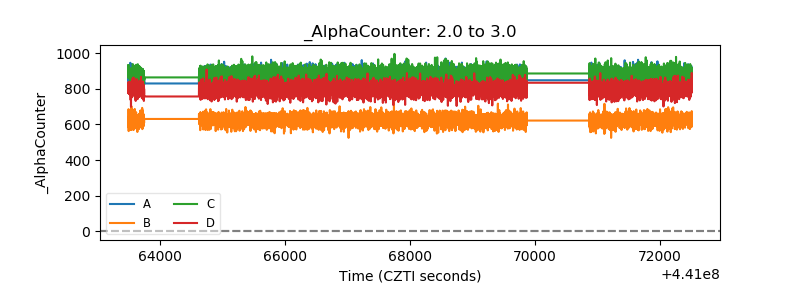 |
| _CPM_Rate | 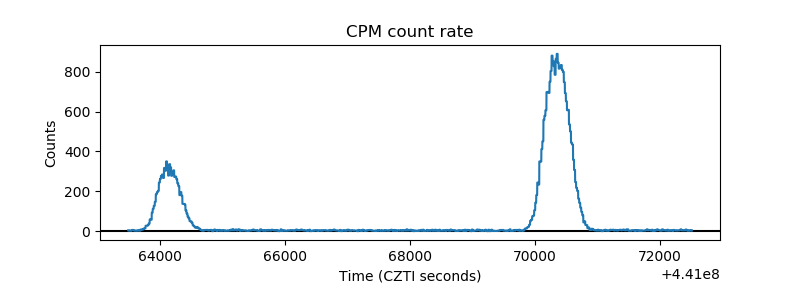 |
| CZT Counter | 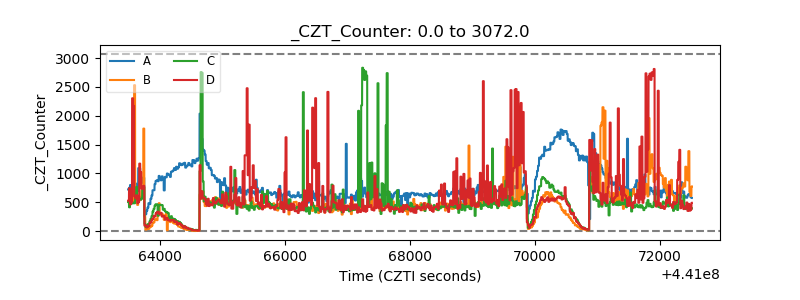 |
| +2.5 Volts monitor | 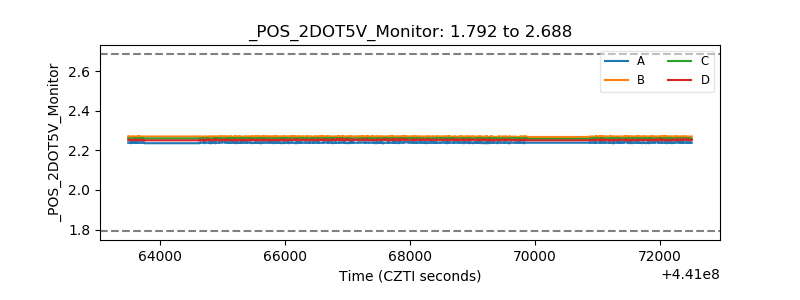 |
| +5 Volts monitor | 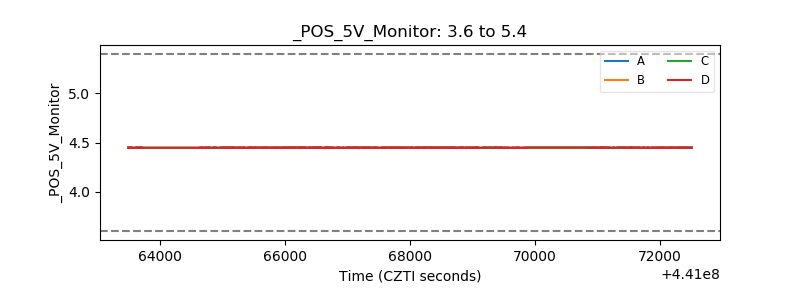 |
| _ROLL_ROT | 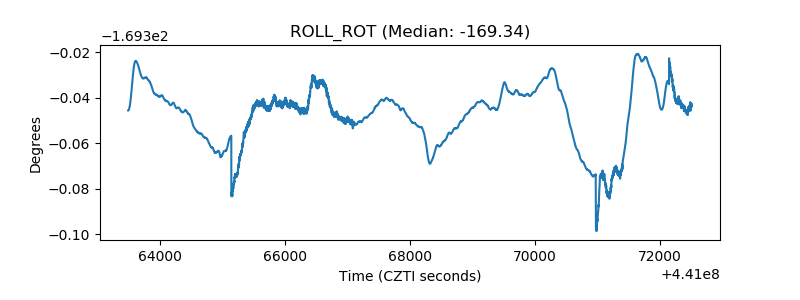 |
| _Roll_DEC | 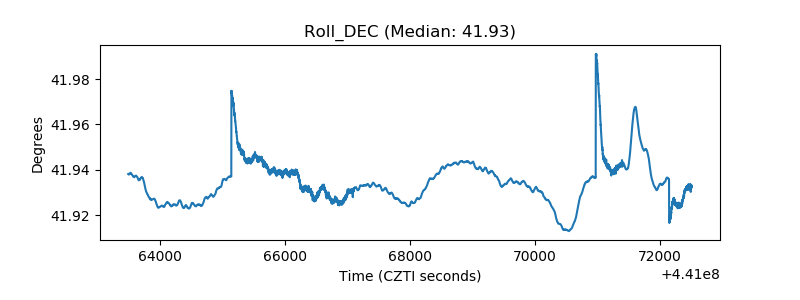 |
| _Roll_RA | 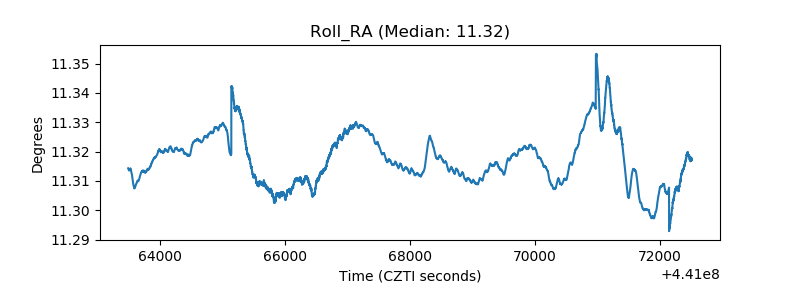 |
| Veto Counter | 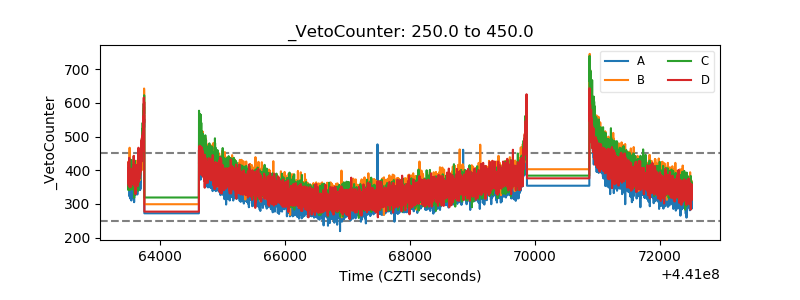 |