| Param | Original file | Final file |
|---|---|---|
| Filename | modeM0/AS1A13_003T01_9000006002_44556cztM0_level2.fits | modeM0/AS1A13_003T01_9000006002_44556cztM0_level2_quad_clean.evt |
| Size (bytes) | 527,353,920 | 106,574,400 |
| Size | 502.9 MB | 101.6 MB |
| Events in quadrant A | 5,355,674 | 710,216 |
| Events in quadrant B | 4,228,506 | 712,404 |
| Events in quadrant C | 3,359,600 | 715,368 |
| Events in quadrant D | 6,050,076 | 615,334 |
| Mode M9 | |||
|---|---|---|---|
| Quadrant | BADHDUFLAG | Total packets | Discarded packets |
| A | 0 | 15 | 0 |
| B | 0 | 16 | 0 |
| C | 0 | 16 | 0 |
| D | 0 | 16 | 0 |
| Mode SS | |||
|---|---|---|---|
| Quadrant | BADHDUFLAG | Total packets | Discarded packets |
| A | 0 | 138 | 0 |
| B | 0 | 138 | 0 |
| C | 0 | 138 | 0 |
| D | 0 | 138 | 0 |
| Mode M0 | |||
|---|---|---|---|
| Quadrant | BADHDUFLAG | Total packets | Discarded packets |
| A | 0 | 21528 | 2 |
| B | 0 | 17122 | 2 |
| C | 0 | 14766 | 2 |
| D | 0 | 22709 | 11 |
| Quadrant | Total seconds | Saturated seconds | Saturation percentage |
|---|---|---|---|
| A | 6794 | 284 | 4.180159% |
| B | 6794 | 389 | 5.725640% |
| C | 6794 | 74 | 1.089196% |
| D | 6792 | 620 | 9.128386% |
Noise dominated data is calculated using 1-second bins in cleaned event files. If a bin has >2000 counts, and if more than 50% of those come from <1% of pixels, then it is considered to be noise-dominated and hence unusable.
| Quadrant | # 1 sec bins | Bins with >0 counts | Bins with >2000 counts | High rate bins dominated by noise | Noise dominated (total time) | Noise dominated (detector-on time) | Marked lightcurve |
|---|---|---|---|---|---|---|---|
| A | 7729 | 6795 | 185 | 185 | 2.39% | 2.72% | 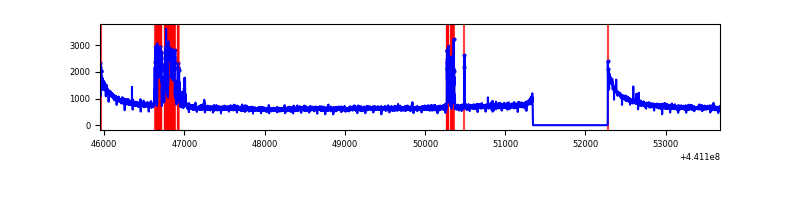 |
| B | 7729 | 6795 | 315 | 315 | 4.08% | 4.64% | 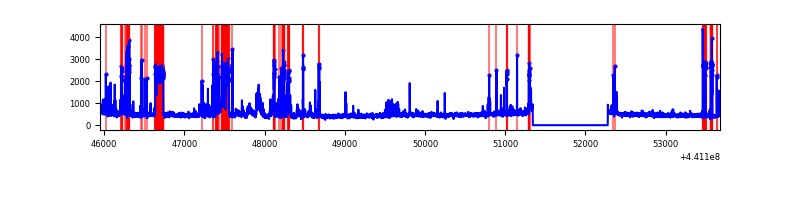 |
| C | 7729 | 6795 | 46 | 46 | 0.60% | 0.68% | 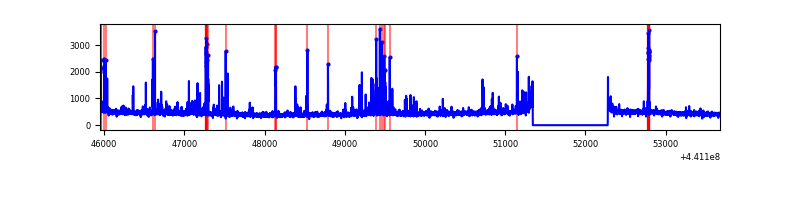 |
| D | 7729 | 6794 | 470 | 470 | 6.08% | 6.92% | 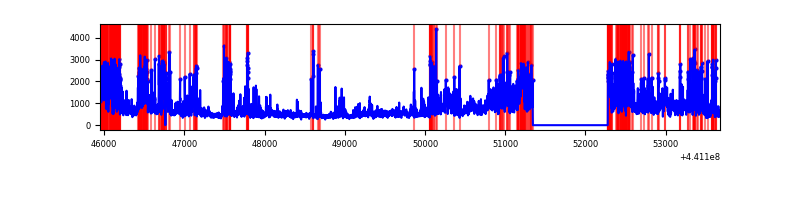 |
Top three noisy pixels from each quadrant. If the there are fewer than three noisy pixels in the level2.evt file, extra rows are filled as -1
| Pixel properties | Quadrant properties | ||||||
|---|---|---|---|---|---|---|---|
| Quadrant | DetID | PixID | Counts | Sigma | Mean | Median | Sigma |
| A | 10 | 83 | 1920596 | 12462.4 | 745 | 731 | 154.1 |
| A | 9 | 191 | 433745 | 2810.82 | 745 | 731 | 154.1 |
| A | 13 | 248 | 113309 | 730.78 | 745 | 731 | 154.1 |
| B | 5 | 235 | 901034 | 6204.12 | 735 | 712 | 145.1 |
| B | 5 | 255 | 158150 | 1084.91 | 735 | 712 | 145.1 |
| B | 4 | 171 | 112282 | 768.83 | 735 | 712 | 145.1 |
| C | 14 | 254 | 256209 | 1452.01 | 743 | 746 | 175.9 |
| C | 15 | 208 | 112423 | 634.75 | 743 | 746 | 175.9 |
| C | 3 | 233 | 39721 | 221.53 | 743 | 746 | 175.9 |
| D | 13 | 174 | 1724551 | 9478.85 | 719 | 700 | 181.9 |
| D | 2 | 249 | 894472 | 4914.54 | 719 | 700 | 181.9 |
| D | 13 | 171 | 297426 | 1631.59 | 719 | 700 | 181.9 |
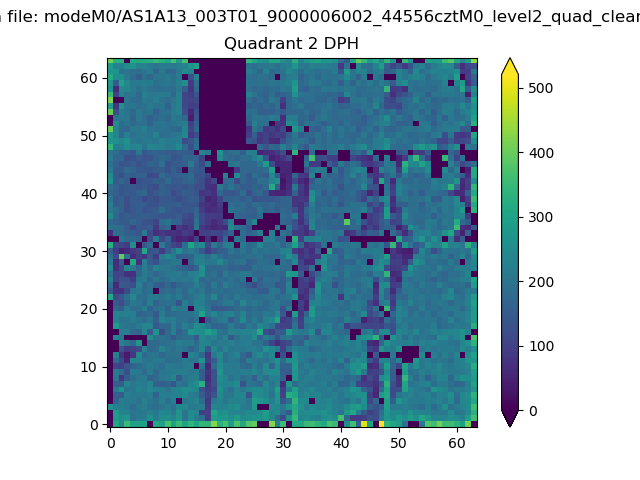
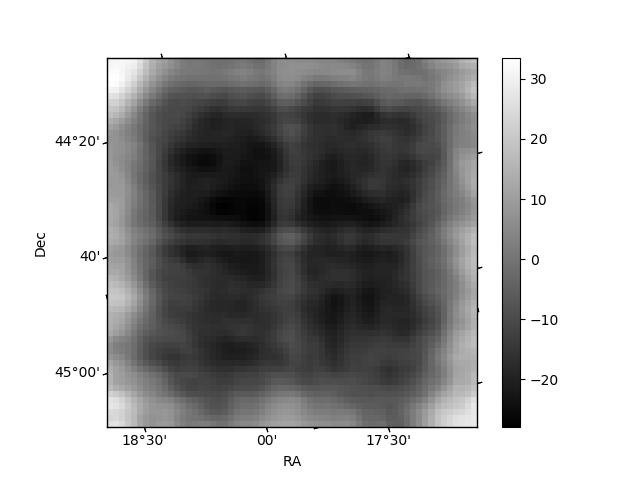
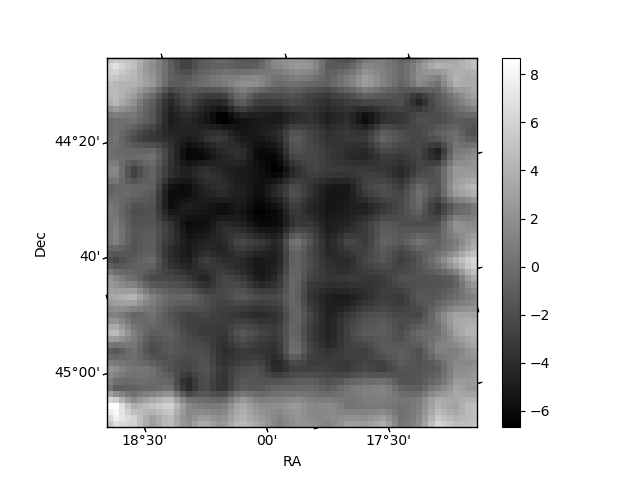
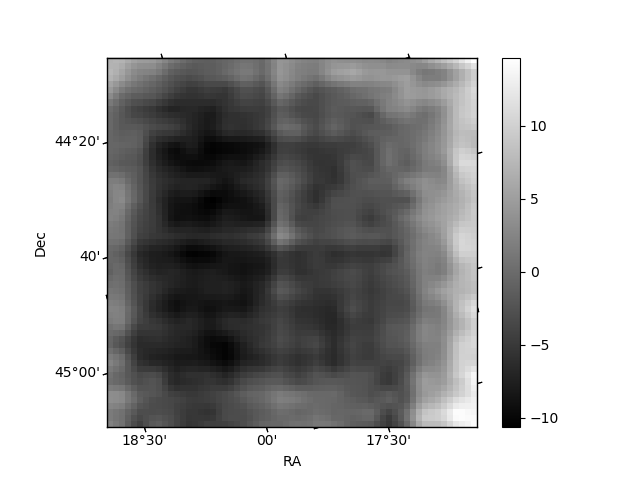
Histogram calculated using DETX and DETY for each event in the final _common_clean file
| Quadrant A | 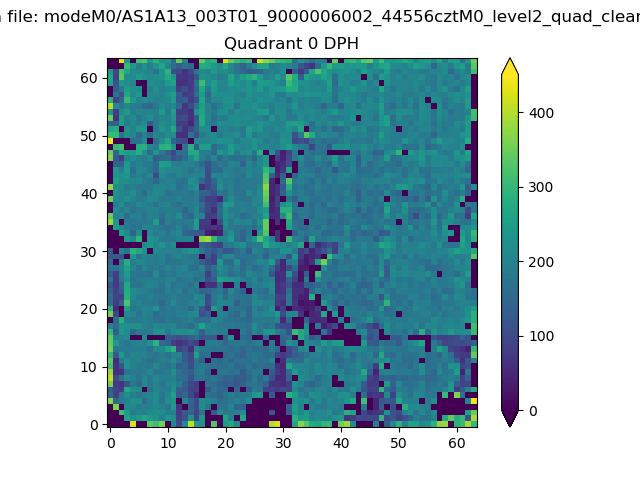 |
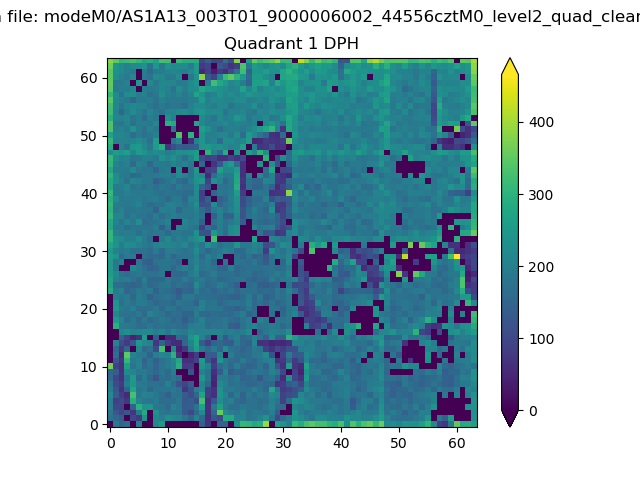 |
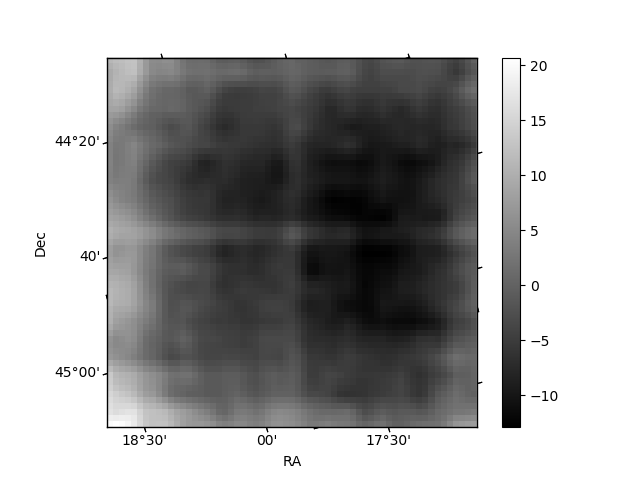
Quadrant B |
|---|---|---|---|
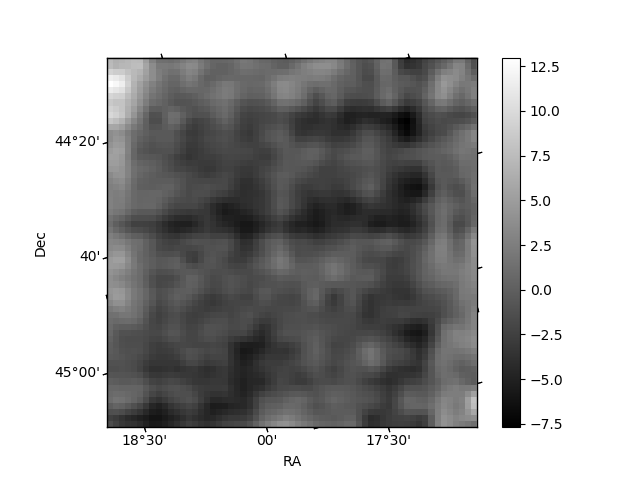
| Quadrant D | 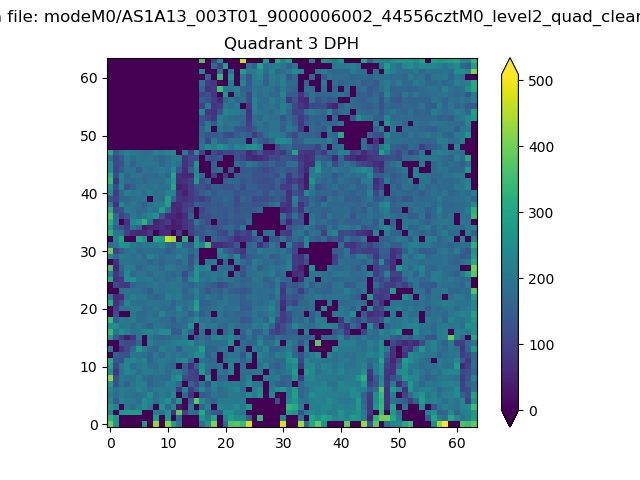 |
 |
Quadrant C |
| Plot type | Count rate plots | Images |
|---|---|---|
| Comparison with Poisson distribution Blue bars denote a histogram of data divided into 1 sec bins. Red curve is a Poisson curve with rate = median count rate of data. |
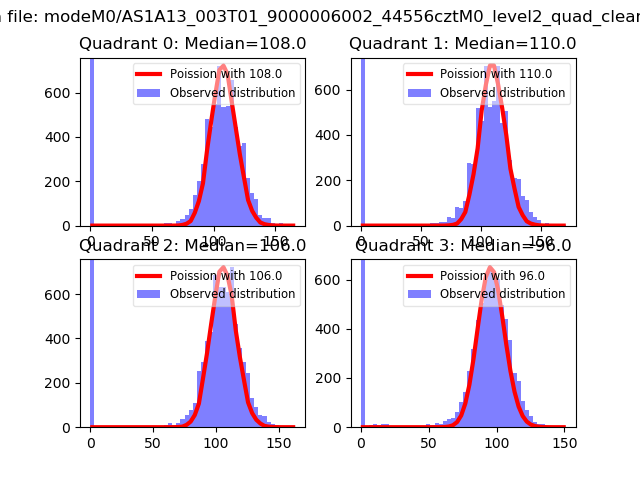 |
 |
| Quadrant-wise count rates Data is divided into 100 sec bins |
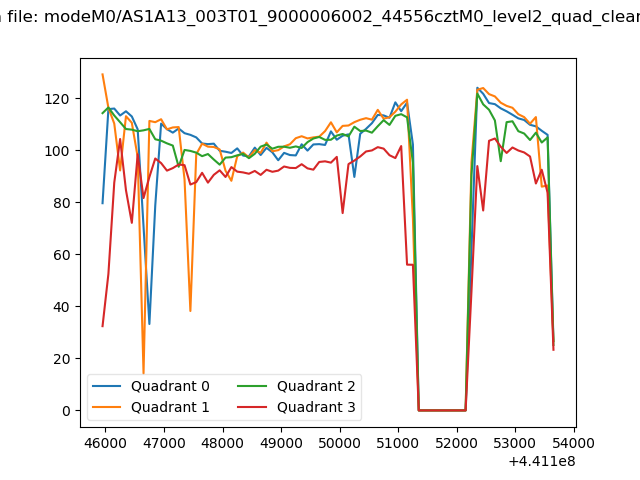 |
|
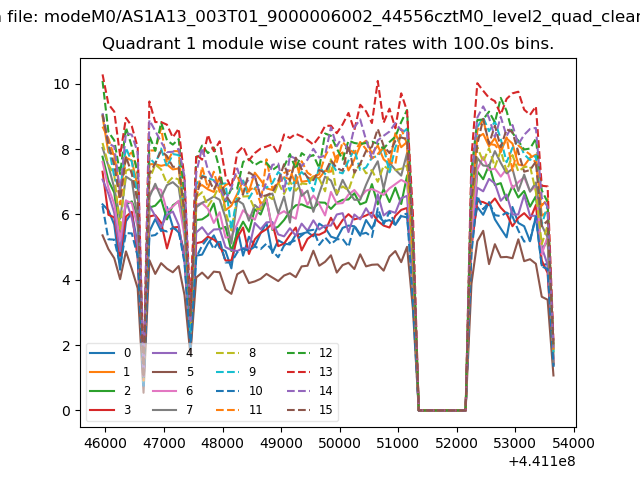
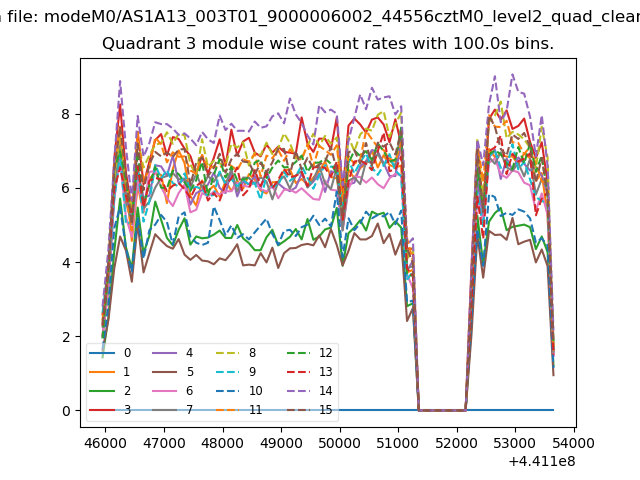
| Module-wise count rates for Quadrant A Data is divided into 100 sec bins |
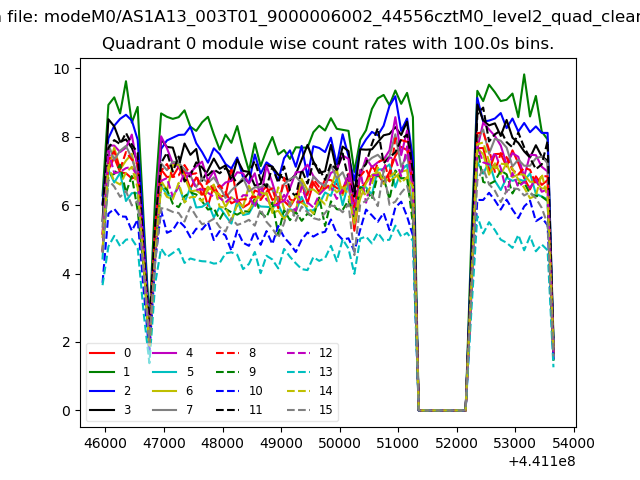 |
 |
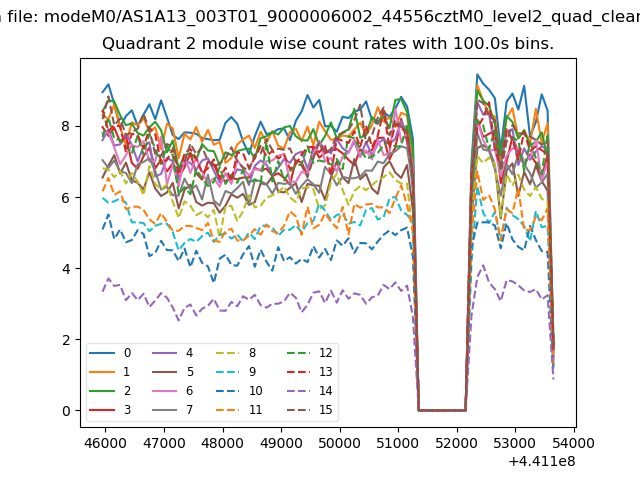
| Module-wise count rates for Quadrant B Data is divided into 100 sec bins |
 |
 |
| Module-wise count rates for Quadrant C Data is divided into 100 sec bins |
 |
 |
| Module-wise count rates for Quadrant D Data is divided into 100 sec bins |
 |
 |
| Parameter | Plot |
|---|---|
| CZT HV Monitor | 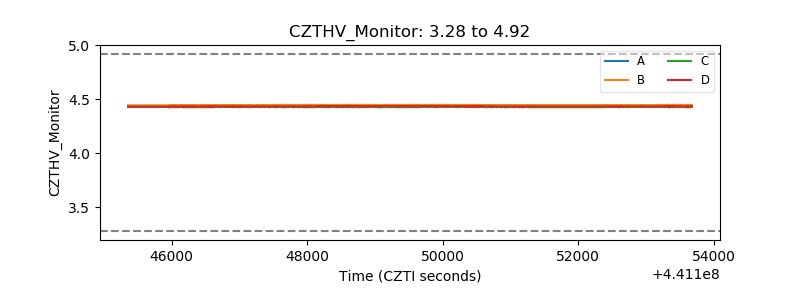 |
| D_VDD | 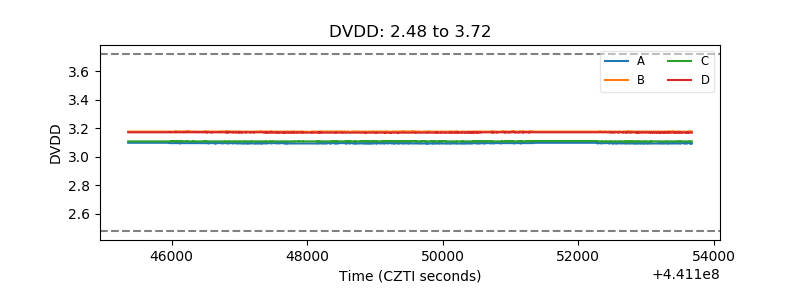 |
| Temperature 1 | 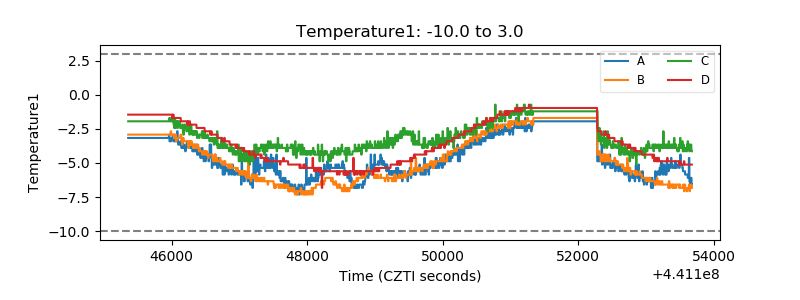 |
| Veto HV Monitor | 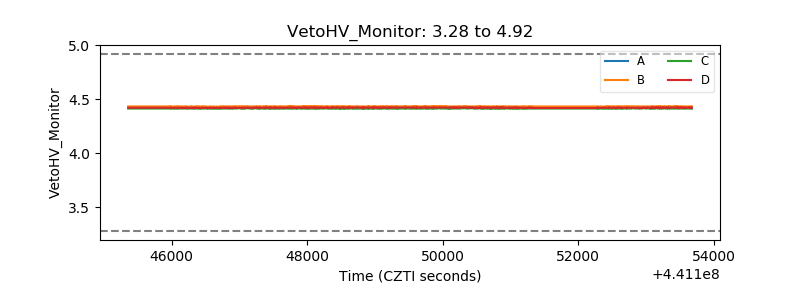 |
| Veto LLD | 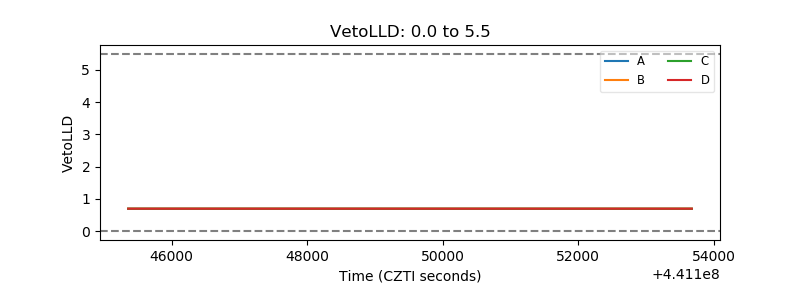 |
| Alpha Counter | 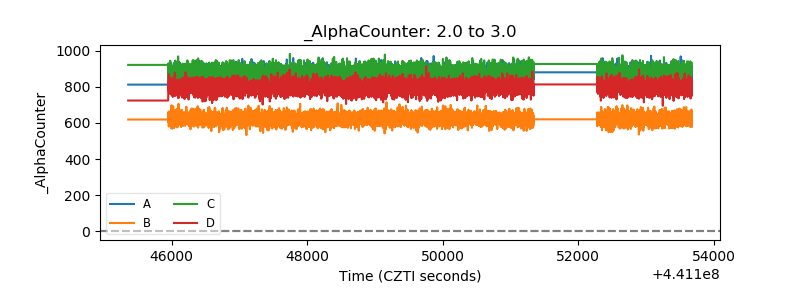 |
| _CPM_Rate | 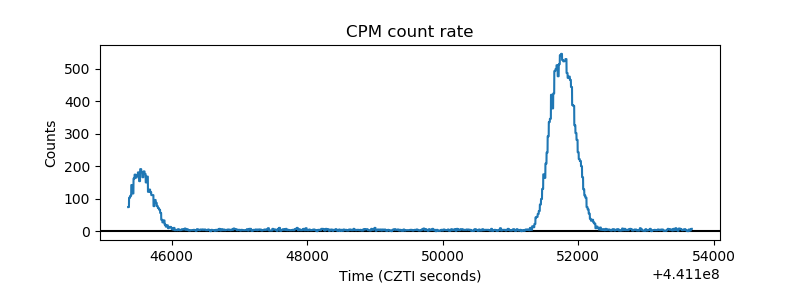 |
| CZT Counter | 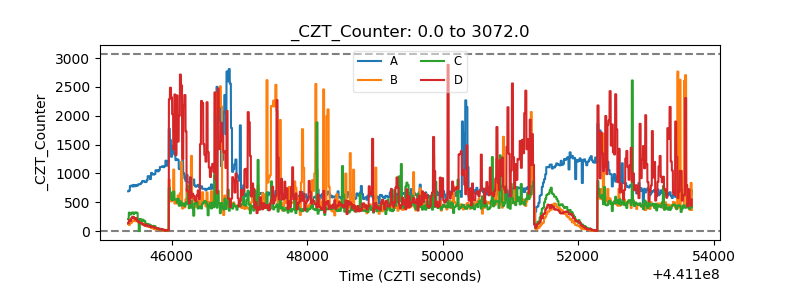 |
| +2.5 Volts monitor | 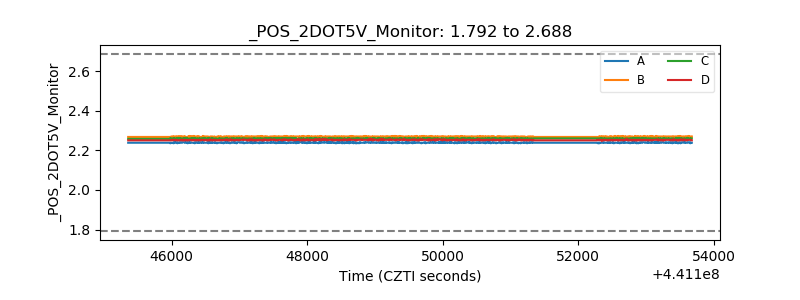 |
| +5 Volts monitor | 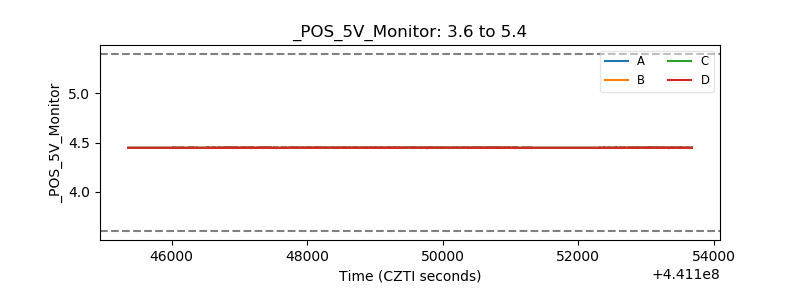 |
| _ROLL_ROT | 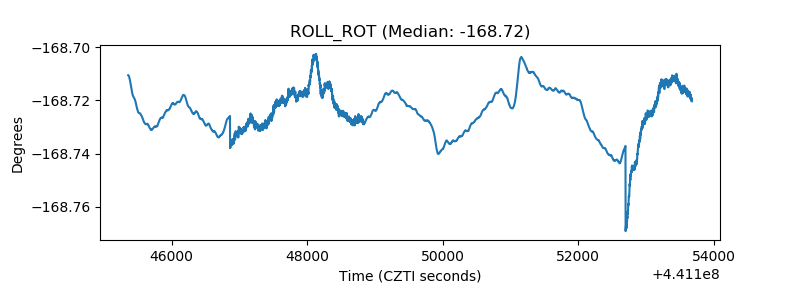 |
| _Roll_DEC | 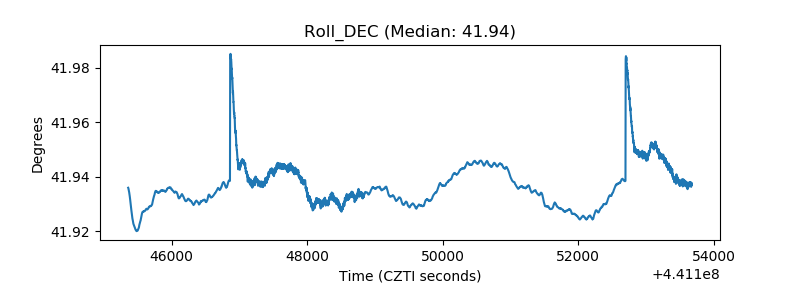 |
| _Roll_RA | 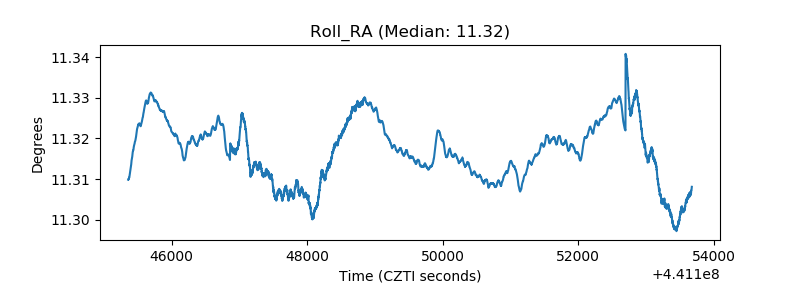 |
| Veto Counter | 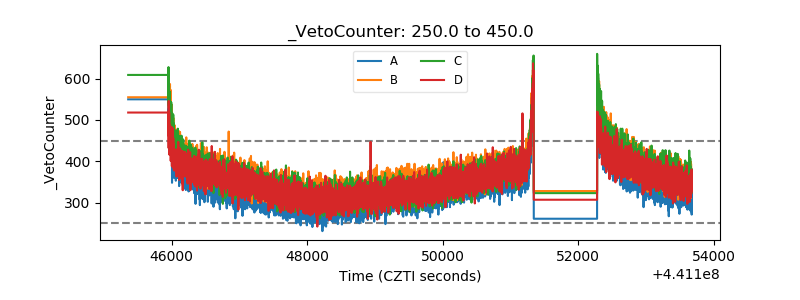 |