| Param | Original file | Final file |
|---|---|---|
| Filename | modeM0/AS1A13_003T01_9000006002_44562cztM0_level2.fits | modeM0/AS1A13_003T01_9000006002_44562cztM0_level2_quad_clean.evt |
| Size (bytes) | 490,011,840 | 113,037,120 |
| Size | 467.3 MB | 107.8 MB |
| Events in quadrant A | 5,330,343 | 753,229 |
| Events in quadrant B | 3,884,341 | 777,190 |
| Events in quadrant C | 3,776,415 | 763,375 |
| Events in quadrant D | 4,643,985 | 676,520 |
| Mode M9 | |||
|---|---|---|---|
| Quadrant | BADHDUFLAG | Total packets | Discarded packets |
| A | 0 | 14 | 0 |
| B | 0 | 15 | 0 |
| C | 0 | 15 | 0 |
| D | 0 | 15 | 0 |
| Mode SS | |||
|---|---|---|---|
| Quadrant | BADHDUFLAG | Total packets | Discarded packets |
| A | 0 | 132 | 0 |
| B | 0 | 132 | 0 |
| C | 0 | 132 | 0 |
| D | 0 | 132 | 0 |
| Mode M0 | |||
|---|---|---|---|
| Quadrant | BADHDUFLAG | Total packets | Discarded packets |
| A | 0 | 21216 | 2 |
| B | 0 | 15789 | 2 |
| C | 0 | 15501 | 2 |
| D | 0 | 18249 | 2 |
| Quadrant | Total seconds | Saturated seconds | Saturation percentage |
|---|---|---|---|
| A | 6488 | 325 | 5.009248% |
| B | 6488 | 386 | 5.949445% |
| C | 6488 | 145 | 2.234895% |
| D | 6488 | 349 | 5.379162% |
Noise dominated data is calculated using 1-second bins in cleaned event files. If a bin has >2000 counts, and if more than 50% of those come from <1% of pixels, then it is considered to be noise-dominated and hence unusable.
| Quadrant | # 1 sec bins | Bins with >0 counts | Bins with >2000 counts | High rate bins dominated by noise | Noise dominated (total time) | Noise dominated (detector-on time) | Marked lightcurve |
|---|---|---|---|---|---|---|---|
| A | 7658 | 6488 | 25 | 25 | 0.33% | 0.39% | 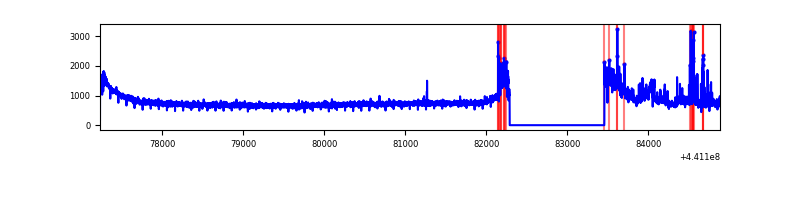 |
| B | 7658 | 6488 | 160 | 160 | 2.09% | 2.47% | 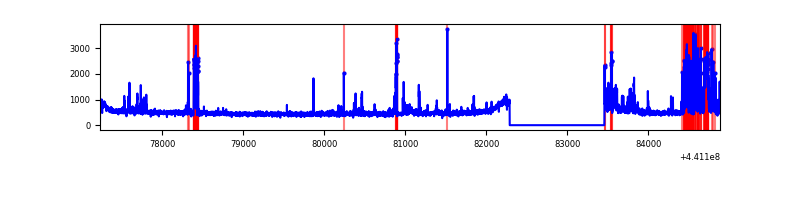 |
| C | 7658 | 6489 | 55 | 55 | 0.72% | 0.85% | 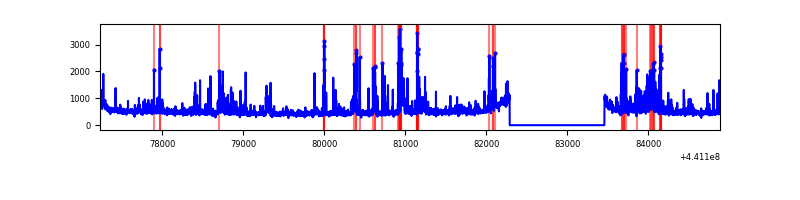 |
| D | 7658 | 6488 | 237 | 237 | 3.09% | 3.65% | 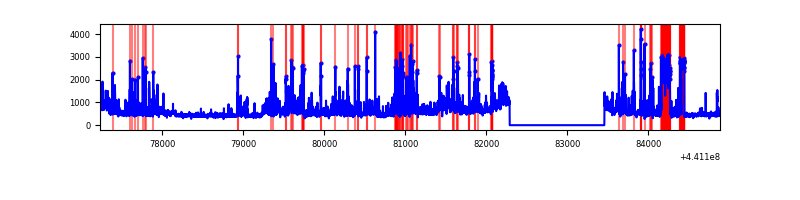 |
Top three noisy pixels from each quadrant. If the there are fewer than three noisy pixels in the level2.evt file, extra rows are filled as -1
| Pixel properties | Quadrant properties | ||||||
|---|---|---|---|---|---|---|---|
| Quadrant | DetID | PixID | Counts | Sigma | Mean | Median | Sigma |
| A | 10 | 83 | 1918319 | 12023.2 | 778 | 762 | 159.5 |
| A | 15 | 223 | 344797 | 2157.12 | 778 | 762 | 159.5 |
| A | 13 | 248 | 57138 | 353.48 | 778 | 762 | 159.5 |
| B | 5 | 172 | 511153 | 3364.15 | 778 | 753 | 151.7 |
| B | 5 | 235 | 167624 | 1099.88 | 778 | 753 | 151.7 |
| B | 5 | 32 | 69689 | 454.37 | 778 | 753 | 151.7 |
| C | 15 | 208 | 427165 | 2376.65 | 768 | 774 | 179.4 |
| C | 14 | 254 | 245430 | 1363.68 | 768 | 774 | 179.4 |
| C | 3 | 233 | 92958 | 513.82 | 768 | 774 | 179.4 |
| D | 5 | 222 | 688253 | 3664.41 | 757 | 734 | 187.6 |
| D | 7 | 38 | 390590 | 2077.9 | 757 | 734 | 187.6 |
| D | 2 | 249 | 285031 | 1515.28 | 757 | 734 | 187.6 |
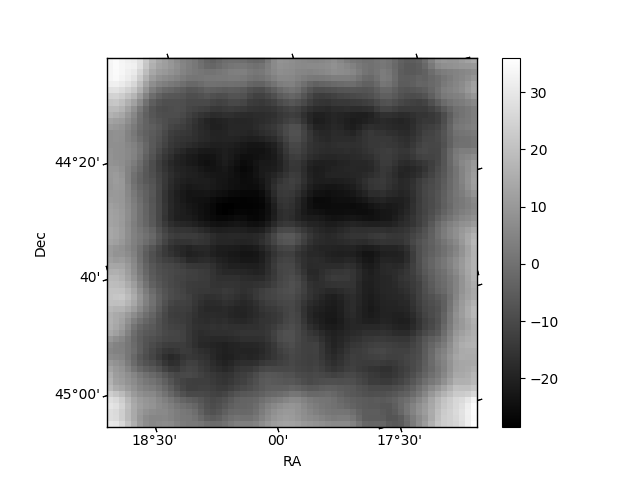
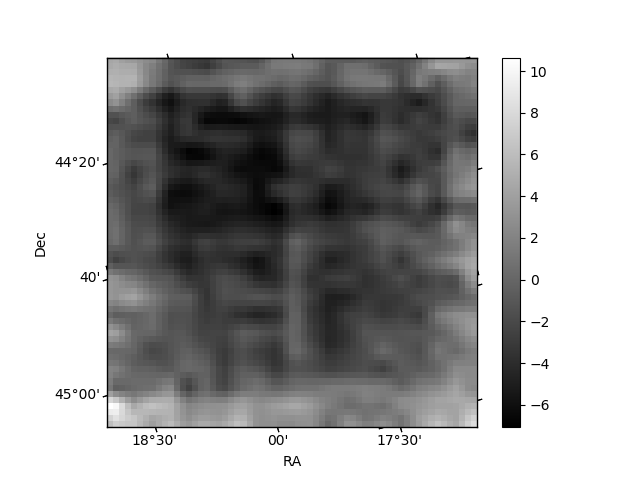
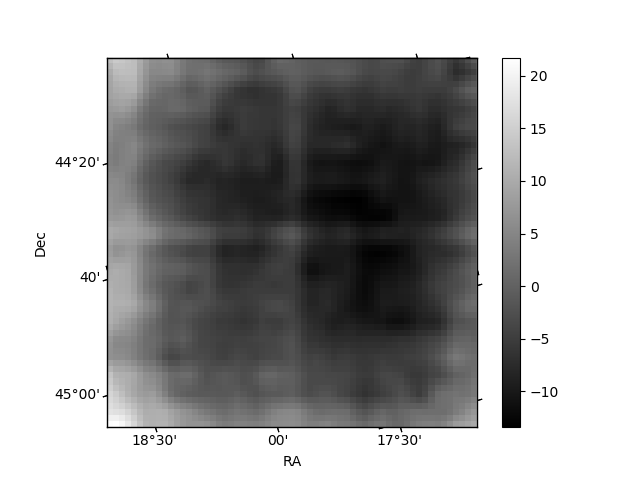
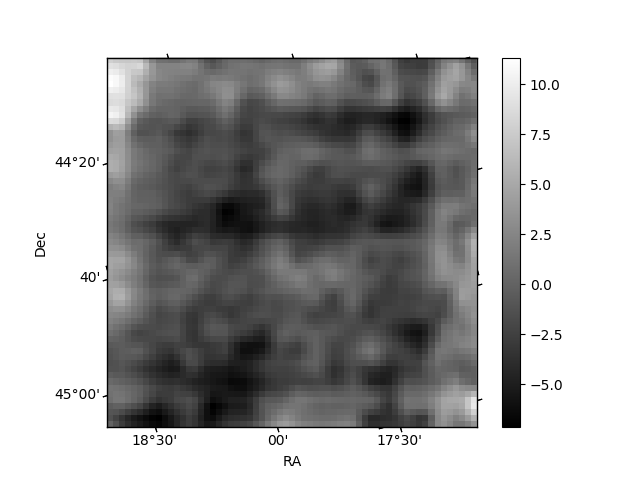
Histogram calculated using DETX and DETY for each event in the final _common_clean file
| Quadrant A | 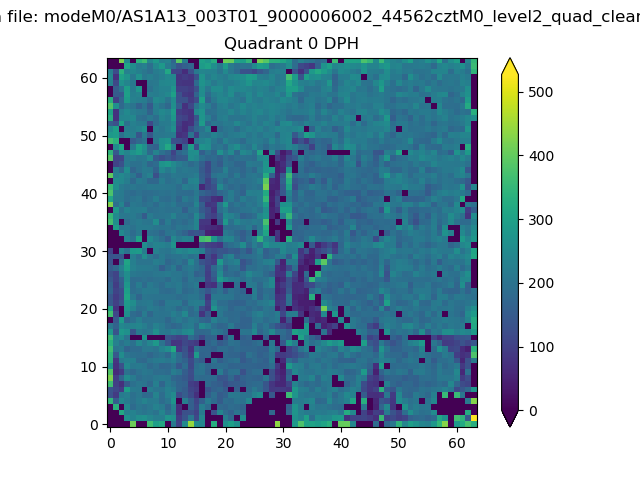 |
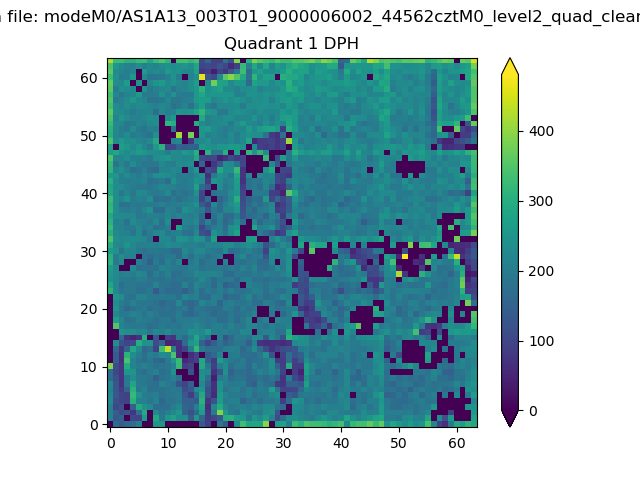 |
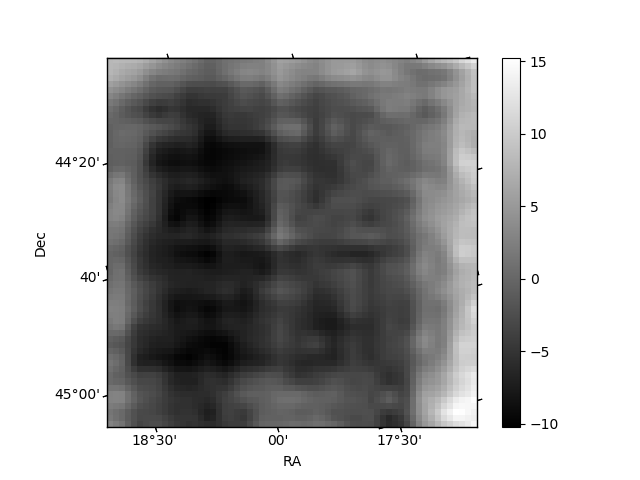
Quadrant B |
|---|---|---|---|
| Quadrant D | 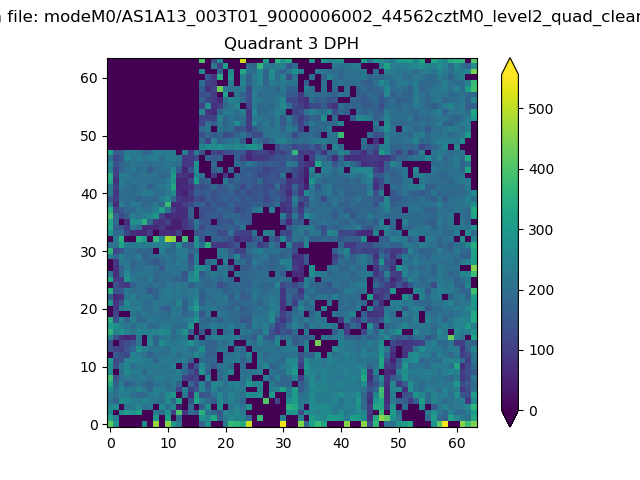 |
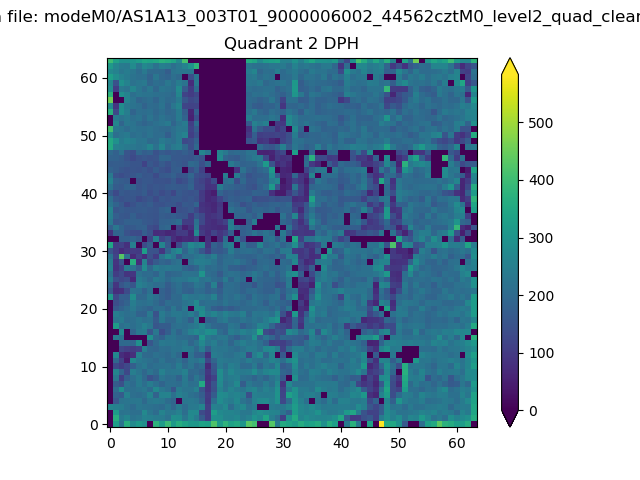 |
Quadrant C |
| Plot type | Count rate plots | Images |
|---|---|---|
| Comparison with Poisson distribution Blue bars denote a histogram of data divided into 1 sec bins. Red curve is a Poisson curve with rate = median count rate of data. |
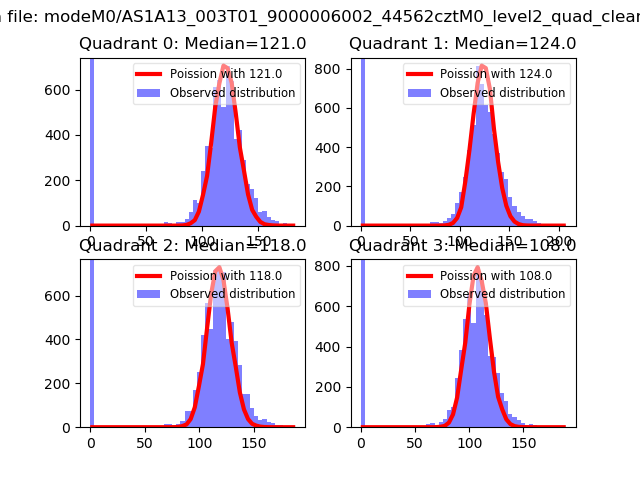 |
 |
| Quadrant-wise count rates Data is divided into 100 sec bins |
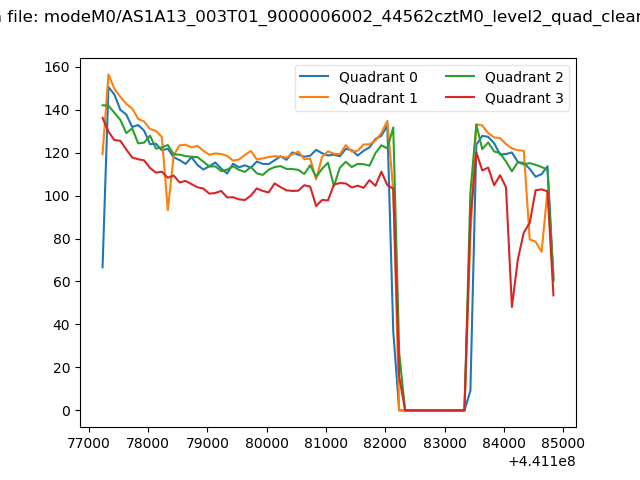 |
|
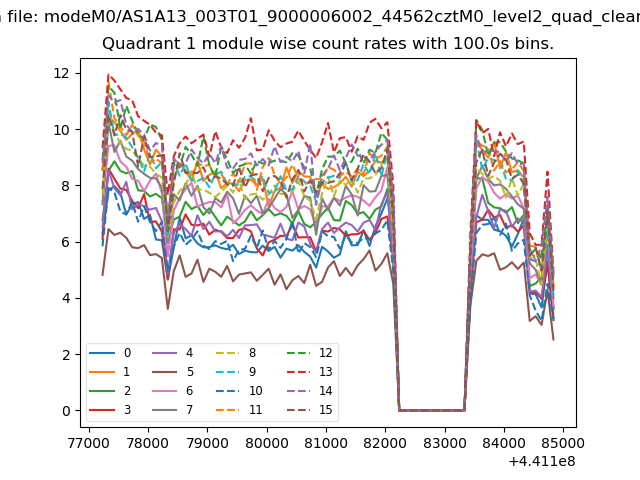
| Module-wise count rates for Quadrant A Data is divided into 100 sec bins |
 |
 |
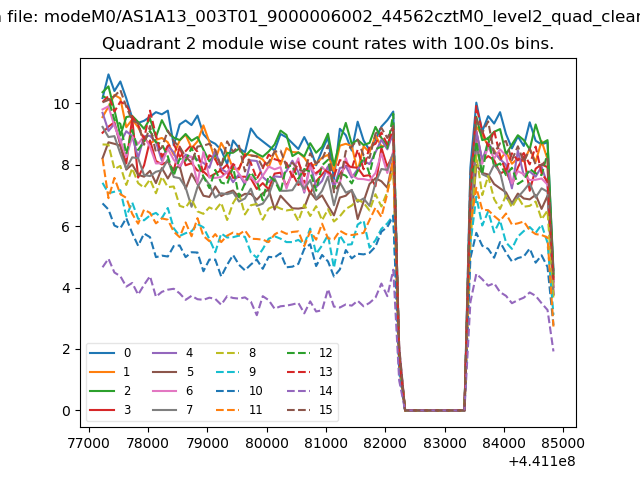
| Module-wise count rates for Quadrant B Data is divided into 100 sec bins |
 |
 |
| Module-wise count rates for Quadrant C Data is divided into 100 sec bins |
 |
 |
| Module-wise count rates for Quadrant D Data is divided into 100 sec bins |
 |
 |
| Parameter | Plot |
|---|---|
| CZT HV Monitor | 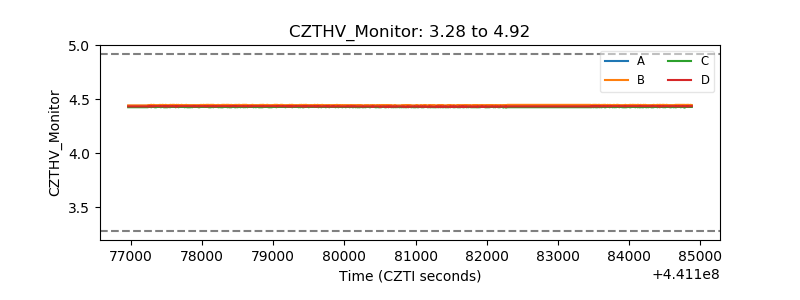 |
| D_VDD | 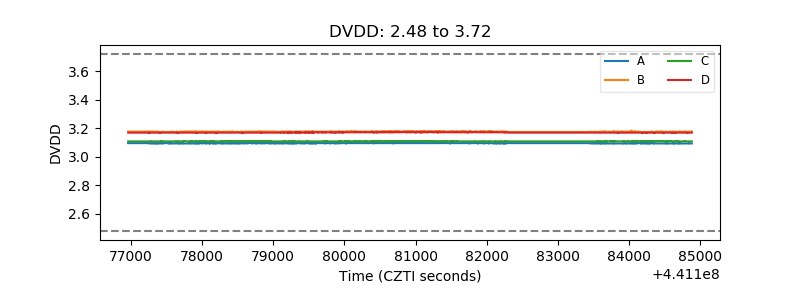 |
| Temperature 1 | 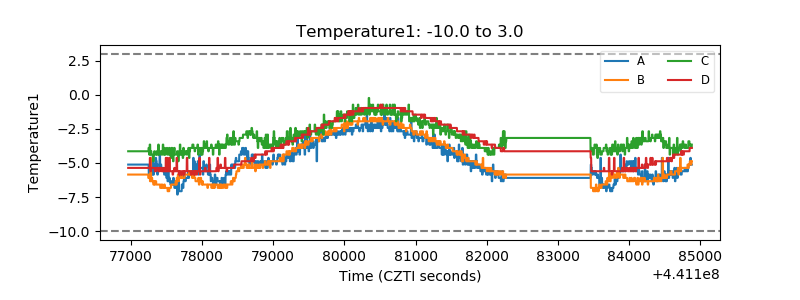 |
| Veto HV Monitor | 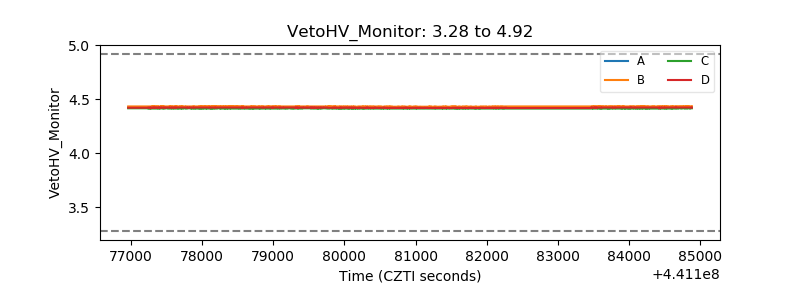 |
| Veto LLD | 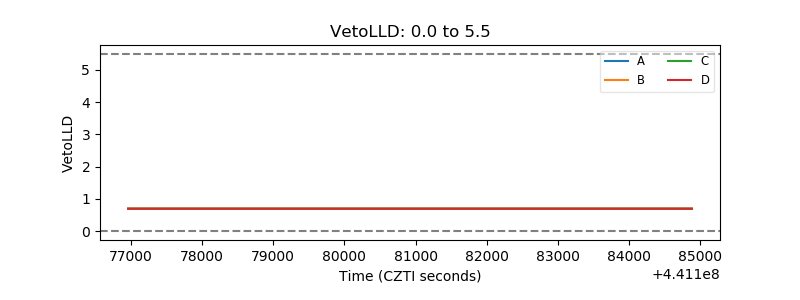 |
| Alpha Counter | 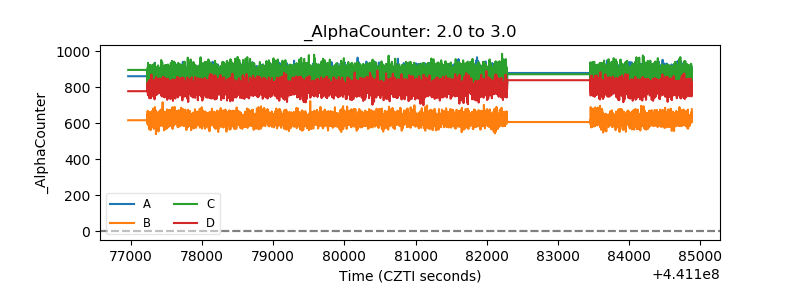 |
| _CPM_Rate | 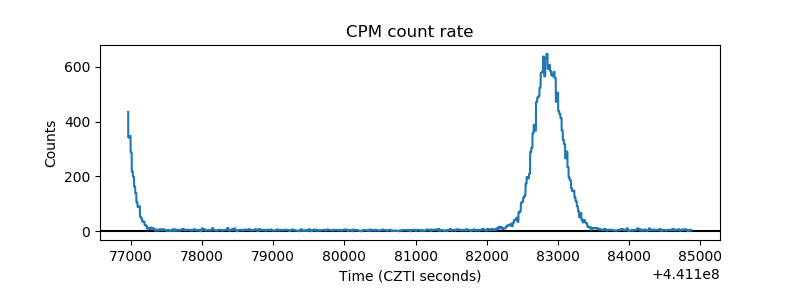 |
| CZT Counter | 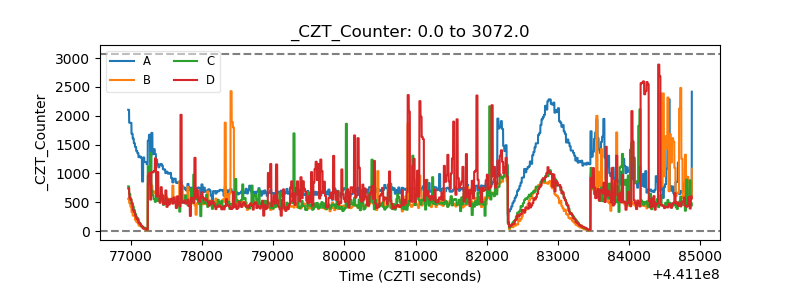 |
| +2.5 Volts monitor | 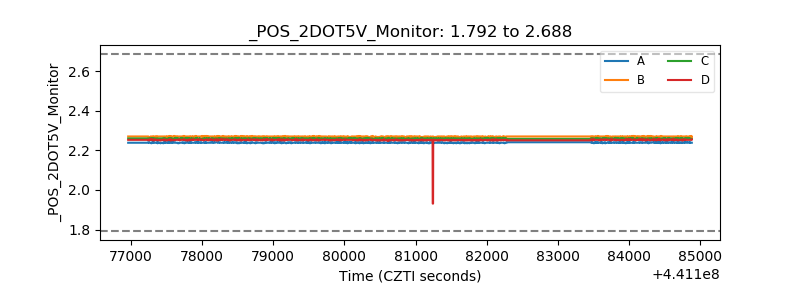 |
| +5 Volts monitor | 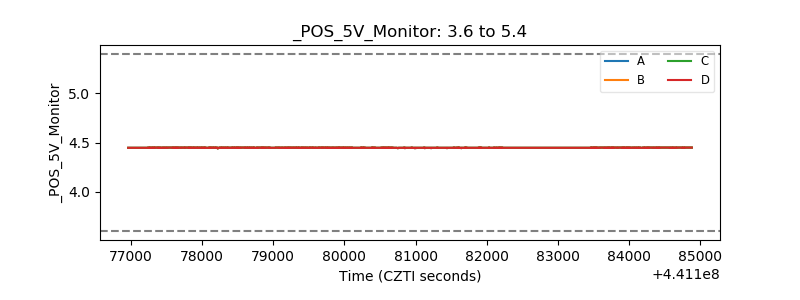 |
| _ROLL_ROT | 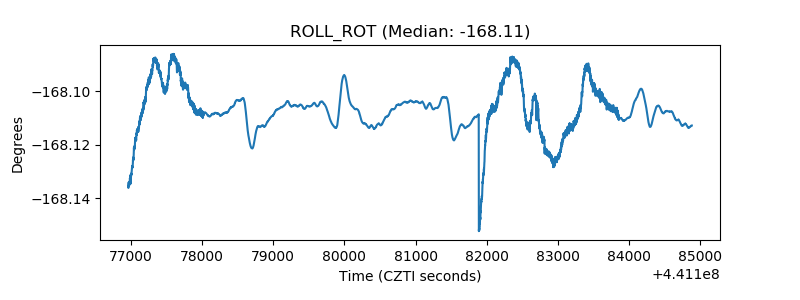 |
| _Roll_DEC | 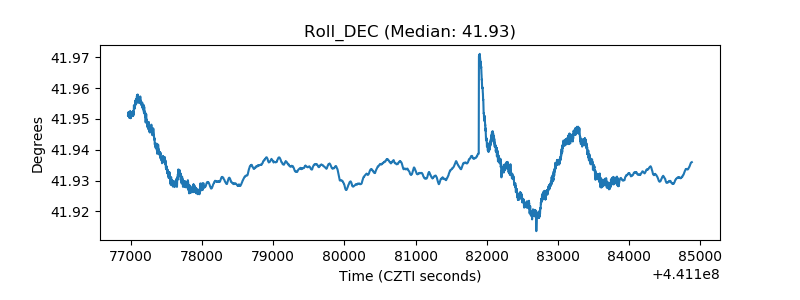 |
| _Roll_RA | 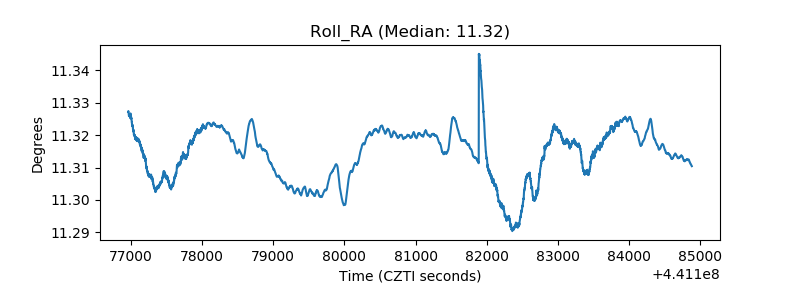 |
| Veto Counter | 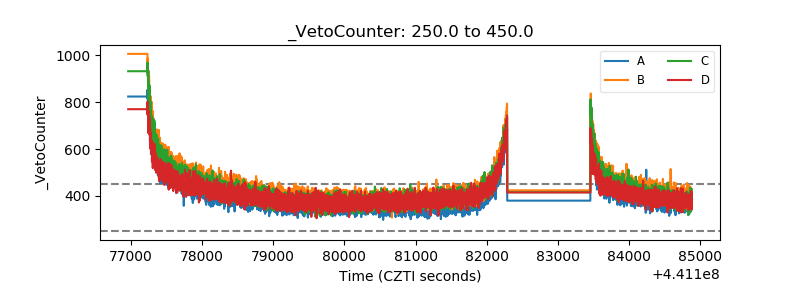 |